Managerial economics economic tools for todays decision makers 7th edtion by keat young and erfle chapter 05
Bạn đang xem bản rút gọn của tài liệu. Xem và tải ngay bản đầy đủ của tài liệu tại đây (175.97 KB, 52 trang )
Chapter 5
Demand
Estimation and
Forecasting
Chapter Outline
•
•
•
•
•
Regression analysis
Limitation of regression analysis
The importance of business forecasting
Prerequisites of a good forecast
Forecasting techniques
Copyright ©2014 Pearson Education, Inc. All rights reserved.
5-2
Learning Objectives
• Understand the importance of forecasting in
business
• Know how to specify and interpret a regression
model
• Describe the major forecasting techniques used in
business and their limitations
• Explain basic smoothing methods of forecasting,
such as the moving average and exponential
smoothing
Copyright ©2014 Pearson Education, Inc. All rights reserved.
5-3
Data Collection
• Statistical analyses are only as good as the
accuracy and appropriateness of the sample of
information that is used.
• Several sources of data for business analysis:
– buy from data providers (e.g. ACNielsen, IRI)
– perform a consumer survey
– focus groups
– technology: point-of-sale data sources
Copyright ©2014 Pearson Education, Inc. All rights reserved.
5-4
Regression Analysis
• Regression analysis: a procedure commonly used
by economists to estimate consumer demand with
available data
Two types of regression:
–
–
cross-sectional: analyze several variables for a single period of time
time series data: analyze a single variable over multiple periods of time
Copyright ©2014 Pearson Education, Inc. All rights reserved.
5-5
Regression Analysis
• Regression equation: linear, additive
eg: Y = a + b1X1 + b2X2 + b3X3 + b4X4
Y: dependent variable
a: constant value, y-intercept
Xn: independent variables, used to explain Y
bn: regression coefficients (measure impact
Copyright ©2014 Pearson Education, Inc. All rights reserved.
of independent variables)
5-6
Regression Analysis
• Interpreting the regression results:
Coefficients:
–
–
–
negative coefficient shows that as the independent variable (Xn) changes, the
variable (Y) changes in the opposite direction
positive coefficient shows that as the independent variable (Xn) changes, the
dependent variable (Y) changes in the same direction
The regression coefficients are used to compute the elasticity for each variable
Copyright ©2014 Pearson Education, Inc. All rights reserved.
5-7
Regression Analysis
• Statistical evaluation of regression results:
–
t-test: test of statistical significance of each estimated coefficient (whether the
coefficient is significantly different from zero)
bˆ
t=
b= estimated coefficient
SE
Seb
=
standard error ofbˆ estimated coefficient
Copyright ©2014 Pearson Education, Inc. All rights reserved.
5-8
Regression Analysis
• Statistical evaluation of regression results:
–
–
‘rule of 2’: if absolute value of t is greater than 2, estimated coefficient is significant
at the 5% level (for large samples-for small samples, need to use a t table)
if coefficient passes t-test, the variable has a significant impact on demand
Copyright ©2014 Pearson Education, Inc. All rights reserved.
5-9
Regression Analysis
• Statistical evaluation of regression results
–
2
R (coefficient of determination): percentage of variation in the variable (Y)
accounted for by variation in all explanatory variables (Xn)
R2 value ranges from 0.0 to 1.0
The closer to 1.0, the greater the explanatory power of
the regression.
Copyright ©2014 Pearson Education, Inc. All rights reserved.
5-10
Regression Analysis
• Statistical evaluation of regression results
–
F-test: measures statistical significance of the entire regression as a whole (not each
coefficient)
Copyright ©2014 Pearson Education, Inc. All rights reserved.
5-11
Regression Analysis
• Steps for analyzing regression results
–
check coefficient signs and magnitudes
–
compute elasticity coefficient
–
determine statistical significance
Copyright ©2014 Pearson Education, Inc. All rights reserved.
5-12
Regression Analysis
• Textbook example: Management lessons from
estimating demand for pizza
– demand for pizza affected by
1. price of pizza
2. price of complement (soda)
–
–
managers can expect price decreases to lead to lower revenue
tuition and location are not significant
Copyright ©2014 Pearson Education, Inc. All rights reserved.
5-13
Regression Analysis
• Challenges
– Identification
– Multicollinearity
– Autocorrelation
Copyright ©2014 Pearson Education, Inc. All rights reserved.
5-14
Regression Analysis
• Challenge 1: Identification problem:
– The estimation of demand may produce biased results due to simultaneous shifting
of supply and demand curves.
–
Solution: use of advanced correction techniques, such as two-stage least squares
and indirect least squares may compensate for the bias
Copyright ©2014 Pearson Education, Inc. All rights reserved.
5-15
Regression Analysis
• Challenge 2: Multicollinearity problem
– Two or more independent variables are highly correlated, thus it is difficult to
separate the effect each has on the dependent variable.
–
Solution: a standard remedy is to drop one of the closely related independent
variables from the regression
Copyright ©2014 Pearson Education, Inc. All rights reserved.
5-16
Regression Analysis
• Challenge 3: Autocorrelation problem
– Also known as serial correlation, occurs when the dependent variable relates to the Y
variable according to a certain pattern
–
–
Note: possible causes include omitted variables, or non-linearity; Durbin-Watson
statistic is used to identify autocorrelation
Solution: to correct autocorrelation consider transforming the data into a different
order of magnitude or introducing leading or lagging data
Copyright ©2014 Pearson Education, Inc. All rights reserved.
5-17
Forecasting
• “Forecasting is very difficult, especially into the
future.”
• Common subjects of business forecasts:
– gross domestic product (GDP)
– components of GDP
• examples: consumption expenditure, producer durable
equipment expenditure, residential construction
–
industry forecasts
• example: sales of products across an industry
–
sales of a specific product
Copyright ©2014 Pearson Education, Inc. All rights reserved.
5-18
Forecasting
• A good forecast should:
– be consistent with other parts of the business
– be based on knowledge of the relevant past
– consider the economic and political environment as well as changes
– be timely
Copyright ©2014 Pearson Education, Inc. All rights reserved.
5-19
Forecasting Techniques
• Factors in choosing the right forecasting technique:
– item to be forecast
– interaction of the situation with the forecasting methodology--the value and costs
– amount of historical data available
– time allowed to prepare forecast
Copyright ©2014 Pearson Education, Inc. All rights reserved.
5-20
Forecasting Techniques
• Six forecasting techniques
– expert opinion
– opinion polls and market research
– surveys of spending plans
– economic indicators
– projections
– econometric models
Copyright ©2014 Pearson Education, Inc. All rights reserved.
5-21
Forecasting Techniques
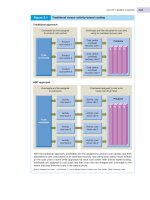
• Approaches to forecasting
–
qualitative forecasting is based on judgments expressed by individuals or group
–
quantitative forecasting utilizes significant amounts of data and equations
Copyright ©2014 Pearson Education, Inc. All rights reserved.
5-22
Forecasting Techniques
• Approaches to quantitative forecasting:
–
–
naïve forecasting projects past data without explaining future trends
causal (or explanatory) forecasting attempts to explain the functional relationships
between the dependent variable and the independent variables
Copyright ©2014 Pearson Education, Inc. All rights reserved.
5-23
Forecasting Techniques
• Expert opinion techniques
–
Jury of executive opinion: forecasts generated by a group of corporate executives
assembled together
Copyright ©2014 Pearson Education, Inc. All rights reserved.
5-24
Forecasting Techniques
• Expert opinion techniques
–
The Delphi method: a form of expert opinion forecasting that uses a series of
questions and answers to obtain a consensus forecast, where experts do not meet
Copyright ©2014 Pearson Education, Inc. All rights reserved.
5-25