WRITING TASK 1 PIE CHART
Bạn đang xem bản rút gọn của tài liệu. Xem và tải ngay bản đầy đủ của tài liệu tại đây (1.55 MB, 37 trang )
WRITING TASK 1
PIE CHART
Ms.Thi’s English Classes
LƯU Ý KHI VIẾT BÀI DẠNG PIE CHART
1. Dàn bài như thường lệ sẽ gồm 4 khổ.
+ Introduction:Giới thiệu pie chart nói về cái gì.
+ Overview: Viết 2 câu mô tả 2 đặc điểm chung của biểu đồ. Chỉ cần là
2 đặc điểm nổi bật của biểu đồ là được. Lưu ý không đưa số liệu cụ
thể vào phần này.
+ Body 1 & Body 2: Mô tả pie chart một cách chi tiết., so sánh các số
liệu.
2. Trong pie chart, các số liệu đưa ra thường chính xác, không có số
liệu xấp xỉ.
3. Cách giải pie chart giống cách giải dạng biểu đồ cột, bảng thông tin.
Cách viết không có gì thay đổi.
Ms.Thi’s English Classes
1
The online shopping sales for retail sectors
The two pie charts below show the online shopping
sales for retail sectors in Canada in 2005 and 2010.
Summarise the information by selecting and reporting
the main features, and make comparisons where
relevant.
Write at least 150 words.
Ms.Thi’s English Classes
Ms.Thi’s English Classes
TASK 1 PLAN
paraphrase task heading
summary paragraph – key features [1] changes in the
percentages for the different sectors during the period
[2] while the figures for food and beverages and also
video games increased, the figures for the other two
sectors fell.
paragraph 3: details for the sectors with increased
percentages.
paragraph 4: details for the sectors with reduced
percentages.
Ms.Thi’s English Classes
ANSWER
The charts compare four retail sectors in Canada in terms of the
proportion of their internet sales in two years, 2005 and 2010.
Overall, the proportion of online sales for each of the four sectors
changed significantly from 2005 to 2010. While the figures for
food and beverages and also video games increased, the figures
for the other two sectors fell.
In 2005, the proportion of online sales of food and beverages was
22%, but this rose to 32% in 2010. The percentage for internet
sales of video games also went up, by 5% from the 2005 figure of
18%.
Ms.Thi’s English Classes
In contrast, the percentages of the online sales of the other
sectors decreased. The most dramatic fall was in the home
furnishings retail sector. While this figure was 25% of the
total online sales of these four sectors in 2005, it fell to
just 15% in 2010. There was also a decrease in the
electronics and appliances sector, which saw a fall from
35% in 2005 to 30% in 2010.
170 words
Ms.Thi’s English Classes
IELTS Grammar: number, amount, proportion, figure
Somebody asked me about the difference between these 4 words (for
IELTS writing task 1). I'll try to explain some basic ways to use them.
number
• Use "the number of + plural noun" e.g. the number of visitors.
• Don't use it to describe percentages or uncountable nouns e.g.
money.
amount
• Use "the amount of + uncountable noun" e.g. the amount of money.
• Don't use it with countable nouns e.g. the amount of
person/people.
Ms.Thi’s English Classes
proportion
• Only use this to describe percentages (not numbers).
• Use "the proportion of + plural noun" e.g. the proportion of people.
figure
• Use "the figure for + plural noun" e.g. the figure for visitors to the
UK.
• Use it with uncountable nouns e.g. the figure for unemployment.
• Use it with countries e.g. the figure for Canada.
• Use it with percentages e.g. the figure (for...) rose to 10%.
Note:
If you've read any of my task 1 essays, you'll see that I like "the figure
for" because it can be used in almost any situation.
Ms.Thi’s English Classes
2
The average household expenditures in Japan and
Malaysia
The pie charts below show the average household
expenditures in Japan and Malaysia in the year 2010.
Summarise the information by selecting and reporting the
main features, and make comparisons where relevant.
Ms.Thi’s English Classes
Ms.Thi’s English Classes
TASK 1 PLAN
paraphrase task heading
summary paragraph – key features [1] identify 3
highest categories [2] proportion spent per
household on transport and health care in Japan
were double the figures for Malaysia.
compare spending on 3 highest categories
compare expenditure on 2 lowest categories
Ms.Thi’s English Classes
ANSWER
The charts compare the average household spending in Japan
and Malaysia in terms of five important categories in 2010.
Overall, it is clear that householders in both countries spent
the largest proportion of their income on just three categories
– housing, food and other goods and services. The percentage
figures for spending on transport and healthcare in Japan
were double those for Malaysia.
Ms.Thi’s English Classes
In Malaysian households, the highest category was housing,
which represented 34% of the total expenditure. Whereas
this was higher than in Japan, with just 21% spent on
housing,
Japanese
householders
spent
the
highest
proportion on a range of other goods and services, at 29%.
This was slightly more than in Malaysia. In terms of food,
the figures for both countries were similar, at 27% and 24%
for Malaysia and Japan respectively.
Ms.Thi’s English Classes
Expenditure on health care was the lowest category. In Japan,
this accounted for 6% of the total, while 20% of household
spending went on transport. These figures were exactly
double (*) those shown for Malaysia.
167 words.
(*)
If any students are confused by the use of ‘twice’ and ‘double’,
this dictionary has a clear definition:
/>In addition, you can direct them to Simon’s blog of November
01, 2012.
Ms.Thi’s English Classes
Vocabulary note: Về từ vựng
spending: [noun] [mức chi tiêu] the amount of money
spent by an organisation or a person. (Ex: The government
promised to increase spending on hospitals and schools.
double: [adjective] [gấp đôi] twice the amount or number
of something. Example: I earn $100 dollars a week, but my
friend earns double that salary.
whereas: [adverb] [trái lại] used to contrast two facts.
Example: We thought she was unfriendly, whereas she was
just shy.
Ms.Thi’s English Classes
in terms of: [expression] [xét về mặt] used to show what
aspect of a subject you are writing about. Example: In terms
of enjoying good food, the Tet holiday is my favourite time of
the year.
accounted for: [phrasal verb] [chiếm] was a particular part or
amount of something. Example: The Japanese market
accounted for 20% of our exports last year.
Ms.Thi’s English Classes
3 electricity generation by source in New
Zealand and Germany
The pie charts below show electricity generation by source in New
Zealand and Germany in 1980 and 2010.
Summarise the information by selecting and reporting the main
features, and make comparisons where relevant.
Ms.Thi’s English Classes
Electricity Generation by Source in New Zealand
Ms.Thi’s English Classes
Electricity Generation by Source in Germany
Ms.Thi’s English Classes
TASK 1 PLAN
paraphrase task heading
summary paragraph – key features [1] more units of
electricity were used in both countries in 2010 than in
1980 [2] in 2010 nuclear power became the predominant
fuel source in Germany, in contrast to coal in NZ.
paragraph 3: compare total units of electricity generated in
both countries in 1980 and 2010.
paragraph 4: compare the fuel sources in both 1980 in NZ
and Germany.
paragraph 5. do the same for 2010. Note changes over the
two years.
Ms.Thi’s English Classes
ANSWER
The charts compare the units of electricity produced in New
Zealand and Germany in 1980 and 2010 from 5 fuel sources.
Overall, more units of electricity were produced in 2010 than
in 1980 in both countries. In 2010, most electricity was
produced by nuclear power in Germany and by coal in New
Zealand.
(In 1980, total electricity production was higher in New
Zealand than in Germany, with 127 and 107 units respectively.
By 2010, the total electricity generated rose to 200 units in
New Zealand, but increased in Germany to 214 units.)
Ms.Thi’s English Classes
In 1980, coal was the main source of electricity in New
Zealand. It produced 56 units, which was twice the figure for
Germany. Natural gas and hydro each accounted for 30 units in
New Zealand, with 11 units for coal. In contrast, in Germany,
the figures for natural gas, nuclear and hydro power were 28
units, 20 units and only 7 units respectively.
There were 2 main sources of electricity production in New
Zealand in 2010, coal [150 units] and hydro [46 units].
Nuclear power was used to generate 155 units in Germany.
Although the figure for natural gas fell to only 2 units, coal [28
units] and petroleum [27 units] remained significant.
Ms.Thi’s English Classes
4
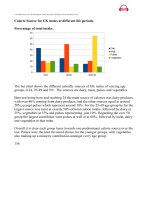
The number of research students in Australian
universities
Ms.Thi’s English Classes
REPORT PLAN
Paraphrase: sentence [1] the table compares; sentence [2] the
pie charts illustrate
Summary paragraph: total number of students carrying out
research increased; a higher % of research students were local.
Paragraph 3: the table – give total numbers 2001 and 2010;
growth in the number of international research students.
Paragraph 4: the pie charts - % of local research students in
2001 and 2010; contrast % of international students. Compare
figures and trends [1] for male and female local students [2] for
male and female international students in 2001/2010.
Ms.Thi’s English Classes