To accompany contemprory strategy analysis concepts techiniques application chapter04slides
Bạn đang xem bản rút gọn của tài liệu. Xem và tải ngay bản đầy đủ của tài liệu tại đây (151.11 KB, 17 trang )
Further
Further Topics
Topics in
in Industry
Industry
and
and Competitive
Competitive Analysis
Analysis
OUTLINE
Extending 5-forces analysis
o Does industry matter?
o Complements
o Dynamic competition
Game Theory
Competitor Analysis
Segmentation
Strategic Groups
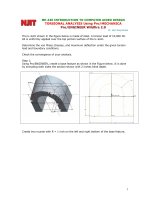
Does
Does Industry
Industry Matter?
Matter?
Schmalensee
(1985)
Rumelt (1991)
McGahan &
Porter 1997)
Hawawini et al
(2003)
Percentage of variance in firms’ return on assets
explained by:
Industry
Firm-specific
Unexplained
effects
effects
variance
19.6%
0.6%
80.4%
4.0%
44.2%
44.8%
18.7%
31.7%
48.4%
8.1%
35.8%
52.0%
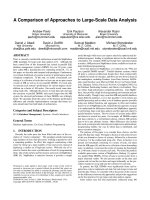
The
The Value
Value Net
Net
CUSTOMERS
COMPETITORS
COMPANY
SUPPLIERS
COMPLEMENTORS
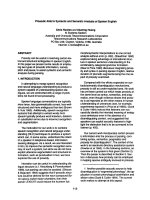
Five
Five Forces
Forces or
or Six?
Six? Introducing
Introducing Complements
Complements
SUPPLIERS
Bargaining power of suppliers
The suppliers of
complements create
value for the industry
and can exercise
bargaining power
INDUSTRY
COMPETITORS
POTENTIAL
ENTRANTS
COMPLEMENTS
Threat of
new entrants
Threat of
Rivalry among
existing firms
Bargaining power of buyers
BUYERS
SUBSTITUTES
substitutes
Dynamic
Dynamic Competition
Competition
Porter framework assumes:
(a) industry structure drives competitive behavior
(b) Industry structure is (fairly) stable.
But, competition also changes industry structure:
•
Schumpeterian Competition: A “perennial gale of creative
destruction” where firm strategies continually transforms industry
structure innovation overthrows established market leaders
•
Hypercompetition: “intense and rapid competitive
moves….creating disequilibrium through continuously creating
new competitive advantages and destroying, obsolescing or
neutralizing opponents’ competitive advantages
Implication: Under dynamic competition, 5-forces framework is
less useful—Competitive behavior and industry structure jointly
determined by underlying conditions of technology, demand &
costs
The
The Contribution
Contribution of
of Game
Game Theory
Theory
to
to Competitive
CompetitiveAnalysis
Analysis
Main value:
1.
2.
Framing strategic decisions as interactions between competitors
Predicting outcomes of competitive situations involving a few,
evenly-matched players
Some key concepts:
1.
2.
3.
4.
Competition and Cooperation—Game theory can show conditions
where cooperation more advantageous than competition
Deterrence—changing the payoffs in the game in order to deter
a competitor from certain actions
Commitment—irrevocable deployments of resources that
give creditability to threats
Signaling—communication to influence a competitor's decision
Problems of game theory:
Useful in explaining past competitive behavior—weak in predicting
future competitive behavior.
What’s the problem? — Multitude of models, outcomes highly sensitive
to small changes in assumptions
A
A Framework
Framework for
for Competitor
Competitor Analysis
Analysis
OBJECTIVES
What are competitor’s current goals?
Is performance meeting there goals?
How are its goals likely to change?
STRATEGY
How is the firm competing?
ASSUMPTIONS
What assumptions does the competitor
hold about the industry and itself?
RESOURCES & CAPABILITIES
What are the competitors’ key
strengths and weaknesses?
PREDICTIONS
• What strategy changes
will the competitor
initiate?
• How will the competitor
respond to our strategic
initiatives?
Segmentation
Segmentation Analysis:
Analysis: The
The
Principal
Principal Stages
Stages
•
Identify key variables
and categories.
•
Construct a segmentation matrix
•
Analyze segment attractiveness
•
Identify KSFs in each segment
•
Analyze benefits of
broad vs. narrow scope.
Identify segmentation variables
Reduce to 2 or 3 variables
Identify discrete categories for
each variable
Potential for economies
of scope across segments
Similarity of KSFs
Product differentiation benefits
of segment focus
The Basis for Segmentation: Customer
and Product Characteristics
Industrial
Industrialbuyers
buyers
Characteristics
Characteristics
of
ofthe
theBuyers
Buyers
Household
Householdbuyers
buyers
Distribution
Distributionchannel
channel
Opportunities
Opportunitiesfor
for
Differentiation
Differentiation
Characteristics
Characteristics
of
ofthe
theProduct
Product
Geographical
Geographical
location
location
••Size
Size
••Technical
Technical
sophistication
sophistication
••OEM/replacement
OEM/replacement
••Demographics
Demographics
••Lifestyle
Lifestyle
••Purchase
Purchaseoccasion
occasion
••Size
Size
••Distributor/broker
Distributor/broker
••Exclusive/
Exclusive/
nonexclusive
nonexclusive
••General/special
General/special
list
list
••Physical
Physicalsize
size
••Price
Pricelevel
level
••Product
Productfeatures
features
••Technology
Technologydesign
design
••Inputs
Inputsused
used(e.g.
(e.g.raw
rawmaterials)
materials)
••Performance
Performancecharacteristics
characteristics
••Pre-sales
Pre-sales&&post-sales
post-salesservices
services
Characteristics
Characteristics
of
ofthe
theBuyers
Buyers
Industrial
Industrialbuyers
buyers
*Size
*Size
*Technical
*Technical
sophistication
sophistication
*OEM/replacement
*OEM/replacement
Household
Householdbuyers
buyers
*Demographics
*Demographics
*Lifestyle
*Lifestyle
*Purchase
*Purchaseoccasion
occasion
Distribution
Distributionchannel
channel
Opportunities
Opportunitiesfor
for
Differentiation
Differentiation
Characteristics
Characteristics
of
ofthe
theProduct
Product
Geographical
Geographical
location
location
*Size
*Size
*Distributor/broker
*Distributor/broker
*Exclusive/
*Exclusive/
nonexclusive
nonexclusive
*General/special
*General/special
list
list
*Physical
*Physicalsize
size
*Price
*Pricelevel
level
*Product
*Productfeatures
features
*Technology
*Technologydesign
design
*Inputs
*Inputsused
used(e.g.
(e.g.raw
rawmaterials)
materials)
*Performance
*Performancecharacteristics
characteristics
*Pre-sales
*Pre-sales&&post-sales
post-salesservices
services
Segmenting
Segmenting the
the European
European Metal
Metal Can
Can Industry
Industry
Food
Steel 3-piece
Steel 2-piece
Aluminum 2-piece
General cans
Composite cans
Aerosol cans
Fruit Juice
Pet food
Soft drink
Beer
Oil
Segmenting
Segmenting the
the World
WorldAutomobile
Automobile Market
Market
REGION
US& Canada
Luxury Cars
Full-size sedans
Mid-size sedans
Small sedans
Station wagons
Passenger minivans
Sports cars
Sport-utility
Pick-up trucks
W.Europe
E.Europe
Asia
Lat America
Australia
Africa
Vertical
VerticalSegmentation
Segmentation&& Industry
IndustryProfit
ProfitPools
Pools
—The
—TheUS
USAuto
Auto Industry
Industry
25
%
Operating margin
20
Service & repair
Leasing
15
Warranty
Auto
manufacturing
New car
dealers
10
5
Auto
loans
Used car dealers
Auto
insurance
Aftermarket
parts
Auto
rental
0
0
Gasoline
Share of industry revenue
100%
Segmentation
Segmentationand
andKey
KeySuccess
SuccessFactors
Factorsin
inthe
theU.S.
U.S.Bicycle
BicycleIndustry
Industry
SEGMENT
Low price bicycles sold primarily
through department and discount
stores, mainly under the retailer’s
own brand (e.g. Sears’ “Free Spirit”);
Medium-priced bicycles sold
primarily under manufacturer’s brand
name and distributed mainly through
specialist bicycles stores;
KEY SUCCESS FACTORS
* Low-costs through global sourcing of components
& low-wage assembly.
* Supply contract with major retailer.
Leading competitors: Taiwanese & Chinese assemblers,
some U.S manufacturers, e.g. Murray Ohio, Huffy
*Cost efficiency through large scale operation and
either low wages or automated manufacturing.
*Reputation for quality (durability, reliability) through
effective marketing to dealers and/or consumers.
* International marketing & distribution.
Leading competitors: Raleigh, Giant, Peugeot, Fuji
High-priced bicycles for enthusiasts.
Children’s bicycles (and tricycles) sold
primarily through toy retailers (discount
toy stores, department stores, and
specialist toy stores).
*Quality of components and assembly, Innovation in
design (e.g. minimizing weight and wind resistance).
*Reputation (e.g. through success in racing, through
effective brand management).
*Strong dealer relations.
Similar to low-price bicycle segment.
Strategic
Strategic Group
Group Analysis
Analysis
A strategic group is a group of firms in an industry
following the same or similar strategy.
Identifying strategic groups:
• Identify principal strategic
variables which distinguish
firms.
• Position each firm in relation
to these variables.
• Identify clusters.
Strategic
StrategicGroups
Groupsin
in the
theWorld
WorldAutomobile
Automobile Industry
Industry
GLOBAL, BROAD-LINE
PRODUCERS
e.g., GM, Ford, Toyota, Nissan,
Honda, VW, DaimlerChrysler
Broad
REGIONALLY-FOCUSED
BROAD-LINE
PRODUCERS
e.g. Fiat, PSA, Renault,
Kia,
PRODUCT
RANGE
GLOBAL SUPPLIERS OF
NARROW MODEL RANGE
e.g., Subaru, Isuzu, Suzuki,
Saab, Hyundai, Daihatsu
NATIONALLY FOCUSED,
INTERMEDIATE LINE
PRODUCERS
e.g. Tofas, Proton, Maruti
First Auto Works (China)
LUXURY CAR
MANUFACTURERS
NATIONALLY- FOCUSED,
SMALL, SPECIALIST
PRODUCERS e.g., Bristol
(U.K.), Classic Roadsters
(U.S.), Morgan (U.K.)
Narrow
National
e.g., Aston Martin, BMW,
Rolls Royce (owned by VW)
PERFORMANCE
CAR PRODUCERS
e.g., Porsche,
Ferrari (owned by
Fiat) Maserati, Lotus
GEOGRAPHICAL SCOPE
Global
Strategic
StrategicGroups
GroupsWithin
Within the
the World
World Petroleum
Petroleum Industry
Industry
Kuwait Petroleum
PDVSA
NATIONAL
Iran PRODUCTION
COMPANIES
NOC
1.5
1.0
0.5
0
Vertical Balance
2.0
INTERNATIONAL
UPSTREAM Premier
Apache
COMPANIES Oil
INTEGRATED OIL
MAJORS
INTERNATIONAL
UPSTREAM,
REGIONALLY
FOCUSED
DOWNSTREAM
Dana Petroleum
INTEGRATED
DOMESTIC
OIL COMPANIES
Exxon
-Mobil
Chevron
Peme
Petronas
INTEGRATED
Royal Dutch
Texaco
Lukoil x
PetroChina
INTERNATIONAL -Shell Gp.
Conoco
Phillips
Indian Oil
Phillips
MAJORS
Petrobras
ENI
Statoil
BP-Amoco
Elf-Fina-Total
ENI
Repsol
YPF
Repsol
Nippon
Valero
Sunoco
0
10
NATIONALLY-FOCUSED
DOWNSTREAM COMPANIES
20
30
40
INTERNATIONAL
DOWNSTREAM
OIL COMPANIES
Neste
Ashland
50
Geographical Scope
60
70
80


![small wind turbines [electronic resource] analysis, design, and application](https://media.store123doc.com/images/document/14/y/ql/medium_qlr1401476475.jpg)