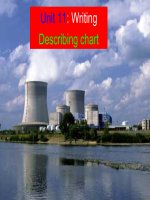
Unit 11 sources of energy writing
Bạn đang xem bản rút gọn của tài liệu. Xem và tải ngay bản đầy đủ của tài liệu tại đây (1.48 MB, 20 trang )
Click icon to add picture
Click icon to add picture
Click icon to add picture
WHATCHARTS
ARE THESE?
Unit 11: SOURCES OF ENERGY
Lesson: WRITING
VOCABULARY
SOME KEY WORDS TO DESCRIBE A CHART
made up
tạo nên
to be followed by
theo sau
increase
tăng
decrease
giảm
upward trend
có xu hướng đi lên
rapidly
nhanh chóng
dramatically
đột ngột
fall
giảm mạnh
Task 1. Study the chart about energy consumption in Highland in 2000 and fill in the gaps with the
information from the chart:
(2)
sources
of energy
are
(1)
Base
on thetotal
chart
how do
you
(3) What
How much
mentioned
in the chart?
know
energy
consumption
in
energythe
consumption
was
Highland?
They
are: Coal, nuclear power and
in 2000?
hydroelectricity.
Look
at the color of the column and
117 tons.
the numbers showed on the year 2000
and 2005.
Task 1. Study the chart about energy consumption in Highland in 2000 and fill in the gaps with the
information from the chart:
The chart shows the energy consumption in Highland in 2000. As can be seen, the total energy consumption
was (1) ________ million tons. Petroleum made up the largest amount of this figure (57 million tons). This was
117
followed by the consumption of (2)________ (40 million tons). Nuclear & Hydroelectricity made
up the (3)
_________amount of energy consumption (20 million tons).
coal
smallest
Task 2. Continue your description of the trends in energy consumption in the year 2005 in
Highland.
The total energy consumption in Highland in 2005 was well over 150 million tons. Among the three types of
energy in the chart, nuclear power and hydroelectricity power experienced the highest level of consumption of
75 million tons. The smallest amount of 41 million tons was seen in coal consumption, which was one million ton
lower than petroleum consumption. In fact, the quantity of both coal and petroleum used in 2005 only made up
more than 50% of the total figures.
Task 3. Describe the chart, using the information from Task 1 and 2.
Example: The chart shows the energy consumption in Highland in 2000 and 2005. It's clear that the total
energy consumption was 287 millions tons in two years. Petroleum made up the largest amount in 2000
(57 million tons) whereas the petroleum consumption was 50 million in 2005. In 2000 the consumption of
coal came the second (40 million tons); however this consumption came the third (45 millions tons) in
2005 after the petroleum consumption. And the consumption of Nuclear and Hydroelectricity was 20
million in 2000. Nevertheless. Nuclear and I Hydroelectricity consumption was 75 million tons in 2005. In
conclusion, the I energy consumption in Highland in 2000 is less than that in 2005.
Picture with caption layout
Click icon to add picture
Caption
Click icon to add picture
Caption
Two pictures with captions
Click icon to add picture
Caption
Click icon to add picture
Click icon to add picture
Click icon to add picture
Three pictures with caption
Caption
Click icon to add picture
Click icon to add picture
Five pictures
Click icon to add picture
Click icon to add picture
Click icon to add picture
Section header layout
Subtitle
Add a Slide Title - 1
Add a Slide Title - 2
Add a Slide Title - 3
Add a Slide Title - 4
Add a Slide Title - 5