Solution manual managerial accounting by cabrera 2010 chapter 04 answer
Bạn đang xem bản rút gọn của tài liệu. Xem và tải ngay bản đầy đủ của tài liệu tại đây (130.06 KB, 9 trang )
MANAGEMENT ACCOUNTING (VOLUME I) - Solutions Manual
CHAPTER 4
FINANCIAL STATEMENTS ANALYSIS - I
I.
Questions
1. The objective of financial statements analysis is to determine the extent
of a firm’s success in attaining its financial goals, namely:
a. To earn maximum profit
b. To maintain solvency
c. To attain stability
2. Some of the indications of satisfactory short-term solvency or working
capital position of a business firm are:
1. Favorable credit position
2. Satisfactory proportion of cash to the requirements of the
current volume
3. Ability to pay current debts in the regular course of business
4. Ability to extend more credit to customers
5. Ability to replenish inventory promptly
3. These tests are:
1. Improvement in the financial position
2. Well-balanced financial structure between borrowed funds and
equity
3. Effective employment of borrowed funds and equity
4. Ability to declare satisfactory amount of dividends to
shareholders
5. Ability to withstand adverse business conditions
6. Ability to engage in research and development in an attempt to
provide new products or improve old products, methods or
processes
4. Some indicators of managerial efficiency are:
4-1
Chapter 4 Financial Statements Analysis - I
1. Ability to earn a reasonable return on its investment of
borrowed funds and equity
2. Ability to control operating costs within reasonable limits
3. No overinvestment in fixed assets, receivables and inventories
5. The techniques used in Financial Statement Analysis are:
I.
Vertical analysis which shows the relationships of the items in
the same year: also referred to as “static measure.”
a. Financial ratios
b. Common-size statements
II. Horizontal analysis which shows the changes or tendencies of
an item for 2 or more years; also referred to as “dynamic
measure.”
a. Comparative statements - showing changes in absolute
amount and percentages
b. Trend percentages
III. Use of special reports or statements
a. Statements of Changes in Financial Position
b. Gross Profit / Net Income Variation Analysis
6. Refer to page 133 of the textbook.
7. Horizontal analysis involves the comparison of items on financial
statements between years.
Analysis of comparative financial
statements or the increase/decrease method of analysis and trend
percentages are the two techniques that may be applied under
horizontal analysis.
Vertical analysis involves the study of items on a single statement for a
single year, such as the analysis of an income statement for some given
year. Common-size statement and financial ratios are techniques used
in vertical analysis.
8. Trends can indicate whether a situation is improving, remaining the
same or deteriorating. They can also give insight to the probable future
course of events in a firm.
9. Trend percentages represent the expression of several years’ financial
data in percentage form in terms of a base year.
4-2
Financial Statements Analysis - I Chapter 4
10. Refer to page 133 of the textbook.
11. Observation of trends is useful primarily in determining whether a
situation is improving, worsening, or remaining constant.
By
comparing current data with similar data of prior periods we gain
insight into the direction in which future results are likely to move.
Some other standards of comparison include comparison with other
similar companies, comparison with industry standards, and
comparison with previous years’ information. By comparing analytical
data for one company with some independent yardstick, the analyst
hopes to determine how the position of the company in question
compares with some standard of performance.
12. Trend percentages are used to show the increase or decrease in a
financial statement amount over a period of years by comparing the
amount in each year with the base-year amount. A component
percentage is the percentage relationship between some financial
amount and a total of which it is a part.
Measuring the change in sales over a period of several years would call
for use of trend percentages. The sales in the base year are assigned a
weight of 100%. The percentage for each later year is computed by
dividing that year’s sales by the sales in the base year.
13. Expenses (including the cost of goods sold) have been increasing at an
even faster rate than net sales. Thus Premiere is apparently having
difficulty in effectively controlling its expenses.
14. A corporate net income of P1 million would be unreasonably low for a
large corporation, with, say, P100 million in sales, P50 million in
assets, and P40 million in equity. A return of only P1 million for a
company of this size would suggest that the owners could do much
better by investing in insured bank savings accounts or in government
bonds which would be virtually risk-free and would pay a higher
return.
On the other hand, a profit of P1 million would be unreasonably high
for a corporation which had sales of only P5 million, assets of, say, P3
million, and equity of perhaps one-half million pesos. In other words,
the net income of a corporation must be judged in relation to the scale
of operations and the amount invested.
4-3
Chapter 4 Financial Statements Analysis - I
II. True or False
1. True
2. False
3. True
4. True
5. False
6. False
7. True
8. False
9. True
10. True
III. Problems
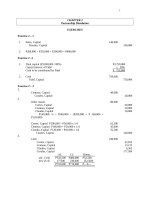
Problem 1 (Percentage Changes)
a. Accounts receivable decreased 16% (P24,000 decrease P150,000 =
16% decrease).
b. Marketable securities decreased 100% (P250,000 decrease P250,000
= 100% decrease).
c. A percentage change cannot be calculated because retained earnings
showed a negative amount (a deficit) in the base year and a positive
amount in the following year.
d. A percentage change cannot be calculated because of the zero amount
of notes receivable in 2005, the base year.
e. Notes payable increased 7 ½% (P60,000 increase P800,000 = 7 ½%
increase).
f. Cash increased 3% (P2,400 increase P80,000 = 3% increase).
g. Sales increased 10% (P90,000 increase P900,000 = 10% increase).
Problem 2 (Computing and Interpreting Rates of Change)
Requirement (a)
Computation of percentage changes:
1. Net sales increased 10% (P200,000 increase P2,000,000 = 10%
increase).
2. Total expenses increased 11% (P198,000 increase P1,800,000 = 11%
increase).
Requirement (b)
1. Total expenses grew faster than net sales. Net income cannot also have
grown faster than net sales, or the sum of the parts would exceed the
size of the whole.
2. Net income must represent a smaller percentage of net sales in 2006
than it did in 2005. Again, the reason is that the expenses have grown
at a faster rate than net sales. Thus, total expenses represent a larger
4-4
Financial Statements Analysis - I Chapter 4
percentage of total sales in 2006 than in 2005, and net income must
represent a smaller percentage.
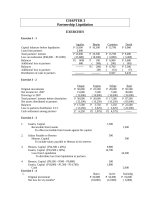
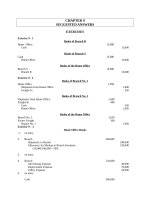
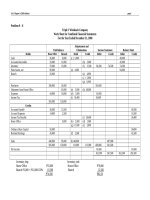
Problem 3 (Financial Statement Analysis
Statements or Increase-Decrease Method)
using
Comparative
Requirement 1
XYZ Corporation
Balance Sheet
As of December 31
Change
Peso
Assets
Cash and equivalents
Receivables
Inventories
Prepayments and others
Total current assets
Property, plant & equipment - net
of dep.
Total assets
Liabilities and Equity
Notes payable to banks
Accounts payable
Accrued liabilities
Income taxes payable
Total current liabilities
Share capital
Retained earnings
Total equity
Total liabilities and equity
XYZ Corporation
Income Statement
Years ended December 31
(P thousands)
%
2005
2006
14,000
28,800
54,000
4,800
101,600
16,000
55,600
85,600
7,400
164,600
2,000
26,800
31,600
2,600
63,000
14.29%
93.06%
58.52%
54.17%
62.01%
30,200
131,800
73,400
238,000
43,200
106,200
143.05%
80.58%
10,000
31,600
4,200
5,800
51,600
44,600
35,600
80,200
131,800
54,000
55,400
6,800
7,000
123,200
44,600
70,200
114,800
238,000
44,000
23,800
2,600
1,200
71,600
0
34,600
34,600
106,200
440.00%
73.32%
61.90%
20.69%
138.76%
0.00%
97.19%
43.14%
80.58%
Change
Peso
Net sales
Cost of goods sold
Gross profit
Selling, general and administrative
expenses
%
2005
266,400
191,400
75,000
2006
424,000
314,600
109,400
157,600
123,200
34,400
59.16%
64.37%
45.87%
35,500
58,400
22,900
64.51%
4-5
Chapter 4 Financial Statements Analysis - I
Income before income taxes
Income taxes
Net income
39,500
12,300
27,200
51,000
16,400
34,600
11,500
4,100
7,400
29.11%
33.33%
27.21%
while
Current
Liabilities
increased by
138.76%
while
Current
Liabilities
increased by 138.76%
while
Accounts
Receivable
increased by 93.06%
while
Inventorie
s
increased by 58.52%
while
Total
Liabilities
increased by 138.76%
while
Total
Equity
increased by 43.14%
while
Cost of
increased by 64.37%
Goods Sold
while
Selling,
General &
increased by 64.51%
Administrativ
e Expenses
while
Net
Income
increased by 27.21%
while
Total
Assets
increased by 80.58%
Requirement 2
Short-term financial position
1. Current
increased by 62.01%
Assets
Unfavorable
2. Quick
increased by 62.40%
Assets
Unfavorable
3. Net
increased by 59.16%
Sales
Unfavorable
4. Cost of
increased by 64.37%
Goods Sold
Favorable
Leverage
5. Total
increased by 80.58%
Assets
Unfavorable
6. Total
increased by 138.76%
Liabilities
Unfavorable
Profitability
7. Net
increased by 59.16%
Sales
Unfavorable
8. Net
Sales
increased by 59.16%
Unfavorable
9. Net
Sales
10. Net
Income
increased by 59.16%
Unfavorable
increased by 27.21%
Unfavorable
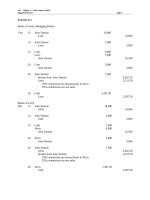
Problem 4 (Trend Percentages)
4-6
Financial Statements Analysis - I Chapter 4
Requirement (1)
The trend percentages are:
Year 5 Year 4 Year 3 Year 2 Year 1
125.0 120.0 110.0 105.0 100.0
Sales
Cash
Accounts receivable
Inventory
Total current assets
80.0
140.0
112.0
118.8
90.0
124.0
110.0
113.1
105.0
108.0
102.0
104.1
110.0
104.0
108.0
106.9
100.0
100.0
100.0
100.0
Current liabilities
130.0
106.0
108.0
110.0
100.0
Requirement (2)
Sales:
The sales are increasing at a steady rate, with a particularly
strong gain in Year 4.
Assets:
Cash declined from Year 3 through Year 5. This may have
been due to the growth in both inventories and accounts
receivable. In particular, the accounts receivable grew far
faster than sales in Year 5. The decline in cash may reflect
delays in collecting receivables. This is a matter for
management to investigate further.
Liabilities:
The current liabilities jumped up in Year 5. This was
probably due to the buildup in accounts receivable in that the
company doesn’t have the cash needed to pay bills as they
come due.
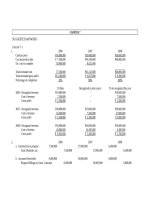
Problem 5 (Use of Trend Percentages)
a. 1. An unfavorable tendency could be observed in Receivables in
relation to Net Sales from 2003 – 2005 because receivables had
been increasing at a much faster rate than Net Sales. This could
indicate inefficiency in the collection of receivables or simply poor
company credit policy. The situation however, improved in 2006
and 2007 when sales started to move up at a faster rate than
accounts receivable. This would indicate improvement in the credit
and collection policy or more cash sales were being generated.
4-7
Chapter 4 Financial Statements Analysis - I
2. Unfavorable tendency in inventory persisted from 2003 to 2007
because it had been going up at a much faster rate than Net Sales.
If this continues, the company will end up with over-investment in
inventory because the buying rate is faster than the selling price.
3. Favorable tendencies could be noted in Fixed Assets in relation to
Net Sales because inspite of the minimal additions to fixed assets
made by the company from 2003 through 2007, sales had been
increasing at a very encouraging rate.
4. Net Income had likewise been increasing at a much faster rate than
net sales. This is favorable because this would indicate that the
company had been successfully controlling the increases in Cost of
Sales and Operating Expenses.
b. Review computations of the Trend Percentages. It will be noted that
the Trend Percentages in Total Noncurrent Liabilities and Equity from
2005 to 2007 were interchanged. Correction should be made first
before interpretation is done.
1. The upward tendency in current assets had been accompanied by an
upward trend in current liabilities. It could be noted that current
assets had been moving up at a much faster rate than current
liabilities. This is favorable because the margin of safety of the
short-term creditors is widened.
2. Favorable tendencies could also be observed in noncurrent assets
which had been increasing and which increases had been
accompanied by downward trend in noncurrent liabilities. This
would mean better security on the part of creditors and stronger
financial position.
3. There is an unfavorable tendency in Net Sales in relation to noncurrent assets. Sales had not been increasing at the same rate as
the increases in fixed assets. This could indicate that more
investments are made in noncurrent assets without considering
whether or not they could sell the additional units of product they
are producing.
c. The unfavorable trend in net income could be attributed to the
following tendencies:
1. Higher rates of increases in cost of sales as compared to sales.
2. Higher rates of increases in selling, general and administrative
expenses in relation to net sales.
3. Higher rates of increases in other financial expenses than the rates
of increases in net sales.
4-8
Financial Statements Analysis - I Chapter 4
IV. Multiple Choice Questions
1.
2.
3.
4.
5.
6.
7.
8.
9.
10.
D
A
A
B
D
C
C
A
D
C
11. A, C, D
12. B*
13. D
* (P400,000 – P160,000) P160,000 = 150%
4-9