Solution manual managerial accounting by cabrera 2010 chapter 05 answer
Bạn đang xem bản rút gọn của tài liệu. Xem và tải ngay bản đầy đủ của tài liệu tại đây (210.06 KB, 30 trang )
MANAGEMENT ACCOUNTING (VOLUME I) - Solutions Manual
CHAPTER 5
FINANCIAL STATEMENTS ANALYSIS - II
I.
Questions
1. By looking at trends, an analyst hopes to get some idea of whether a
situation is improving, remaining the same, or deteriorating. Such
analyses can provide insight into what is likely to happen in the future.
Rather than looking at trends, an analyst may compare one company to
another or to industry averages using common-size financial
statements.
2. Ratios highlight relationships, movements, and trends that are very
difficult to perceive looking at the raw underlying data standing alone.
Also, ratios make financial data easier to grasp by putting the data into
perspective. As to the limitation in the use of ratios, refer to page 129.
3. Price-earnings ratios are determined by how investors see a firm’s
future prospects. Current reported earnings are generally considered to
be useful only so far as they can assist investors in judging what will
happen in the future. For this reason, two firms might have the same
current earnings, but one might have a much higher price-earnings ratio
if investors view it to have superior future prospects. In some cases,
firms with very small current earnings enjoy very high price-earnings
ratios. This is simply because investors view these firms as having
very favorable prospects for earnings in future years. By definition, a
stock with current earnings of P4 and a price-earnings ratio of 20
would be selling for P80 per share.
4. A manager’s financing responsibilities relate to the acquisition of
assets for use in his or her company. The acquisition of assets can be
financed in a number of ways, including through issue of ordinary
shares, through issue of preference shares, through issue of long-term
debt, through leasing, etc. A manager’s operating responsibilities relate
to how these assets are used once they have been acquired. The return
on total assets ratio is designed to measure how well a manager is
discharging his or her operating responsibilities. It does this by looking
at a company’s income before any consideration is given as to how the
5-1
Chapter 5 Financial Statement Analysis –II
income will be distributed among capital resources, i.e., before interest
deductions.
5. Financial leverage, as the term is used in business practice, means
obtaining funds from investment sources that require a fixed annual
rate of return, in the hope of enhancing the well-being of the ordinary
shareholders. If the assets in which these funds are invested earn at a
rate greater that the return required by the suppliers of the funds, then
leverage is positive in the sense that the excess accrues to the benefit
of the ordinary shareholders. If the return on assets is less than the
return required by the suppliers of the funds, then leverage is negative
in the sense that part of the earnings from the assets provided by the
ordinary shareholders will have to go to make up the deficiency.
6. How a shareholder would feel would depend in large part on the
stability of the firm and its industry. If the firm is in an industry that
experiences wide fluctuations in earnings, then shareholders might be
very pleased that no interest-paying debt exists in the firm’s capital
structure. In hard times, interest payments might be very difficult to
meet, or earnings might be so poor that negative leverage would result.
7. No, the stock is not necessarily overpriced. Book value represents the
cumulative effects on the balance sheet of past activities evaluated
using historical prices. The market value of the stock reflects
investors’ beliefs about the company’s future earning prospects. For
most companies market value exceeds book value because investors
anticipate future growth in earnings.
8. A company in a rapidly growing technological industry probably would
have many opportunities to invest its earnings at a high rate of return;
thus, one would expect it to have a low dividend payout ratio.
9. It is more difficult to obtain positive financial leverage from preference
shares than from long-term debt due to the fact that interest on longterm debt is tax deductible, whereas dividends paid on preference
shares are not tax deductible.
10. The current ratio would probably be highest during January, when both
current assets and current liabilities are at a minimum. During peak
operating periods, current liabilities generally include short-term
borrowings that are used to temporarily finance inventories and
receivables. As the peak periods end, these short-term borrowings are
paid off, thereby enhancing the current ratio.
5-2
Financial Statement Analysis –II Chapter 5
11. A 2-to-1 current ratio might not be adequate for several reasons. First,
the composition of the current assets may be heavily weighted toward
slow-turning inventory, or the inventory may consist of large amounts
of obsolete goods. Second, the receivables may be large and of
doubtful collectibility, or the receivables may be turning very slowly
due to poor collection procedures.
12. Expenses (including the cost of goods sold) have been increasing at an
even faster rate than net sales. Thus Sunday is apparently having
difficulty in effectively controlling its expenses.
13. If the company’s earnings are very low, they may become almost
insignificant in relation to stock price. While this means that the p/e
ratio becomes very high, it does not necessarily mean that investors are
optimistic. In fact, they may be valuing the company at its liquidation
value rather than a value based upon expected future earnings.
14. From the viewpoint of the company’s shareholders, this situation
represents a favorable use of leverage. It is probable that little interest,
if any, is paid for the use of funds supplied by current creditors, and
only 11% interest is being paid to long-term bondholders. Together
these two sources supply 40% of the total assets. Since the firm earns
an average return of 16% on all assets, the amount by which the return
on 40% of the assets exceeds the fixed-interest requirements on
liabilities will accrue to the residual equity holders – the ordinary
shareholders – raising the return on equity.
15. The length of operating cycle of the two companies cannot be
determined from the fact the one company’s current ratio is higher. The
operating cycle depends on the relationships between receivables and
sales, and between inventories and cost of goods sold. The company
with the higher current ratio might have either small amounts of
receivables and inventories, or large sales and cost of sales, either of
which would tend to produce a relatively short operating cycle.
16. The investor is calculating the rate of return by dividing the dividend
by the purchase price of the investment (P5 ÷ P50 = 10%). A more
meaningful figure for rate of return on investment is determined by
relating dividends to current market price, since the investor at the
present time is faced with the alternative of selling the stock for P100
and investing the proceeds elsewhere or keeping the investment. A
5-3
Chapter 5 Financial Statement Analysis –II
decision to retain the stock constitutes, in effect, a decision to continue
to invest P100 in it, at a return of 5%. It is true that in a historical
sense the investor is earning 10% on the original investment, but this is
interesting history rather than useful decision-making information.
17. A corporate net income of P1 million would be unreasonably low for a
large corporation, with, say, P100 million in sales, P50 million in
assets, and P40 million in equity. A return of only P1 million for a
company of this size would suggest that the owners could do much
better by investing in insured bank savings accounts or in government
bonds which would be virtually risk-free and would pay a higher
return.
On the other hand, a profit of P1 million would be unreasonably high
for a corporation which had sales of only P5 million, assets of, say, P3
million, and equity of perhaps one-half million pesos. In other words,
the net income of a corporation must be judged in relation to the scale
of operations and the amount invested.
II. True or False
1. True
2. True
3. True
4. False
5. True
6. True
7. True
8. True
9. False
10. False
III. Problems
Problem 1 (Common Size Income Statements)
Common size income statements for 2005 and 2006:
2006
2005
Sales...................................................
100%
100%
Cost of goods sold.............................
66
67
Gross profit........................................
34%
33%
Operating expenses...........................
28
29
Net income.........................................
6%
4%
The changes from 2005 to 2006 are all favorable. Sales increased and the
gross profit per peso of sales also increased. These two factors led to a
substantial increase in gross profit. Although operating expenses increased
in peso amount, the operating expenses per peso of sales decreased from 29
cents to 28 cents. The combination of these three favorable factors caused
net income to rise from 4 cents to 6 cents out of each peso of sales.
Problem 2 (Measures of Liquidity)
5-4
Financial Statement Analysis –II Chapter 5
Requirement (a)
Current assets:
Cash
Marketable securities
Accounts receivable
Inventory
Unexpired insurance
Total current assets
Current liabilities:
Notes payable
Accounts payable
Salaries payable
Income taxes payable
Unearned revenue
Total current liabilities
P 47,600
175,040
230,540
179,600
4,500
P637,280
P 70,000
125,430
7,570
14,600
10,000
P227,600
Requirement (b)
The current ratio is 2.8 to 1. It is computed by dividing the current assets
of P637,280 by the current liabilities of P227,600. The amount of working
capital is P409,680, computed by subtracting the current liabilities of
P227,600 from the current assets of P637,280.
The company appears to be in a strong position as to short-run debt-paying
ability. It has almost three pesos of current assets for each peso of current
liabilities. Even if some losses should be sustained in the sale of the
merchandise on hand or in the collection of the accounts receivable, it
appears probable that the company would still be able to pay its debts as
they fall due in the near future. Of course, additional information, such as
the credit terms on the accounts receivable, would be helpful in a careful
evaluation of the company’s current position.
Problem 3 (Common-Size Income Statement)
Requirement 1
2006
2005
Sales............................................................................................................................
100.0 %
100.0 %
Less cost of goods sold..............................................................................................
63.2
60.0
Gross margin..............................................................................................................
36.8
40.0
Selling expenses.........................................................................................................
18.0
17.5
Administrative expenses...........................................................................................
13.6
14.6
5-5
Chapter 5 Financial Statement Analysis –II
Total expenses............................................................................................................
31.6
32.1
Net operating income.................................................................................................
5.2
7.9
Interest expense.........................................................................................................
1.4
1.0
Net income before taxes............................................................................................
3.8 %
6.9 %
Requirement 2
The company’s major problem seems to be the increase in cost of goods
sold, which increased from 60.0% of sales in 2005 to 63.2% of sales in
2006. This suggests that the company is not passing the increases in costs
of its products on to its customers. As a result, cost of goods sold as a
percentage of sales has increased and gross margin has decreased. Selling
expenses and interest expense have both increased slightly during the year,
which suggests that costs generally are going up in the company. The only
exception is the administrative expenses, which have decreased from
14.6% of sales in 2005 to 13.6% of sales in 2006. This probably is a result
of the company’s efforts to reduce administrative expenses during the year.
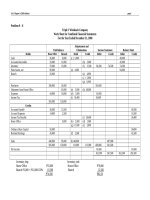
Problem 4 (Comparing Operating Results with Average Performance in
the Industry)
Requirement (a)
Sales (net)
Cost of goods sold
Gross profit on sales
Operating expenses:
Selling
General and administrative
Total operating expenses
Operating income
Income taxes
Net income.........................................
Ms. Freeze,
Inc.
100%
49
51%
21%
17
38%
13%
6
7%
Industry
Average
100%
57
43%
16%
20
36%
7%
3
4%
Requirement (b)
Ms. Freeze’s operating results are significantly better than the average
performance within the industry. As a percentage of sales revenue, Ms.
Freeze’s operating income and net income after nearly twice the average
for the industry. As a percentage of total assets, Ms. Freeze’s profits
amount to an impressive 23% as compared to 14% for the industry.
5-6
Financial Statement Analysis –II Chapter 5
The key to Ms. Freeze’s success seems to be its ability to earn a relatively
high rate of gross profit. Ms. Freeze’s exceptional gross profit rate (51%)
probably results from a combination of factors, such as an ability to
command a premium price for the company’s products and production
efficiencies which lead to lower manufacturing costs.
As a percentage of sales, Ms. Freeze’s selling expenses are five points
higher than the industry average (21% compared to 16%). However, these
higher expenses may explain Ms. Freeze’s ability to command a premium
price for its products. Since the company’s gross profit rate exceeds the
industry average by 8 percentage points, the higher-than-average selling
costs may be part of a successful marketing strategy. The company’s
general and administrative expenses are significantly lower than the
industry average, which indicates that Ms. Freeze’s management is able to
control expenses effectively.
Problem 5 (Common-Size Statements)
Requirement 1
The income statement in common-size form would be:
Sales...........................................................
Less cost of goods sold............................
Gross margin.............................................
Less operating expenses...........................
Net operating income................................
Less interest expense................................
Net income before taxes...........................
Less income taxes (30%).........................
Net income................................................
2006
100.0%
65.0
35.0
26.3
8.7
1.2
7.5
2.3
5.3%
2005
100.0%
60.0
40.0
30.4
9.6
1.6
8.0
2.4
5.6%
The balance sheet in common-size form would be:
Current assets:
Cash
.............................................................
Accounts receivable, net
.............................................................
Inventory
.............................................................
Prepaid expenses
5-7
2006
2.0%
2005
5.1%
15.0
10.1
30.1
15.2
1.0
1.3
Chapter 5 Financial Statement Analysis –II
.............................................................
Total current assets
48.1
31.6
51.9
100.0%
68.4
100.0%
25.1%
20.1
45.1
12.7%
25.3
38.0
15.0
19.0
Ordinary shares, P5 par
10.0
12.7
Retained earnings
29.8
30.4
54.9
62.0
100.0%
100.0%
Plant and equipment.................................
Total assets................................................
Liabilities:
Current liabilities...............................
Bonds payable, 12%...........................
Total liabilities.............................
Equity:
Preference shares, 8%, P10 par
Total equity
Total liabilities and equity........................
Note: Columns do not total down in all cases due to rounding differences.
Requirement 2
The company’s cost of goods sold has increased from 60 percent of sales in
2005 to 65 percent of sales in 2006. This appears to be the major reason
the company’s profits showed so little increase between the two years.
Some benefits were realized from the company’s cost-cutting efforts, as
evidenced by the fact that operating expenses were only 26.3 percent of
sales in 2006 as compared to 30.4 percent in 2005. Unfortunately, this
reduction in operating expenses was not enough to offset the increase in
cost of goods sold. As a result, the company’s net income declined from
5.6 percent of sales in 2005 to 5.3 percent of sales in 2006.
Problem 6 (Solvency of Alabang Supermarket)
Requirement (a)
(Pesos in
Millions)
Current assets:
Cash
Receivables
P
5-8
74.8
152.7
Financial Statement Analysis –II Chapter 5
Merchandise inventories
Prepaid expenses
Total current assets
1,191.8
95.5
P1,514.8
Quick assets:
Cash
Receivables
Total quick assets
P
74.8
152.7
P 227.5
Requirement (b)
(1) Current ratio:
Current assets (Req. a)
Current liabilities
Current ratio (P1,514.8 ÷ P1,939.0)
P1,514.8
P1,939.0
0.8 to 1
(2) Quick ratio:
Quick assets (Req. a)
Current liabilities
Quick ratio (P227.5 ÷ P1,939.0)
P 227.5
P1,939.0
0.1 to 1
(3) Working capital:
Current assets (Req. a)
Less: Current liabilities
Working capital
P1,514.8
P1,939.0
P(424.2)
Requirement (c)
No. It is difficult to draw conclusions from the above ratios. Alabang
Supermarket’s current ratio and quick ratio are well below “safe” levels,
according to traditional rules of thumb. On the other hand, some large
companies with steady ash flows are able to operate successfully with
current ratios lower than Alabang Supermarket’s.
Requirement (d)
Due to characteristics of the industry, supermarkets tend to have smaller
amounts of current assets and quick assets than other types of
merchandising companies. An inventory of food has a short shelf life.
5-9
Chapter 5 Financial Statement Analysis –II
Therefore, the inventory of a supermarket usually represents only a few
weeks’ sales. Other merchandising companies may stock inventories
representing several months’ sales. Also, supermarkets sell primarily for
cash. Thus, they have relatively few receivables. Although supermarkets
may generate large amounts of cash, it is not profitable for them to hold
assets in this form. Therefore, they are likely to reinvest their cash flows
in business operations as quickly as possible.
Requirement (e)
In evaluating Alabang Supermarket’s liquidity, it would be useful to review
the company’s financial position in prior years, statements of cash flows,
and the financial ratios of other supermarket chains. One might also
ascertain the company’s credit rating from an agency such as Dun &
Bradstreet.
Note to Instructor: Prior to the year in which the data for this problem was
collected, Alabang Supermarket had reported a negative retained earnings
balance in its balance sheet for several consecutive periods. The fact that
Alabang Supermarket has only recently removed the deficit from its
financial statements is also worrisome.
Problem 7 (Balance Sheet Measures of Liquidity and Credit Risk)
Requirement (a)
(1) Quick assets:
Cash
Marketable securities (short-term)
Accounts receivable
Total quick assets
P 47,524
55,926
23,553
P127,003
(2) Current assets:
Cash
Marketable securities (short-term)
Accounts receivable
Inventories
P 47,524
55,926
23,553
32,210
5-10
Financial Statement Analysis –II Chapter 5
Prepaid expenses
Total current assets
5,736
P164,949
(3) Current liabilities:
Notes payable to banks (due within one year)
Accounts payable
Dividends payable
Accrued liabilities (short-term)
Income taxes payable
Total current liabilities
P 20,000
5,912
1,424
21,532
6,438
P 55,306
Requirement (b)
(1) Quick ratio:
Quick assets (Req. a)
Current liabilities (Req. a)
Quick ratio (P127,003 ÷ P55,306)
P127,003
P 55,306
2.3 to 1
(2) Current ratio:
Current assets (Req. a)
Current liabilities (Req. a)
Current ratio (P164,949 ÷ P55,306)
P164,949
P 55,306
3.0 to 1
(3) Working capital:
Current assets (Req. a)
Less: Current liabilities (Req. a)
Working capital
P164,949
55,306
P109,643
(4) Debt ratio:
Total liabilities (given)
Total assets (given)
Debt ratio (P81,630 ÷ P353,816)
P 81,630
P353,816
23.1%
Requirement (c)
(1) From the viewpoint of short-term creditors, Bonbon Sweets’ appear
highly liquid. Its quick and current ratios are well above normal rules
of thumb, and the company’s cash and marketable securities alone are
almost twice its current liabilities.
5-11
Chapter 5 Financial Statement Analysis –II
(2) Long-term creditors also have little to worry about. Not only is the
company highly liquid, but creditors’ claims amount to only 23.1% of
total assets. If Bonbon Sweets’ were to go out of business and
liquidate its assets, it would have to raise only 23 cents from every
peso of assets for creditors to emerge intact.
(3) From the viewpoint of shareholders, Bonbon Sweets’ appears overly
liquid. Current assets generally do not generate high rates of return.
Thus, the company’s relatively large holdings of current assets dilutes
its return on total assets. This should be of concern to shareholders. If
Bonbon Sweets is unable to invest its highly liquid assets more
productively in its business, shareholders probably would like to see
the money distributed as dividends.
Problem 8 (Selected Financial Measures for Short-term Creditors)
Requirement 1
Current assets (P80,000 + P460,000 + P750,000 +
P10,000)..................................................................................................................
P1,300,000
Current liabilities (P1,300,000 ÷ 2.5)........................................................................
520,000
P 780,000
Working capital..........................................................................................................
Requirement 2
Acid-test ratio =
Cash + Marketable securities + Accounts receivable
Current liabilities
Acid-test ratio =
P80,000 + P0 + P460,000
P520,000
= 1.04 to 1 (rounded)
Requirement 3
a. Working capital would not be affected:
Current assets (P1,300,000 – P100,000)...................................................................
P1,200,000
Current liabilities (P520,000 – P100,000)................................................................
420,000
Working capital..........................................................................................................
P 780,000
b. The current ratio would rise:
Current ratio
=
Current assets
Current liabilities
Current rate
=
P1,200,000
P420,000
5-12
= 2.9 to 1 (rounded)
Financial Statement Analysis –II Chapter 5
Problem 9 (Selected Financial Ratios)
1. Gross margin percentage:
Gross margin
Sales
P840,000
P2,100,000
=
2. Current ratio:
Current assets
Current liabilities
= 40%
P490,000
P200,000
=
= 2.45 to 1
3. Acid-test ratio:
Quick assets
Current liabilities
P181,000
P200,000
=
= 0.91 to 1 (rounded)
4. Accounts receivable turnover:
Sales
Average accounts receivables
365 days
14 times
=
P2,100,000
P150,000
= 14 times
= 26.1 days (rounded)
5. Inventory turnover:
Cost of goods sold
Average inventory
365 days
4.5 times
=
P1,260,000
P280,000
= 4.5 times
= 81.1 days to turn (rounded)
6. Debt-to-equity ratio:
Total liabilities
Total equity
=
P500,000
P800,000
= 0.63 to 1 (rounded)
7. Times interest earned:
Earnings before interest
and income taxes
Interest expense 5-13 =
P180,000
P30,000
= 6.0 times
Chapter 5 Financial Statement Analysis –II
8. Book value per share:
Equity
Ordinary shares outstanding
=
P800,000
20,000 shares*
= P40 per share
* P100,000 total par value ÷ P5 par value per share = 20,000 shares
Problem 10 (Selected Financial Ratios for Ordinary Shareholders)
1. Earnings per share:
Net income to ordinary
shares
Average ordinary shares
outstanding
2. Dividend payout ratio:
Dividends paid per share
Earnings per share
3. Dividend yield ratio:
Dividends paid per share
Market price per share
4. Price-earnings ratio:
Market price per share
Earnings per share
=
P105,000
20,000 shares
= P5.25 per share
=
P3.15
P5.25
= 60%
=
P3.15
P63.00
= 5%
=
P63.00
P5.25
= 12.0
Problem 11 (Selected Financial Ratios for Ordinary Shareholders)
1. Return on total assets:
Return on total =
assets
=
=
Net income + [Interest expense x (1 – Tax rate)]
Average total assets
P105,000 + [P30,000 x (1 – 0.30)]
½ (P1,100,000 + P1,300,000)
P126,000
= 10.5%
P1,200,000
5-14
Financial Statement Analysis –II Chapter 5
2. Return on ordinary shareholders’ equity:
Return on ordinary
shareholders’ equity
=
=
=
Net income – preference dividends
Average ordinary shareholders’ equity
P105,000
½ (P725,000 + P800,000)
P105,000
P762,500
= 13.8% (rounded)
3. Financial leverage was positive, since the rate of return to the ordinary
shareholders (13.8%) was greater than the rate of return on total assets
(10.5%). This positive leverage is traceable in part to the company’s
current liabilities, which may carry no interest cost, and to the bonds
payable, which have an after-tax interest cost of only 7%.
10% interest rate × (1 – 0.30) = 7% after-tax cost.
IV. Cases
Case 1 (Common-Size Statements and Financial Ratios for Creditors)
Requirement 1
This Year
P2,060,000
1,100,000
P 960,000
Last Year
P1,470,000
600,000
P 870,000
b. Current assets (a)
Current liabilities (b)
Current ratio (a) ÷ (b)
P2,060,000
P1,100,000
1.87 to 1
P1,470,000
P600,000
2.45 to 1
c. Quick assets (a)
Current liabilities (b)
Acid-test ratio (a) ÷ (b)
P740,000
P1,100,000
0.67 to 1
P650,000
P600,000
1.08 to 1
d. Sales on account (a)
P7,000,000
P6,000,000
a. Current assets
Current liabilities
Working capital
5-15
Chapter 5 Financial Statement Analysis –II
Average receivables (b)
Turnover of receivables (a) ÷ (b)
P525,000
13.3 times
P375,000
16.0 times
Average age of receivables:
365 ÷ turnover
27.4 days
22.8 days
e. Cost of goods sold (a)
Average inventory (b)
Inventory turnover (a) ÷ (b)
P5,400,000
P1,050,000
5.1 times
P4,800,000
P760,000
6.3 times
71.6 days
P1,850,000
P2,150,000
0.86 to 1
57.9 days
P1,350,000
P1,950,000
0.69 to 1
P630,000
P90,000
7.0 times
P490,000
P90,000
5.4 times
f.
Turnover in days: 365 ÷ turnover
Total liabilities (a)
Equity (b)
Debt-to-equity ratio (a) ÷ (b)
g. Net income before interest and taxes (a)
Interest expense (b)
Times interest earned (a) ÷ (b)
Requirement 2
a.
METRO BUILDING SUPPLY
Common-Size Balance Sheets
Current assets:
Cash
Marketable securities
Accounts receivable, net
Inventory
Prepaid expenses
Total current assets
Plant and equipment, net
Total assets
Liabilities:
Current liabilities
Bonds payable, 12%
Total liabilities
Equity:
Preference shares, P50 par, 8%
Ordinary shares, P10 par
5-16
This Year
Last Year
2.3 %
0.0
16.3
32.5
0.5
51.5
48.5
100.0 %
6.1 %
1.5
12.1
24.2
0.6
44.5
55.5
100.0 %
27.5 %
18.8
46.3
18.2 %
22.7
40.9
5.0
12.5
6.1
15.2
Financial Statement Analysis –II Chapter 5
Retained earnings
Total equity
Total liabilities and equity
36.3
53.8
100.0 %
37.9
59.1
100.0 %
Note: Columns do not total down in all cases due to rounding.
b.
METRO BUILDING SUPPLY
Common-Size Income Statements
This Year
100.0 %
77.1
22.9
13.9
9.0
1.3
7.7
3.1
4.6 %
Sales
Less cost of goods sold
Gross margin
Less operating expenses
Net operating income
Less interest expense
Net income before taxes
Less income taxes
Net income
Last Year
100.0 %
80.0
20.0
11.8
8.2
1.5
6.7
2.7
4.0 %
Requirement 3
The following points can be made from the analytical work in parts (1) and
(2) above:
The company has improved its profit margin from last year. This is
attributable to an increase in gross margin, which is offset somewhat by an
increase in operating expenses. In both years the company’s net income as
a percentage of sales equals or exceeds the industry average of 4%.
Although the company’s working capital has increased, its current position
actually has deteriorated significantly since last year. Both the current
ratio and the acid-test ratio are well below the industry average, and both
are trending downward. (This shows the importance of not just looking at
the working capital in assessing the financial strength of a company.)
Given the present trend, it soon will be impossible for the company to pay
its bills as they come due.
The drain on the cash account seems to be a result mostly of a large buildup
in accounts receivable and inventory. This is evident both from the
common-size balance sheet and from the financial ratios. Notice that the
average age of the receivables has increased by 5 days since last year, and
5-17
Chapter 5 Financial Statement Analysis –II
that it is now 9 days over the industry average. Many of the company’s
customers are not taking their discounts, since the average collection
period is 27 days and collection terms are 2/10, n/30. This suggests
financial weakness on the part of these customers, or sales to customers
who are poor credit risks. Perhaps the company has been too aggressive in
expanding its sales.
The inventory turned only 5 times this year as compared to over 6 times
last year. It takes three weeks longer for the company to turn its inventory
than the average for the industry (71 days as compared to 50 days for the
industry). This suggests that inventory stocks are higher than they need to
be.
In the authors’ opinion, the loan should be approved on the condition that
the company take immediate steps to get its accounts receivable and
inventory back under control. This would mean more rigorous checks of
creditworthiness before sales are made and perhaps paring out of slow
paying customers. It would also mean a sharp reduction of inventory levels
to a more manageable size. If these steps are taken, it appears that
sufficient funds could be generated to repay the loan in a reasonable period
of time.
Case 2 (Financial Ratios for Ordinary Shareholders)
Requirement 1
a.
Net income
Less preference dividends
Net income remaining for ordinary (a)
This Year
P324,000
16,000
Last Year
P240,000
16,000
P308,000
P224,000
50,000
P6.16
50,000
P4.48
P2.16
P45.00
4.8%
P1.20
P36.00
3.33%
Average number of ordinary shares (b)
Earnings per share (a) ÷ (b)
b. Ordinary dividend per share (a)*
Market price per share (b)
Dividend yield ratio (a) ÷ (b)
*P108,000 ÷ 50,000 shares = P2.16;
P60,000 ÷ 50,000 shares = P1.20
5-18
Financial Statement Analysis –II Chapter 5
c. Ordinary dividend per share (a)................................................................................
P2.16
P1.20
Earnings per share (b)................................................................................................
P6.16
P4.48
Dividend payout ratio (a) ÷ (b)..................................................................................
35.1%
26.8%
d. Market price per share (a).........................................................................................
P45.00
P36.00
Earnings per share (b)................................................................................................
P6.16
P4.48
Price-earnings ratio (a) ÷ (b).....................................................................................
7.3
8.0
Investors regard Metro Building Supply less favorably than other firms
in the industry. This is evidenced by the fact that they are willing to
pay only 7.3 times current earnings for a share of the company’s stock,
as compared to 9 times current earnings for the average of all stocks in
the industry. If investors were willing to pay 9 times current earnings
for Metro Building Supply’s stock, then it would be selling for about
P55 per share (9 × P6.16), rather than for only P45 per share.
e.
This Year
Last Year
Equity..........................................................................................................................
P2,150,000
P1,950,000
Less preference shares...............................................................................................
200,000
200,000
Ordinary equity (a).....................................................................................................
P1,950,000
P1,750,000
Number of ordinary shares (b)..................................................................................
50,000
50,000
Book value per share (a) ÷ (b)...................................................................................
P39.00
P35.00
A market price in excess of book value does not mean that the price of
a stock is too high. Market value is an indication of investors’
perceptions of future earnings and/or dividends, whereas book value is
a result of already completed transactions and is geared to the past.
Requirement 2
a.
This Year
Last Year
P
324,000
P 240,000
Net income..................................................................................................................
Add after-tax cost of interest paid:
[P90,000 × (1 – 0.40)]............................................................................................
54,000
54,000
P 294,000
Total (a).......................................................................................................................
P 378,000
Average total assets (b).............................................................................................
P3,650,000
P3,000,000
Return on total assets (a) ÷ (b)..................................................................................
10.4%
9.8%
5-19
Chapter 5 Financial Statement Analysis –II
b.
This Year
Last Year
P 324,000
P 240,000
Net income..................................................................................................................
Less preference dividends.........................................................................................
16,000
16,000
Net income remaining for ordinary
P 308,000
P 224,000
shareholders (a)......................................................................................................
Average total equity*.................................................................................................
P2,050,000
P1,868,000
Less average preference shares.................................................................................
200,000
200,000
Average ordinary equity (b)......................................................................................
P1,850,000
P1,668,000
*1/2(P2,150,000 + P1,950,000); 1/2(P1,950,000 + P1,786,000).
Return on ordinary equity (a) ÷ (b)
16.6%
13.4%
c. Financial leverage is positive in both years, since the return on ordinary
equity is greater than the return on total assets. This positive financial
leverage is due to three factors: the preference shares, which has a
dividend of only 8%; the bonds, which have an after-tax interest cost of
only 7.2% [12% interest rate × (1 – 0.40) = 7.2%]; and the accounts
payable, which may bear no interest cost.
Requirement 3
We would recommend keeping the stock. The stock’s downside risk seems
small, since it is selling for only 7.3 times current earnings as compared to
9 times earnings for the average firm in the industry. In addition, its
earnings are strong and trending upward, and its return on ordinary equity
(16.6%) is extremely good. Its return on total assets (10.4%) compares
favorably with that of the industry.
The risk, of course, is whether the company can get its cash problem under
control. Conceivably, the cash problem could worsen, leading to an
eventual reduction in profits through inability to operate, a reduction in
dividends, and a precipitous drop in the market price of the company’s
stock. This does not seem likely, however, since the company can easily
control its cash problem through more careful management of accounts
receivable and inventory. If this problem is brought under control, the price
of the stock could rise sharply over the next few years, making it an
excellent investment.
5-20
Financial Statement Analysis –II Chapter 5
Case 3 (Comprehensive Ratio Analysis)
Requirement 1
This Year
Last Year
P 280,000
P 168,000
a. Net income..................................................................................................................
Add after-tax cost of interest:
P120,000 × (1 – 0.30).............................................................................................
84,000
P100,000 × (1 – 0.30).............................................................................................
70,000
P 364,000
P 238,000
Total (a).......................................................................................................................
Average total assets (b).............................................................................................
P5,330,000
P4,640,000
Return on total assets (a) ÷ (b)..................................................................................
6.8%
5.1%
P 280,000
P 168,000
b. Net income..................................................................................................................
Less preference dividends.........................................................................................
48,000
48,000
P 232,000
P 120,000
Net income remaining for ordinary (a).....................................................................
Average total equity...................................................................................................
P3,120,000
P3,028,000
Less average preference shares.................................................................................
600,000
600,000
Average ordinary equity (b)......................................................................................
P2,520,000
P2,428,000
Return on ordinary equity (a) ÷ (b)...........................................................................
9.2%
4.9%
c. Leverage is positive for this year, since the return on ordinary equity
(9.2%) is greater than the return on total assets (6.8%). For last year,
leverage is negative since the return on the ordinary equity (4.9%) is
less than the return on total assets (5.1%).
Requirement 2
P 232,000
50,000
P4.64
P 120,000
50,000
P2.40
b. Ordinary dividend per share (a)
Market price per share (b)
Dividend yield ratio (a) ÷ (b)
P1.44
P36.00
4.0%
P0.72
P20.00
3.6%
c. Ordinary dividend per share (a)
Earnings per share (b)
Dividend payout ratio (a) ÷ (b)
This Year
P1.44
P4.64
31.0%
Last Year
P0.72
P2.40
30.0%
a. Net income remaining for ordinary (a)
Average number of ordinary shares (b)
Earnings per share (a) ÷ (b)
5-21
Chapter 5 Financial Statement Analysis –II
d. Market price per share (a)
Earnings per share (b)
Price-earnings ratio (a) ÷ (b)
P36.00
P4.64
7.8
P20.00
P2.40
8.3
Notice from the data given in the problem that the average P/E ratio for
companies in Helix’s industry is 10. Since Helix Company presently
has a P/E ratio of only 7.8, investors appear to regard it less well than
they do other companies in the industry. That is, investors are willing
to pay only 7.8 times current earnings for a share of Helix Company’s
stock, as compared to 10 times current earnings for a share of stock for
the average company in the industry.
e. Equity
Less preference shares
Ordinary equity (a)
Number of ordinary shares (b)
Book value per share (a) ÷ (b)
P3,200,000
600,000
P2,600,000
P3,040,000
600,000
P2,440,000
50,000
P52.00
50,000
P48.80
Note that the book value of Helix Company’s stock is greater than the
market value for both years. This does not necessarily indicate that the
stock is selling at a bargain price. Market value is an indication of
investors’ perceptions of future earnings and/or dividends, whereas
book value is a result of already completed transactions and is geared
to the past.
f.
Gross margin (a)
Sales (b)
Gross margin percentage (a) ÷ (b)
P1,050,000
P5,250,000
20.0%
P860,000
P4,160,000
20.7%
This Year
P2,600,000
1,300,000
P1,300,000
Last Year
P1,980,000
920,000
P1,060,000
P2,600,000
P1,300,000
P1,980,000
P920,000
Requirement 3
a. Current assets
Current liabilities
Working capital
b. Current assets (a)
Current liabilities (b)
5-22
Financial Statement Analysis –II Chapter 5
Current ratio (a) ÷ (b)
2.0 to 1
2.15 to 1
c. Quick assets (a)
Current liabilities (b)
Acid-test ratio (a) ÷ (b)
P1,220,000
P1,300,000
0.94 to 1
P1,120,000
P920,000
1.22 to 1
d. Sales on account (a)
Average receivables (b)
Accounts receivable turnover (a) ÷ (b)
Average age of receivables,
365 ÷ turnover
P5,250,000
P750,000
7.0 times
P4,160,000
P560,000
7.4 times
52 days
49 days
e. Cost of goods sold (a)
Average inventory (b)
Inventory turnover (a) ÷ (b)
Number of days to turn inventory,
365 days ÷ turnover (rounded)
P4,200,000
P1,050,000
4.0 times
P3,300,000
P720,000
4.6 times
91 days
79 days
f.
P2,500,000
P3,200,000
0.78 to 1
P1,920,000
P3,040,000
0.63 to 1
P520,000
P120,000
4.3 times
P340,000
P100,000
3.4 times
Total liabilities (a)
Equity (b)
Debt-to-equity ratio (a) ÷ (b)
g. Net income before interest and taxes (a)
Interest expense (b)
Times interest earned (a) ÷ (b)
Requirement 4
As stated by Meri Ramos, both net income and sales are up from last year.
The return on total assets has improved from 5.1% last year to 6.8% this
year, and the return on ordinary equity is up to 9.2% from 4.9% the year
before. But this appears to be the only bright spot in the company’s
operating picture. Virtually all other ratios are below the industry average,
and, more important, they are trending downward. The deterioration in the
gross margin percentage, while not large, is worrisome. Sales and
inventories have increased substantially, which should ordinarily result in
an improvement in the gross margin percentage as fixed costs are spread
over more units. However, the gross margin percentage has declined.
Notice particularly that the average age of receivables has lengthened to 52
days—about three weeks over the industry average—and that the inventory
turnover is 50% longer than the industry average. One wonders if the
increase in sales was obtained at least in part by extending credit to high5-23
Chapter 5 Financial Statement Analysis –II
risk customers. Also notice that the debt-to-equity ratio is rising rapidly.
If the P1,000,000 loan is granted, the ratio will rise further to 1.09 to 1.
In the author’s opinion, what the company needs is more equity—not more
debt. Therefore, the loan should not be approved. The company should be
encouraged to make another issue of ordinary stock in order to provide a
broader equity base on which to operate.
Case 4 (Statement Reconstruction Using Ratios)
Bulacan Company
Income Statement
For the Year Ended December 31, 2005
Sales
Less: Cost of Sales (4)
Gross Profit
Less: Expenses
Net Income (1)
P140,800
84,480
P 56,320
46,320
P 10,000
Bulacan Company
Balance Sheet
December 31, 2005
Assets
Current Assets:
Cash
Accounts Receivable (5)
Merchandise Inventory (3)
Total Current Assets (2)
Fixed Assets (8)
Total Assets
P 27,720
28,160
21,120
P 77,000
55,000
P132,000
Liabilities and Equity
5-24
Financial Statement Analysis –II Chapter 5
Current Liabilities:
Accounts Payable (2)
Equity:
Share Capital (issued 20,000
shares) (6)
Retained Earnings
Total Liabilities and Equity
P 44,000
P40,000
48,000
88,000
P132,000
Supporting Computations:
(1) Earnings Per Share
Net Income
Ordinary Shares
X Outstanding
=
P0.50
=
X (Net Income)
=
20,000
P10,000
(2) Current Assets
Pxx
Current Liabilities xx
Working Capital P33,000
1.75
1
0.75
Current Liabilities
(3) Current Ratio
=
P33,000 ÷ 0.75
=
=
P44,000
Current Assets
Current Liabilities
X
44,000
1.27
=
X (Current Assets)
=
Quick Ratio
=
1.27
=
P77,000
55,800
P21,120
5-25
Quick Assets
Current Liabilities
X
44,000
=
X (Current Assets)
Current Assets
Quick Assets
Inventory
P77,000
P55,880