Solution manual managerial accounting by cabrera 2010 chapter 07 answer
Bạn đang xem bản rút gọn của tài liệu. Xem và tải ngay bản đầy đủ của tài liệu tại đây (79.17 KB, 7 trang )
MANAGEMENT ACCOUNTING (VOLUME I) - Solutions Manual
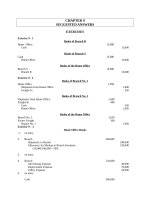
CHAPTER 7
GROSS PROFIT VARIATION ANALYSIS AND
EARNINGS PER SHARE DETERMINATION
I.
Problems
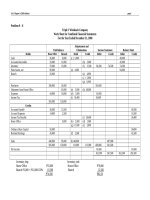
Problem I
The Dawn Mining Company
Gross Profit Variation Analysis
For 2006
Increase in Sales:
Quantity Factor [(24,000) x P8]
P(192,000)
Price Factor (105,000 x P3)
315,000
Quantity/Price Factor [(24,000) x P3]
(72,000)
Less: Increase (decrease) in Cost of Sales:
Quantity Factor [(24,000) x P9]
P(216,000)
Cost Factor [105,000 x (P.50)]
(52,500)
Quantity/Cost Factor [(24,000) x (P.50)]
12,000
Increase in Gross Profit
P 51,000
(256,500)
P 307,500
Problem II
1. Selling Price Factor
Sales in 2006
Less: Sales in 2006 at 2005 prices
(P210,000 ÷ 105%)
Favorable
2. Cost Factor
Cost of Sales in 2006
Less: Cost of Sales in 2006 at 2005 costs
Favorable
P(12,000)
3. Quantity Factor
Increase in Sales
7-1
P210,000
200,000
P 10,000
P164,000
176,000
Chapter 7 Gross Profit Variation Analysis and Earnings Per Share Determination
Sales in 2006 at 2005 prices
P200,000
Less: Sales in 2005
Favorable
P 50,000
Less: Increase in Cost of Sales
Cost of Sales in 2006 at 2005 costs
(P132,000 x 133-1/3%)
P176,000
Less: Cost of Sales in 2005
Unfavorable
P 44,000
Net favorable quantity factor
Increase in Gross Profit
150,000
132,000
6,000*
P 28,000
* This may also be obtained using the following presentation:
Quantity Factor:
Sales in 2006 at 2005 prices
Less: Sales in 2005
Increase in Sales
Multiplied by: Ave. Gross Profit rate in 2005
Net favorable variance
P200,000
150,000
P 50,000
12%
P
6,000
Problem III
Requirement A:
Tony Corporation
Statement Accounting for Gross Profit Variation
For 2006
Increase (Decrease) in Sales accounted for as follows:
Price Factor
Sales this year
Less: Sales this year at last year’s prices
269,500
Favorable (Unfavorable)
Quantity Factor
Sales this year at last year’s
prices (P210,210 ÷ 78%)
Less: Sales last year
Favorable (Unfavorable)
Net Increase (decrease) in sales
P210,210
P(59,290)
P269,500
192,500
P 77,000
P 17,710
Increase (decrease) in Cost of Sales accounted for as follows:
7-2
Gross Profit Variation Analysis and Earnings Per Share Determination Chapter 7
Cost Factor
Cost of Sales this year
Less: Cost of Sales this year at last
year’s costs
(Favorable) Unfavorable
P 165,400
161,700
P 3,700
Quantity Factor
Cost of Sales this year at last year’s
costs (115,500 x 140%)
Less: Cost of Sales last year
(Favorable) Unfavorable
P 161,700
115,500
P 46,200
Net increase (decrease) in Cost of Sales
Net increase (decrease) in Gross Profit
P 49,900
P (32,190)
Gross Profit, this year
Gross Profit, last year
Increase (Decrease) in Gross Profit
P 44,810
77,000
P(32,190)
Requirement B:
(1) Change in Quantity
(2) Change in Unit Costs
P 77,000
P192,500
=
=
P 3,700
P161,700
=
=
40% increase
2.38% increase
Problem IV
Quantity Factor
1.
2.
Decrease in Sales due to decrease in the number
of customers [(1,000) x 18 MCF x P2.50)]
P(45,000)
Increase in Sales due to increase in consumption
rate per customer (26,000 x 2 MCF x P2.50)
Net Increase
130,000
P 85,000
Price Factor
3.
Decrease in Sales due to the decrease in rate per
MCF [P(.05) x 520,000]
7-3
(26,000)
Chapter 7 Gross Profit Variation Analysis and Earnings Per Share Determination
Increase in operating revenues
P 59,000
Supporting Computations:
Average Consumption:
(a) 2006 = 520,000 ÷ 26,000 = 20 MCF/customer
2005 = 486,000 ÷ 27,000 = 18 MCF/customer
Increase in Consumption
per customer
2 MCF/customer
(b) 27,000 - 26,000 = 1,000 decrease in number of customers
(c) Price
2006
2005
Decrease in rate or
price per MCF sold
P2.45
2.50
P(.05)
Problem V
XYZ Corporation
Gross Profit Variation Analysis
For 2006
Price Factor
Sales in 2006
Less: Sales in 2006 at 2005 prices
A (25 x P10)
B (75 x P20)
Increase (decrease) in gross profit
P 1,750
P 250
1,500
Cost Factor:
Cost of sales in 2006
Less: Cost of sales in 2006 at 2005 costs:
A (25 X P5)
P 125
B (75 x P10)
750
Increase (decrease) in gross profit
Quantity Factor:
Increase (decrease) in total quantity
Multiplied by: Average gross profit
per unit in 2005 (P750 ÷ 100)
7-4
1,750
P P
P
P
875
875
-
7.50
Gross Profit Variation Analysis and Earnings Per Share Determination Chapter 7
Increase (decrease) in gross profit
P
Sales Mix Factor:
Average gross profit per unit in 2006 at
2005 prices
Less: Average gross profit per unit in 2005
Increase (decrease)
-
P8.75 *
7.50
P1.25
Multiplied by: Total quantity in 2006
Increase (decrease) in gross profit
Increase in Gross Profit
100
P125.00
P125.00
* Sales in 2006 at 2005 prices
Less: Cost of sales in 2006 at 2005 prices
Gross profit in 2006 at 2005 prices
P1,750
875
P 875
Average Gross Profit on 2006 at 2005 prices:
P875
100 (volume in 2006)
=
P8.75
Problem VI (Computation of Weighted Average Number of Ordinary
Shares)
Date
1/1/2006
2/15/2006
4/1/2006
6/1/2006
9/1/2006
12/1/2006
Total
Number of Shares
Adjustment
for 25%
stock
As
Unadjusted dividend
Adjusted
16,000
4,000
20,000
3,200
800
4,000
(3,000)
(750)
(3,750)
1,400
350
1,750
6,400
1,600
8,000
6,000
(6,000)
30,000
30,000
Multiplier
12/12
10.5/12
9/12
7/12
4/12
-
Problem VII (Computation of Basic EPS and Diluted EPS)
1. Basic EPS
=
=
P 90,000
100,000
P0.90
7-5
Weighted
Shares
20,000
3,500
(2,812)
1,020
2,667
24,375
Chapter 7 Gross Profit Variation Analysis and Earnings Per Share Determination
2. Diluted EPS
=
P90,000 + (10% x P500,000 x 65%)
P500,000
100,000 +
P1,000
x 100
P90,000 + P32,500
150,000
=
P0.82 (rounded off)
=
Problem VIII
Requirements (1) and (2)
Explanation
Earnings
Basic earnings and shares
P122,000a
Stock option share increment
Tentative DEPS 1 amounts
P122,000
10% bond interest expense savings e 13,300d
Increment in shares
Tentative DEPS 2 amounts
P135,300
7.5% preference dividend savings e
28,500 d
Increment in shares
P163,800
5.8% bonds
21,924
Diluted earnings and shares
P185,724
a
Shares
÷
÷
33,333b = P3.66 Basic
293c
33,626 = P3.63 DEPS 1
÷
4,400 d
38,026 = P3.56 DEPS 2
÷
÷
= Per Share
9,310d
47,336 = P3.46 DEPS 3
6,264
53,600 = P3.465 Diluted
P122,000 = P150,500 (net income) - P28,500 (preference dividends)
Weighted average shares:
b
Weighted average shares
c
÷
25,000 x 1.20 = 30,000 x 7/12 = 17,500
32,000 x 1.20 = 38,400 x 4/12 = 12,800
38,400 - 2,000 = 36,400 x 1/12 = 3,033
33,333
Increment due to stock options:
Issued
Reacquired
4,000
4,000 x ( P33 + P5 )
P41
= (3,707)
Increment in shares
d
293
Impact on diluted earnings per share and ranking:
7-6
Gross Profit Variation Analysis and Earnings Per Share Determination Chapter 7
Ranking
P13,300
4,400
P3.02
5
=
P21,924
6,264
P3.50
3
=
P28,500
9,310
P3.06
2
[(0.10 x P200,000) – P1,000] x 0.7
=
200 x 22
10% bonds:
(0.058 x P540,000) x 0.7
540 x 11.6
5.8% bonds:
(0.075 x P380,000)
3,800 x 2.45
7.5% preference:
e
Impact
Dilutive effect on diluted earnings per share:
10% bonds:
P3.02 impact < P3.63 (DEPS 1), therefore dilutive
7.5% preference: P3.06 impact < P3.56 (DEPS 2), therefore dilutive
5.8% bonds:
P3.50 impact > P3.46 (DEPS 3), therefore exclude from EPS
Requirement 3
Fuego Company would report basic earnings per share of P3.66 and diluted
earnings per share of P3.46 on its 2005 income statement.
II. Multiple Choice Questions
1.
2.
3.
4.
B
B
C
D
5.
6.
7.
8.
A
B
B
B
9.
A
10. A
11. D *
12. C
13.
14.
15.
16.
A
D
C
A
17.
18.
19.
20.
A
B
C
D
21. C
22. A
23. B
* Supporting computation for no. 11:
P3,500,000 + (P800,000 x 65%)
400,000 + 25,000 + 225,000
P4,020,000
or P6.18
650,000
Diluted EPS for 12/31/2006 =
=
7-7