Solution manual managerial accounting by cabrera 2010 chapter 13 answer
Bạn đang xem bản rút gọn của tài liệu. Xem và tải ngay bản đầy đủ của tài liệu tại đây (174.92 KB, 23 trang )
MANAGEMENT ACCOUNTING (VOLUME I) - Solutions Manual
CHAPTER 13
COST-VOLUME-PROFIT RELATIONSHIPS
I.
Questions
1. The total “contribution margin” is the excess of total revenue over total
variable costs. The unit contribution margin is the excess of the unit
price over the unit variable costs.
2. Total contribution margin:
Selling price - manufacturing variable costs expensed nonmanufacturing variable costs expensed = Total contribution margin.
Gross margin:
Selling price - variable manufacturing costs expensed - fixed
manufacturing costs expensed = Gross margin.
3. A company operating at “break-even” is probably not covering costs
which are not recorded in the accounting records. An example of such
a cost is the opportunity cost of owner-invested capital. In some small
businesses, owner-managers may not take a salary as large as the
opportunity cost of forgone alternative employment. Hence, the
opportunity cost of owner labor may be excluded.
4. In the short-run, without considering asset replacement, net operating
cash flows would be expected to exceed net income, because the latter
includes depreciation expense, while the former does not. Thus, the
cash basis break-even would be lower than the accrual break-even if
asset replacement is ignored. However, if asset replacement costs are
taken into account, (i.e., on a “cradle to grave” basis), the long-run net
cash flows equal long-run accrual net income, and the long-run breakeven points are the same.
5. Both unit price and unit variable costs are expressed on a per product
basis, as:
= (P1 - V1) X1 + (P2 - V2) X2 + + (Pn - Vn) Xn - F,
for all products 1 to n where:
P
=
=
operating profit,
average unit selling price,
13-1
Chapter 13 Cost-Volume-Profit Relationships
V =
X =
F =
average unit variable cost,
quantity of units,
total fixed costs for the period.
6. If the relative proportions of products (i.e., the product “mix”) is not
held constant, products may be substituted for each other. Thus, there
may be almost an infinite number of ways to achieve a target operating
profit. As shown from the multiple product profit equation, there are
several unknowns for one equation:
= (P1 - V1) X1 + (P2 - V2) X2 + + (Pn - Vn) Xn - F,
for all products 1 to n.
7. A constant product mix is assumed to simplify the analysis. Otherwise,
there may be no unique solution.
8. Operating leverage measures the impact on net operating income of a
given percentage change in sales. The degree of operating leverage at a
given level of sales is computed by dividing the contribution margin at
that level of sales by the net operating income.
9. Three approaches to break-even analysis are (a) the equation method,
(b) the contribution margin method, and (c) the graphical method. In
the equation method, the equation is: Sales = Variable expenses + Fixed
expenses + Profits, where profits are zero at the break-even point. The
equation is solved to determine the break-even point in units or peso
sales.
10. The margin of safety is the excess of budgeted (or actual) sales over the
break-even volume of sales. It states the amount by which sales can
drop before losses begin to be incurred.
11. The sales mix is the relative proportions in which a company’s
products are sold. The usual assumption in cost-volume-profit analysis
is that the sales mix will not change.
12. A higher break-even point and a lower net operating income could
result if the sales mix shifted from high contribution margin products to
low contribution margin products. Such a shift would cause the
average contribution margin ratio in the company to decline, resulting
in less total contribution margin for a given amount of sales. Thus, net
operating income would decline. With a lower contribution margin
ratio, the break-even point would be higher since it would require more
sales to cover the same amount of fixed costs.
II. Exercises
13-2
Cost-Volume-Profit Relationships Chapter 13
Exercise 1 (Using a Contribution Format Income Statement)
Requirement 1
Total
Per Unit
Sales (30,000 units × 1.15 = 34,500 units)...............................................................
P172,500
P5.00
Less variable expenses..............................................................................................
103,500
3.00
Contribution margin...................................................................................................
69,000
P2.00
Less fixed expenses...................................................................................................
50,000
P 19,000
Net operating income.................................................................................................
Requirement 2
Sales (30,000 units × 1.20 = 36,000 units)...............................................................
P162,000
P4.50
Less variable expenses..............................................................................................
108,000
3.00
Contribution margin...................................................................................................
54,000
P1.50
Less fixed expenses...................................................................................................
50,000
P 4,000
Net operating income.................................................................................................
Requirement 3
Sales (30,000 units × 0.95 = 28,500 units)................................................................
P156,750
P5.50
Less variable expenses..............................................................................................
85,500
3.00
Contribution margin...................................................................................................
71,250
P2.50
Less fixed expenses (P50,000 + P10,000)................................................................
60,000
P 11,250
Net operating income.................................................................................................
Requirement 4
Sales (30,000 units × 0.90 = 27,000 units)................................................................
P151,200
P5.60
Less variable expenses..............................................................................................
86,400
3.20
Contribution margin...................................................................................................
64,800
P2.40
Less fixed expenses...................................................................................................
50,000
P 14,800
Net operating income.................................................................................................
Exercise 2 (Break-even Analysis and CVP Graphing)
Requirement 1
The contribution margin per person would be:
Price per ticket...........................................................................................................
P30
13-3
Chapter 13 Cost-Volume-Profit Relationships
Less variable expenses:
Dinner.....................................................................................................................
P7
Favors and program...............................................................................................
3
10
Contribution margin per person................................................................................
P20
The fixed expenses of the Extravaganza total P8,000; therefore, the breakeven point would be computed as follows:
Sales
= Variable expenses + Fixed expense + Profits
P30Q
P20Q
Q
Q
=
=
=
=
P10Q + P8,000 + P0
P8,000
P8,000 ÷ P20 per person
400 persons; or, at P30 per person, P12,000
Alternative solution:
Break-even
point
in unit sales
=
Fixed expenses
Unit contribution margin
=
P8,000
P20 per person
=
400 persons
or, at P30 per person, P12,000.
Requirement 2
Variable cost per person (P7 + P3)............................................................................
P10
Fixed cost per person (P8,000 ÷ 250 persons).........................................................
32
Ticket price per person to break even.......................................................................
P42
Requirement 3
Cost-volume-profit graph:
13-4
Cost-Volume-Profit Relationships Chapter 13
P22,000
P20,000
P18,000
Total Sales
P16,000
Break-even point: 400 persons,
or P12,000 in sales
Pesos
P14,000
P12,000
P10,000
Total Expenses
Fixed Expenses
P8,000
P6,000
P4,000
P2,000
P0
0
100
200
300
400
500
600
Number of Persons
Exercise 3 (Break-even and Target Profit Analysis)
Requirement 1
Sales
P900Q
P270Q
Q
Q
=
=
=
=
=
Variable expenses + Fixed expenses + Profits
P630Q + P1,350,000 + P0
P1,350,000
P1,350,000 ÷ P270 per lantern
5,000 lanterns, or at P900 per lantern, P4,500,000 in sales
Alternative solution:
Break-even
point
in unit sales
=
Fixed expenses
Unit contribution margin
=13-5
=
P1,350,000
P270 per
lantern
5,000 lanterns
Chapter 13 Cost-Volume-Profit Relationships
or at P900 per lantern, P4,500,000 in sales
Requirement 2
An increase in the variable expenses as a percentage of the selling price
would result in a higher break-even point. The reason is that if variable
expenses increase as a percentage of sales, then the contribution margin
will decrease as a percentage of sales. A lower CM ratio would mean that
more lanterns would have to be sold to generate enough contribution
margin to cover the fixed costs.
Requirement 3
Sales
Less variable expenses
Contribution margin
Less fixed expenses
Net operating income
Present:
Proposed:
8,000 Lanterns
10,000 Lanterns*
Total
Per Unit
Total
Per Unit
P7,200,000 P900
P8,100,000 P810 **
5,040,000
630
6,300,000 630
2,160,000 P270
1,800,000 P180
1,350,000
1,350,000
P 810,000
P 450,000
* 8,000 lanterns × 1.25 = 10,000 lanterns
** P900 per lantern × 0.9 = P810 per lantern
As shown above, a 25% increase in volume is not enough to offset a 10%
reduction in the selling price; thus, net operating income decreases.
Requirement 4
Sales
P810Q
P180Q
Q
Q
=
=
=
=
=
Variable expenses + Fixed expenses + Profits
P630Q + P1,350,000 + P720,000
P2,070,000
P2,070,000 ÷ P180 per lantern
11,500 lanterns
13-6
Cost-Volume-Profit Relationships Chapter 13
Alternative solution:
Unit sales to
attain target
profit
=
Fixed expenses + Target profit
Unit contribution margin
=
P1,350,000 + P720,000
P180 per lantern
=
11,500 lanterns
Exercise 4 (Operating Leverage)
Requirement 1
Sales (30,000 doors)...................................................................................................
P18,000,000
P600
Less variable expenses..............................................................................................
12,600,000
420
Contribution margin...................................................................................................
5,400,000
P180
Less fixed expenses...................................................................................................
4,500,000
Net operating income.................................................................................................
P 900,000
Degree of
operating
leverage
=
Contribution margin
Net operating income
=
P5,400,000
P900,000
=
6
Requirement 2
a. Sales of 37,500 doors represents an increase of 7,500 doors, or 25%,
over present sales of 30,000 doors. Since the degree of operating
leverage is 6, net operating income should increase by 6 times as much,
or by 150% (6 × 25%).
b. Expected total peso net operating income for the next year is:
Present net operating income....................................................................................
P 900,000
Expected increase in net operating income next year
(150% × P900,000).................................................................................................
1,350,000
Total expected net operating income........................................................................
P2,250,000
Exercise 5 (Multiproduct Break-even Analysis)
Requirement 1
13-7
Chapter 13 Cost-Volume-Profit Relationships
Sales
Less variable expenses
Contribution margin
Less fixed expenses
Net operating income
Model E700
Model J1500
Total Company
Amount
%
Amount
%
Amount
%
P700,000 100 P300,000 100 P1,000,000 100
280,000
P420,000
40
90,000
60 P210,000
30
70
370,000
630,000
598,500
P 31,500
37
63 *
* 630,000 ÷ P1,000,000 = 63%.
Requirement 2
The break-even point for the company as a whole would be:
Break-even point
Fixed expenses
=
in total peso sales
Overall CM ratio
P598,500
=
0.63
=
P950,000 in sales
Requirement 3
The additional contribution margin from the additional sales can be
computed as follows:
P50,000 × 63% CM ratio = P31,500
Assuming no change in fixed expenses, all of this additional contribution
margin should drop to the bottom line as increased net operating income.
This answer assumes no change in selling prices, variable costs per unit,
fixed expenses, or sales mix.
Exercise 6 (Break-even Analysis; Target Profit; Margin of Safety)
Requirement 1
Sales
P40Q
P12Q
Q
Q
=
=
=
=
=
Variable expenses + Fixed expenses + Profits
P28Q + P150,000 + P0
P150,000
P150,000 ÷ P12 per unit
12,500 units, or at P40 per unit, P500,000
13-8
Cost-Volume-Profit Relationships Chapter 13
Alternatively:
Break-even
point
in unit sales
=
Fixed expenses
Unit contribution margin
=
P150,000
P12 per unit
=
12,500 units
or, at P40 per unit, P500,000.
Requirement 2
The contribution margin at the break-even point is P150,000 since at that
point it must equal the fixed expenses.
Requirement 3
Unit sales to
attain target
profit
=
Fixed expenses + Target profit
Unit contribution margin
=
P150,000 + P18,000
P12 per unit
=
14,000 units
Total
Unit
Sales (14,000 units × P40 per unit)...........................................................................
P560,000
P40
Less variable expenses
(14,000 units × P28 per unit).................................................................................
392,000
28
Contribution margin
(14,000 units × P12 per unit).................................................................................
168,000
P12
Less fixed expenses...................................................................................................
150,000
P 18,000
Net operating income.................................................................................................
Requirement 4
Margin of safety in peso terms:
Margin of safety in pesos
=
Total sales –
13-9
Break-even sales
Chapter 13 Cost-Volume-Profit Relationships
=
P600,000
–
P500,000
=
P100,000
Margin of safety in percentage terms:
Margin of safety
Margin of safety in pesos
=
percentage
Total sales
P100,000
P600,000
=
= 16.7% (rounded)
Requirement 5
The CM ratio is 30%.
Expected total contribution margin: P680,000 × 30%.............................................
P204,000
Present total contribution margin: P600,000 × 30%................................................
180,000
P 24,000
Increased contribution margin...................................................................................
Alternative solution:
P80,000 incremental sales × 30% CM ratio = P24,000
Since in this case the company’s fixed expenses will not change, monthly
net operating income will increase by the amount of the increased
contribution margin, P24,000.
III. Problems
Problem 1 (CVP Relationships)
Requirement 1
CM ratio
=
Variable expense ratio =
Contribution margin
Selling price
=
P15
P60
Variable expense
Selling price
=
P45
P60
Requirement 2
13-10
=
25%
=
75%
Cost-Volume-Profit Relationships Chapter 13
Sales
P60Q
P15Q
Q
Q
=
=
=
=
=
Variable expenses + Fixed expenses + Profits
P45Q + P240,000 + P0
P240,000
P240,000 ÷ P15 per unit
16,000 units, or at P60 per unit, P960,000
Alternative solution:
X
0.25X
X
X
=
=
=
=
0.75X + P240,000 + P0
P240,000
P240,000 ÷ 0.25
P960,000; or at P60 per unit, 16,000 units
Requirement 3
Increase in sales....................................................
Multiply by the CM ratio.....................................
Expected increase in contribution margin...........
P400,000
x 25%
P100,000
Since the fixed expenses are not expected to change, net operating income
will increase by the entire P100,000 increase in contribution margin
computed above.
Requirement 4
Sales
P60Q
P15Q
Q
Q
=
=
=
=
=
Variable expenses + Fixed expenses + Profits
P45Q + P240,000 + P90,000
P330,000
P330,000 ÷ P15 per unit
22,000 units
Contribution margin method:
Fixed expenses + Target profit
Contribution margin per unit
=
P240,000 + P90,000
P15 per unit
= 22,000 units
Requirement 5
Margin of safety in pesos
=
Total sales – Break-even sales
=
P1,200,000 – P960,000
13-11
=
P240,000
Chapter 13 Cost-Volume-Profit Relationships
P240,000
Margin of safety
Margin of safety in pesos
=
=
P1,200,000 = 20%
percentage
Total sales
Requirement 6
a.Degree of operating leverage
b.
= Contribution margin = P300,000
P60,000
Net operating
income
Expected increase in sales..........................................
Degree of operating leverage......................................
Expected increase in net operating income...............
= 5
8%
x 5
40%
c. If sales increase by 8%, then 21,600 units
(20,000 x 1.08 = 21,600) will be sold next
year. The new income statement will be as
follows:
Sales (21,600 units)...............
Less variable expenses..........
Contribution margin..............
Less fixed expenses..............
Net operating income............
Total
P1,296,000
972,000
324,000
240,000
P 84,000
Per Unit
P60
45
P15
Percent of
Sales
100%
75%
25%
Thus, the P84,000 expected net operating income for next year
represents a 40% increase over the P60,000 net operating income
earned during the current year:
P84,000 – P60,000
=
P60,000
P24,000
P60,000
= 40% increase
Note from the income statement above that the increase in sales from
20,000 to 21,600 units has resulted in increases in both total sales and
total variable expenses. It is a common error to overlook the increase
in variable expense when preparing a projected income statement.
Requirement 7
a. A 20% increase in sales would result in 24,000 units being sold next
year: 20,000 units x 1.20 = 24,000 units.
Sales (24,000 units)...............
Less variable expenses..........
Total
P1,440,000
1,152,000
13-12
Per Unit
P60
48*
Percent of
Sales
100%
80%
Cost-Volume-Profit Relationships Chapter 13
Contribution margin..............
Less fixed expenses..............
Net operating income............
288,000
210,000†
P 78,000
P12
20%
* P45 + P3 = P48; P48 P60 = 80%.
†
P240,000 – P30,000 = P210,000.
Note that the change in per unit variable expenses results in a change in
both the per unit contribution margin and the CM ratio.
b.
Break-even point
=
in unit sales
Fixed expenses
Contribution margin per unit
=
P210,000
P12 per unit
=
17,500 units
Break-even point
=
in peso sales
Fixed expenses
CM ratio
P210,000
0.20
c. Yes, based on these data the
should be made. The changes will
= changes
P1,050,000
increase the company’s net operating income from the present P60,000
to P78,000 per year. Although the changes will also result in a higher
break-even point (17,500 units as compared to the present 16,000
units), the company’s margin of safety will actually be wider than
before:
=
Margin of safety in pesos = Total sales – Break-even sales
= P1,440,000 – P1,050,000 = P390,000
As shown in requirement (5) above, the company’s present margin of
safety is only P240,000. Thus, several benefits will result from the
proposed changes.
Problem 2 (Basics of CVP Analysis; Cost Structure)
Requirement 1
The CM ratio is 30%.
13-13
Chapter 13 Cost-Volume-Profit Relationships
Total
P270,000
189,000
P 81,000
Sales (13,500 units)
Less variable expenses
Contribution margin
Per Unit
P20
14
P 6
Percentage
100 %
70
30 %
The break-even point is:
Sales
P20Q
P 6Q
Q
Q
=
=
=
=
=
Variable expenses + Fixed expenses + Profits
P14Q + P90,000 + P0
P90,000
P90,000 ÷ P6 per unit
15,000 units
15,000 units × P20 per unit = P300,000 in sales
Alternative solution:
Break-even point
=
in unit sales
=
P90,000
P6 per unit
=
15,000 units
Break-even point
in sales pesos =
=
Requirement 2
Fixed expenses
Contribution margin per unit
=
Fixed expenses
CM ratio
P90,000
0.30
P300,000 in sales
Incremental contribution margin:
P70,000 increased sales × 30% CM ratio.............................................................
P21,000
Less increased fixed costs:
Increased advertising cost.....................................................................................
8,000
13-14
Cost-Volume-Profit Relationships Chapter 13
Increase in monthly net operating income................................................................
P13,000
Since the company presently has a loss of P9,000 per month, if the changes
are adopted, the loss will turn into a profit of P4,000 per month.
Requirement 3
Sales (27,000 units × P18 per unit*).........................................................................
P486,000
Less variable expenses
(27,000 units × P14 per unit).................................................................................
378,000
Contribution margin...................................................................................................
108,000
Less fixed expenses (P90,000 + P35,000)................................................................
125,000
Net operating loss......................................................................................................
P(17,000)
*P20 – (P20 × 0.10) = P18
Requirement 4
Sales
P 20Q
P5.40Q
Q
Q
=
=
=
=
=
Variable expenses + Fixed expenses +
Profits
P14.60Q* + P90,000 + P4,500
P94,500
P94,500 ÷ P5.40 per unit
17,500 units
* P14.00 + P0.60 = P14.60.
Alternative solution:
Unit sales to
attain target
profit
=
=
=
Fixed expenses + Target profit
CM per unit
P90,000 + P4,500
P5.40 per unit**
17,500 units
** P6.00 – P0.60 = P5.40.
Requirement 5
13-15
Chapter 13 Cost-Volume-Profit Relationships
a. The new CM ratio would be:
Per Unit
P20
7
P13
Sales
Less variable expenses
Contribution margin
Percentage
100 %
35
65 %
The new break-even point would be:
Break-even point
=
in unit sales
Fixed expenses
Contribution margin per unit
=
P208,000
P13 per unit
=
16,000 units
Break-even point
in sales pesos =
=
=
Fixed expenses
CM ratio
P208,000
0.65
P320,000 in sales
b. Comparative income statements follow:
Sales (20,000 units)
Less variable expenses
Contribution margin
Less fixed expenses
Net operating income
Not Automated
Automated
Total
Per Unit %
Total
Per Unit
P400,000
P20
100 P400,000
P20
280,000
14
70 140,000
7
120,000
P 6
30 260,000
P13
90,000
208,000
P 30,000
P 52,000
%
100
35
65
c. Whether or not one would recommend that the company automate its
operations depends on how much risk he or she is willing to take, and
depends heavily on prospects for future sales. The proposed changes
would increase the company’s fixed costs and its break-even point.
However, the changes would also increase the company’s CM ratio
(from 30% to 65%). The higher CM ratio means that once the breakeven point is reached, profits will increase more rapidly than at present.
If 20,000 units are sold next month, for example, the higher CM ratio
will generate P22,000 more in profits than if no changes are made.
13-16
Cost-Volume-Profit Relationships Chapter 13
The greatest risk of automating is that future sales may drop back down
to present levels (only 13,500 units per month), and as a result, losses
will be even larger than at present due to the company’s greater fixed
costs. (Note the problem states that sales are erratic from month to
month.) In sum, the proposed changes will help the company if sales
continue to trend upward in future months; the changes will hurt the
company if sales drop back down to or near present levels.
Note to the Instructor: Although it is not asked for in the problem, if
time permits you may want to compute the point of indifference
between the two alternatives in terms of units sold; i.e., the point
where profits will be the same under either alternative. At this point,
total revenue will be the same; hence, we include only costs in our
equation:
Let Q = Point of indifference in units sold
P14Q + P90,000 = P7Q + P208,000
P7Q = P118,000
Q = P118,000 ÷ P7 per unit
Q = 16,857 units (rounded)
If more than 16,857 units are sold, the proposed plan will yield the greatest
profit; if less than 16,857 units are sold, the present plan will yield the
greatest profit (or the least loss).
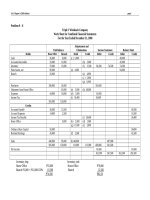
Problem 3 (Sales Mix; Multiproduct Break-even Analysis)
Requirement 1
Percentage of total sales
Sales
Less variable expenses
Contribution margin
Less fixed expenses
Net operating income (loss)
Products
Sinks
Mirrors
Vanities
Total
32%
40%
28%
100%
P160,000 100 % P200,000 100 % P140,000 100 % P500,000 100%
48,000 30
160,000 80
77,000 55
285,000 57
P112,000 70 % P 40,000 20 % P 63,000 45 % 215,000 43%*
223,600
P ( 8,600)
* P215,000 ÷ P500,000 = 43%.
Requirement 2
Break-even sales:
Break-even point
in total peso sales
=
=
=
Fixed expenses
CM ratio
13-17
P223,600
0.43
P520,000 in sales
Chapter 13 Cost-Volume-Profit Relationships
Requirement 3
Memo to the president:
Although the company met its sales budget of P500,000 for the month, the
mix of products sold changed substantially from that budgeted. This is the
reason the budgeted net operating income was not met, and the reason the
break-even sales were greater than budgeted. The company’s sales mix
was planned at 48% Sinks, 20% Mirrors, and 32% Vanities. The actual
sales mix was 32% Sinks, 40% Mirrors, and 28% Vanities.
As shown by these data, sales shifted away from Sinks, which provides our
greatest contribution per peso of sales, and shifted strongly toward Mirrors,
which provides our least contribution per peso of sales. Consequently,
although the company met its budgeted level of sales, these sales provided
considerably less contribution margin than we had planned, with a resulting
decrease in net operating income. Notice from the attached statements that
the company’s overall CM ratio was only 43%, as compared to a planned
CM ratio of 52%. This also explains why the break-even point was higher
than planned. With less average contribution margin per peso of sales, a
greater level of sales had to be achieved to provide sufficient contribution
margin to cover fixed costs.
Problem 4 (Basic CVP Analysis)
Requirement 1
The CM ratio is 60%:
Selling price
Less variable expenses
P150
60
13-18
100%
40
Cost-Volume-Profit Relationships Chapter 13
Contribution margin
P 90
60%
Requirement 2
Break-even point
in total sales
pesos
Requirement 3
=
Fixed expenses
CM ratio
=
P1,800,000
0.60
=
P3,000,000 in sales
P450,000 increased sales × 60% CM ratio = P270,000 increased
contribution margin. Since fixed costs will not change, net operating
income should also increase by P270,000.
Requirement 4
a.Degree of operating leverage
= Contribution margin = P2,160,000 = 6
P360,000
Net operating
income
b. 6 × 15% = 90% increase in net operating income.
Requirement 5
Sales
Less variable expenses
Contribution margin
Less fixed expenses
Net operating income
Last Year:
28,000 units
Total
Per Unit
P4,200,000
P150.00
Proposed:
42,000 units*
Total
Per Unit
P5,670,000 P135.00**
1,680,000
2,520,000
1,800,000
P 720,000
2,520,000
3,150,000
2,500,000
P 650,000
60.00
P 90.00
60.00
P 75.00
* 28,000 units × 1.5 = 42,000 units
** P150 per unit × 0.90 = P135.00 per unit
No, the changes should not be made.
Requirement 6
Expected total contribution margin:
28,000 units × 200% × P70 per unit*....................................................................
P3,920,000
Present total contribution margin:
2,520,000
13-19
Chapter 13 Cost-Volume-Profit Relationships
28,000 units × P90 per unit....................................................................................
Incremental contribution margin, and the amount by which
advertising can be increased with net operating income
remaining unchanged.............................................................................................
P1,400,000
* P150 – (P60 + P20) = P70
Problem 5 (Break-Even and Target Profit Analysis)
Requirement 1
The contribution margin per patch would be:
Selling price................................................................................................................
P30
Less variable expenses:
Purchase cost of the patches..................................................................................
P15
Commissions to the student salespersons............................................................
6
21
P
9
Contribution margin...................................................................................................
Since there are no fixed costs, the number of unit sales needed to yield the
desired P7,200 in profits can be obtained by dividing the target profit by
the unit contribution margin:
P7,200
Target profit
=
P9 per patch = 800 patches
Unit contribution margin
800 patches x P30 per patch =
P24,000 in total sales
Requirement 2
Since an order has been placed, there is now a “fixed” cost associated with
the purchase price of the patches (i.e., the patches can’t be returned). For
example, an order of 200 patches requires a “fixed” cost (investment) of
P3,000 (200 patches × P15 per patch = P3,000). The variable costs drop to
only P6 per patch, and the new contribution margin per patch becomes:
Selling price................................................................................................................
P30
Less variable expenses (commissions only).............................................................
6
Contribution margin...................................................................................................
P24
Since the “fixed” cost of P3,000 must be recovered before Ms. Morales
shows any profit, the break-even computation would be:
13-20
Cost-Volume-Profit Relationships Chapter 13
Break-even
point
in unit sales
Fixed expenses
= Unit contribution margin
P3,000
= P24 per patch
= 125 patches
125 patches x P30 per patch = P3,750 in total sales
If a quantity other than 200 patches were ordered, the answer would
change accordingly.
Problem 6
Requirement 1: Break-even chart
TR
600,000
500,000
TC
400,000
(P)
300,000
Break-even
point
200,000
FC
100,000
5,000
10,000 15,000 20,000 25,000 30,000
13-21
(units)
Chapter 13 Cost-Volume-Profit Relationships
Requirement 2: Profit-volume graph
250,000
P
R
O
F
I
T
200,000
150,000
100,000
50,000
Break-even
point
0
5,000 10,000 15,000 20,000 25,000 30,000
50,000
100,000
L
O
S
S
150,000
200,000
250,000
13-22
Cost-Volume-Profit Relationships Chapter 13
IV. Multiple Choice Questions
1.
2.
3.
4.
5.
B
B
B
C
C
6.
7.
8.
9.
10.
B
D
B
A
D
11.
12.
13.
14.
15.
B
A
A
C
D
16.
17.
18.
19.
20.
13-23
D
D
D
C
D
21.
22.
23.
24.
25.
A
D
C
B
C
26.
27.
28.
29.
30.
A
B
C
B
A