solution manual for financial reporting financial statement analysis and valuation a strategic perspective 7th edition wahlen baginski bradshaw
Bạn đang xem bản rút gọn của tài liệu. Xem và tải ngay bản đầy đủ của tài liệu tại đây (352.05 KB, 33 trang )
download full file at
CHAPTER 2
ASSET AND LIABILITY VALUATION
AND INCOME MEASUREMENT
Solutions to Questions, Exercises, and Problems, and Teaching Notes to Cases
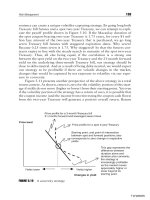
2.1 Asset Valuation and Income Recognition. The important part of the question is that
it focuses on net income (as opposed to comprehensive income). Changes in the
valuation of assets generally result in an increase in shareholders’ equity (to
maintain the balance of the accounting equation), which is accomplished through
associated effects captured as part of net income. For example, sales generate cash
or receivables, which increase both assets and net income. Similarly, recognition of
depreciation expense decreases both assets and net income. However, certain
changes in asset valuations result in corresponding amounts being temporarily held
as part of “accumulated other comprehensive income” on the balance sheet (in
shareholders’ equity). Such changes would be part of Approach 2 as shown in
Exhibit 2.4 and discussed in the text. In these situations, asset valuations do not
have to relate to the recognition of net income (although such asset valuations relate
to comprehensive income).
2.2 Reliability versus Relevance. Reliability is an attribute of accounting information
that relates to the degree of verifiability or representational faithfulness of the
reported amounts; reliable asset valuations are supported by source documents,
liquid market prices, or other credible evidence. There is limited room for
subjectivity in these valuations. For example, reporting assets at acquisition cost
provides management with fewer opportunities to bias the valuation compared to
using current replacement costs or fair value inputs. Relevance describes
accounting information that is timely and has the capacity to affect a user’s
decisions based on the information; relevant asset valuations incorporate all
available information, including the acquisition cost and subsequent developments.
Relevant asset valuations may or may not be subjective; the existence of
subjectivity in an asset valuation does not necessarily mean the valuation will not be
reliable.
Examples:
Historical cost/reliable and relevant: accounts receivable, fixed assets, and other
assets with values that remain relatively stable
Historical cost/reliable but less relevant: LIFO inventory layers, acquired
research and development and other intangible assets, and real estate that has
appreciated
download full file at
Chapter 2
Asset and Liability Valuation
and Income Measurement
Fair value/relevant and reliable: Marketable equity securities, commodities, and
financial assets traded in liquid markets
Fair value/relevant but less reliable: Real estate valuations based on comparable
analysis, internally generated intangible asset valuations, and pension plan assets
invested in illiquid investments
2.3 Income Flows versus Cash Flows. The analysis below demonstrates that the change
in cash for the five years as a whole is $117,000. Subtracting the $100,000 cash
contribution by the owners equals $17,000, which equals the amount of net income
for the five years and the balance in retained earnings at the end of five years. Note
that the cash outflow to purchase the machine occurs at the beginning of the first
year, whereas depreciation on the machine occurs throughout the five years, and the
remaining book value of the machine of $20,000 affects computation of the gain on
sale at the end of five years. Thus, the statement about the equivalence of cash
flows and earnings holds for this example and in general.
Transaction or Event
Cash Contributed by Owners.....
Purchase of Machine for Cash....
Recognition of Rent Revenue.....
.......................................125,000
Recognition of Operating
Expenses................................
Recognition of Depreciation......
Sale of Machine..........................
Totals......................................
Common
Net
Cash
Equipment
Stock
Income
+ $ 100,000
+ $ 100,000
–
100,000 + $ 100,000
+ 125,000
+ $
–
30,000
–
80,000
+
22,000 –
20,000
$ 117,000
$
0
–
–
+
$ 100,000
30,000
80,000
2,000
$ 17,000
2.4 Measurement of Acquisition Cost. Acquisition cost is $240,500 ($250,000 invoice
price – $15,000 cash discount + $4,000 for the title + $1,500 to paint company’s
name on the truck). The license fee of $800 and the insurance of $2,500 are not
costs to prepare the truck for its intended use, but costs to operate the truck during
its first year. Therefore, these latter two costs are prepayments that become
expenses of the first year.
2.5 Measurement of a Monetary Asset.
Balance, January 1, 2009: $10 million x 9.81815 (Part a.)............... $ 98,181,500
Interest for 2009: .08 x $98,181,500.................................................
7,854,520
Less Cash Received...........................................................................
(10,000,000)
Balance, December 31, 2009 (Part b.)............................................... $ 96,036,020
Interest for 2010: .08 x $96,036,020.................................................
7,682,882
22
Copyright © 2011 Cengage Learning. All Rights Reserved. May not be scanned, copied, or duplicated, in whole or in part, except
for use as permitted in a license distributed with a certain product or service or otherwise on a password-protected website for
classroom use.
download full file at
Less Cash Received...........................................................................
(10,000,000)
Balance, December 31, 2010 (Part c.)............................................... $ 93,718,902
download full file at
Chapter 2
Asset and Liability Valuation
and Income Measurement
2.6 Fair Value Measurements.
a.The stocks are Level 1 assets, assuming they are for public companies for which
the prices of each share are available via closing quotes from one of the major
exchanges.
b. Bonds are also likely Level 1 assets if they are publicly traded; however, if they
are privately placed issues, they would be Level 2 assets because their values
would be determined by reliable inputs such as market interest rates and yield
curves.
c.Real estate is more likely comprised of Level 2 assets, given ready availability of
real estate valuation data.
d. Timber investments are either Level 2 or Level 3 assets depending on the
availability of directly applicable current and future timber prices.
e.Private equity funds are typically invested in young privately held start-up
companies, and due to the illiquidity of such investments and difficulty in
obtaining directly comparable asset prices, these would likely be Level 3 assets.
f. Illiquid asset-backed securities are, by definition, illiquid, and although various
models exist for valuing manufactured securities (such as mortgage-backed
securities), the inputs are generally well-placed guesses, making such assets
Level 3.
2.7 Computation of Income Tax Expense.
a. Taxes Currently Payable.................................................................
Plus Decrease in Deferred Tax Assets: $42,900 – $38,700...........
Plus Increase in Deferred Tax Liabilities: $34,200 – $28,600.......
Income Tax Expense.......................................................................
b. Taxes Currently Payable.................................................................
Plus Decrease in Deferred Tax Assets: $42,900 – $38,700...........
Less Decrease in Deferred Tax Liability: $58,600 – $47,100.......
Income Tax Expense.......................................................................
$ 50,000
4,200
5,600
$ 59,800
$ 50,000
4,200
(11,500)
$ 42,700
c. In both Part a. and Part b., the value of the deferred tax asset decreased, which
means that the company utilized deferred tax assets to decrease taxes owed
relative to the amount expensed. However, the difference lies in the change in
the deferred tax liability. In Part a., the deferred tax liability increased, which
occurs when the firm has larger deductions (lower income) on its tax return
relative to amounts expensed (amounts recognized in income).
The
advantageous treatment of these amounts leads to lower current cash outflows
for taxes than amounts recognized as income tax expense. For Part b., the
24
Copyright © 2011 Cengage Learning. All Rights Reserved. May not be scanned, copied, or duplicated, in whole or in part, except
for use as permitted in a license distributed with a certain product or service or otherwise on a password-protected website for
classroom use.
download full file at
situation is reversed. In Part b., the decrease in the deferred tax liability means
that previous timing differences likely reversed, leading to higher cash
payments required for current income tax payments relative to amounts
recognized as income tax expense.
2.8 Computation of Income Tax Expense.
a. Taxes Currently Payable.................................................................
Less Increase in Deferred Tax Assets:
Beginning of Year: $24,600 – $6,400 =
$ 18,200
End of Year: $27,200 – $7,200 =
20,000............
Less Decrease in Deferred Tax Liabilities: $18,900 – $16,300.....
Income Tax Expense.......................................................................
b. Taxes Currently Payable.................................................................
Less Increase in Deferred Tax Assets:
Beginning of Year: $24,600 – $6,400 =
$ 18,200
End of Year: $27,200 – $4,800 =
22,400............
Less Decrease in Deferred Tax Liabilities: $18,900 – $16,300.....
Income Tax Expense.......................................................................
$ 35,000
(1,800)
(2,600)
$ 30,600
$ 35,000
(4,200)
(2,600)
$ 28,200
2.9 Effect of Valuation Method for Nonmonetary Asset on Balance Sheet and
Income Statement.
a.Valuation of the land at acquisition until sale of land:
2009
Assets
=
Cash
–100,000
Land
+100,000
Liabilities
+
CC
Shareholders' Equity
AOCI
Land.................................................................................... 100,000
Cash................................................................................
RE
100,000
2010
No Entry
2011
Assets
=
Cash
+180,000
Land
–100,000
Liabilities
+
CC
Shareholders' Equity
AOCI
RE
Gain on Sale
of Land
download full file at
+80,000
Chapter 2
Asset and Liability Valuation
and Income Measurement
Cash..................................................................................... 180,000
Land................................................................................
Gain on Sale of Land......................................................
100,000
80,000
b. Valuation of the land at current market value but including unrealized gains and
losses in accumulated other comprehensive income until sale of land:
2009
Assets
=
Cash
–100,000
Land
+100,000
Liabilities
+
CC
Shareholders' Equity
AOCI
Land.................................................................................... 100,000
Cash................................................................................
Assets
Land
=
Liabilities
+
CC
+50,000
RE
100,000
Shareholders' Equity
AOCI
Unrealized Holding Gain or
Loss—OCI +50,000
Land....................................................................................
Unrealized Holding Gain or Loss—OCI........................
RE
50,000
50,000
2010
Assets
Land
=
Liabilities
+
CC
–30,000
Shareholders' Equity
AOCI
Unrealized Holding Gain or
Loss—OCI –30,000
Unrealized Holding Gain or Loss—OCI............................
Land................................................................................
RE
30,000
30,000
2011
Assets
Cash
Land
=
Liabilities
+
CC
+180,000
–120,000
Shareholders' Equity
AOCI
RE
Unrealized Holding Gain or
Gain on Sale
Loss—OCI –20,000
of Land
Cash..................................................................................... 180,000
Unrealized Holding Gain or Loss—OCI............................ 20,000
Land................................................................................
Gain on Sale of Land......................................................
120,000
80,000
26
Copyright © 2011 Cengage Learning. All Rights Reserved. May not be scanned, copied, or duplicated, in whole or in part, except
for use as permitted in a license distributed with a certain product or service or otherwise on a password-protected website for
classroom use.
+80,000
download full file at
c.Valuation of the land at current market value and including market value changes
each year in net income:
2009
Assets
=
Cash
–100,000
Land
+100,000
Liabilities
+
CC
Shareholders' Equity
AOCI
Land.................................................................................... 100,000
Cash................................................................................
Assets
Land
=
Liabilities
+
CC
+50,000
RE
100,000
Shareholders' Equity
AOCI
RE
Gain on Fair
Market Value
of Land
Land....................................................................................
Gain on Fair Market Value of Land................................
+50,000
50,000
50,000
2010
Assets
Land
=
Liabilities
+
CC
–30,000
Shareholders' Equity
AOCI
RE
Loss on Fair
Market Value
of Land
Loss on Fair Market Value of Land....................................
Land................................................................................
–30,000
30,000
30,000
2011
Assets
Cash
Land
=
+180,000
–120,000
Liabilities
+
CC
Shareholders' Equity
AOCI
RE
Gain on Sale
of Land
Cash..................................................................................... 180,000
Land................................................................................
Gain on Sale of Land......................................................
120,000
60,000
d. Net income over sufficiently long time periods equals cash inflows minus cash
outflows, other than cash transactions with owners. Walmart acquired the land
in 2009 for $100,000 and sold it for $180,000 in 2011. Thus, the total effect on
net income through the realization of the increase in the value of the land
bought and sold is $80,000. The three different methods of asset valuation and
income measurement recognize this $80,000 in different patterns over time, but
the total is the same.
download full file at
+60,000
Chapter 2
Asset and Liability Valuation
and Income Measurement
2.10 Effect of Valuation Method for Monetary Asset on Balance Sheet and Income
Statement.
a. Valuation of the note at the present value of future cash flows using the
historical market interest rate of 8 percent (Approach 1)
2011
Assets
Note Receivable
Land
=
Liabilities
+
CC
+180,000
–100,000
Shareholders' Equity
AOCI
RE
Gain on Sale
of Land
Note Receivable.................................................................. 180,000
Land................................................................................
Gain on Sale of Land......................................................
+80,000
100,000
80,000
2012
Assets
Cash
Note Receivable
=
Liabilities
+
CC
Shareholders' Equity
AOCI
+100,939
–86,539
RE
Interest Revenue
Cash..................................................................................... 100,939
Interest Revenue.............................................................
Note Receivable.............................................................
14,400a
14,400a
86,539
$14,400 = .08 x $180,000
a
2013
Assets
Cash
Note Receivable
=
Liabilities
+
CC
Shareholders' Equity
AOCI
+100,939
–93,461
RE
Interest Revenue
Cash..................................................................................... 100,939
Interest Revenue.............................................................
Note Receivable.............................................................
7,478b
93,461
$7,478 = .08 x ($180,000 – $86,539) plus an additional $1 due to rounding
b
b. Valuation of the note at the present value of future cash flows, adjusting the note
to fair value upon changes in market interest rates and including unrealized
gains and losses in net income (Approach 3)
28
Copyright © 2011 Cengage Learning. All Rights Reserved. May not be scanned, copied, or duplicated, in whole or in part, except
for use as permitted in a license distributed with a certain product or service or otherwise on a password-protected website for
classroom use.
7,478b
download full file at
2011
Assets
Note Receivable
Land
=
Liabilities
+
CC
+180,000
–100,000
Shareholders' Equity
AOCI
RE
Gain on Sale
of Land
Note Receivable.................................................................. 180,000
Land................................................................................
Gain on Sale of Land......................................................
+80,000
100,000
80,000
2012
Assets
Cash
Note Receivable
Note Receivable
=
Liabilities
+
CC
Shareholders' Equity
AOCI
RE
Interest Revenue
Loss on Note
Receivable
+100,939
–86,539
–1,699
Cash..................................................................................... 100,939
Interest Revenue.............................................................
Note Receivable.............................................................
+14,400
a
–1,699
c
14,400a
86,539
$14,400 = .08 x $180,000
a
Loss on Note Receivable....................................................
Note Receivable.............................................................
1,699c
1,699
c
$1,699 = $91,762 – ($180,000 – $86,539)
2013
Assets
Cash
Note Receivable
=
Liabilities
+
CC
Shareholders' Equity
AOCI
+100,939
–91,762
RE
Interest Revenue
Cash..................................................................................... 100,939
Interest Revenue.............................................................
Note Receivable.............................................................
9,177d
91,762
$9,177 = .10 x $91,762 plus an additional $1 due to rounding
d
c. Over sufficiently long time periods, net income equals cash inflows minus cash
outflows, other than cash transactions with owners. WMT receives $101,878 net
in cash from purchasing the land for $100,000 and selling it for $201,878
($100,939 x 2). Problem 2.9 indicates that net income across 2009 to 2011
includes the $80,000 change in market value of the land as of the time of sale on
December 31, 2011. The $21,878 difference between the cash received of
$201,878 and the market value of the land on December 31, 2011, of $180,000 is
download full file at
9,177
d
Chapter 2
Asset and Liability Valuation
and Income Measurement
income for 2012 and 2013. The valuation method in Part a. uses the 8 percent
interest rate applicable to this note on December 31, 2011, both to value the note
and to recognize interest revenue for both years (acquisition cost valuation of the
asset, Approach 1 for income recognition). The valuation method in Part b. uses
the market interest rate for this note each year (8 percent for 2012 and 10 percent
for 2013) to value the note and to recognize interest revenue and holding gains
and losses (fair value for the asset, Approach 3 for income recognition). These
two methods report the same total income but in a different pattern over time.
2.11 Effect of Valuation Method for Nonmonetary Asset on Balance Sheet and
Income Statement.
a. Assume for this part that PCU accounts for the equipment using acquisition cost
adjusted for depreciation and impairment losses.
(1)
Assets
=
Equipment
+100,000
Cash
–100,000
Liabilities
+
CC
Shareholders' Equity
AOCI
Equipment........................................................................... 100,000
Cash................................................................................
RE
100,000
(2)
Assets
Accumulated
Depreciation
=
Liabilities
+
CC
–25,000
Shareholders' Equity
AOCI
RE
Depreciation
Expense
Depreciation Expense.........................................................
Accumulated Depreciation.............................................
–25,000
25,000
25,000
(3)
Assets
Equipment
=
Liabilities
+
CC
Shareholders' Equity
AOCI
–15,000
RE
Impairment Loss
Impairment Loss.................................................................
Equipment......................................................................
–15,000
15,000
15,000
(4)
Assets
Accumulated
Depreciation
=
Liabilities
+
CC
–20,000
Shareholders' Equity
AOCI
RE
Depreciation
Expense
210
Copyright © 2011 Cengage Learning. All Rights Reserved. May not be scanned, copied, or duplicated, in whole or in part, except
for use as permitted in a license distributed with a certain product or service or otherwise on a password-protected website for
classroom use.
–20,000
download full file at
Depreciation Expense.........................................................
Accumulated Depreciation.............................................
20,000
20,000
(5)
Assets
Accumulated
Depreciation
=
Liabilities
+
CC
–20,000
Shareholders' Equity
AOCI
RE
Depreciation
Expense
Depreciation Expense.........................................................
Accumulated Depreciation.............................................
–20,000
20,000
20,000
(6)
Assets
Cash
Equipment
Accumulated
Depreciation
=
Liabilities
+
CC
+26,000
–85,000
Shareholders' Equity
AOCI
RE
Gain on Sale
of Equipment
+6,000
+65,000
Cash.....................................................................................
Accumulated Depreciation..................................................
Equipment......................................................................
Gain on Sale of Equipment............................................
26,000
65,000
85,000
6,000
b. Assume that PCU accounts for the equipment using current market values
adjusted for depreciation and impairment losses.
(1)
Assets
=
Equipment
+100,000
Cash
–100,000
Liabilities
+
CC
Shareholders' Equity
AOCI
Equipment........................................................................... 100,000
Cash................................................................................
RE
100,000
(2)
Assets
Accumulated
Depreciation
=
–25,000
Liabilities
+
CC
Shareholders' Equity
AOCI
RE
Depreciation
Expense
Depreciation Expense.........................................................
Accumulated Depreciation.............................................
download full file at
25,000
25,000
–25,000
Chapter 2
Asset and Liability Valuation
and Income Measurement
(3)
Assets
Equipment
=
Liabilities
+
CC
Shareholders' Equity
AOCI
–15,000
RE
Impairment Loss
Impairment Loss.................................................................
Equipment......................................................................
–15,000
15,000
15,000
(4)
Assets
Accumulated
Depreciation
=
Liabilities
+
CC
–20,000
Shareholders' Equity
AOCI
RE
Depreciation
Expense
Depreciation Expense.........................................................
Accumulated Depreciation.............................................
–20,000
20,000
20,000
(5)
Assets
Equipment
=
Liabilities
+
CC
+8,000
Shareholders' Equity
AOCI
RE
Gain on Change in
Equipment Fair
Value
Equipment...........................................................................
Gain on Change in Equipment Fair Value......................
+8,000
8,000
8,000
(6)
Assets
Accumulated
Depreciation
=
Liabilities
+
CC
–24,000
Shareholders' Equity
AOCI
RE
Depreciation
Expense
Depreciation Expense.........................................................
Accumulated Depreciation.............................................
–24,000
24,000
24,000
(7)
Assets
Equipment
=
Liabilities
+
CC
+2,000
Shareholders' Equity
AOCI
RE
Gain on Change in
Equipment Fair
Value
Equipment...........................................................................
Gain on Change in Equipment Fair Value......................
2,000
2,000
212
Copyright © 2011 Cengage Learning. All Rights Reserved. May not be scanned, copied, or duplicated, in whole or in part, except
for use as permitted in a license distributed with a certain product or service or otherwise on a password-protected website for
classroom use.
+2,000
download full file at
(8)
Assets
=
Cash
Accumulated
Depreciation
+26,000
Equipment
–95,000
Liabilities
+
CC
Shareholders' Equity
AOCI
RE
+69,000
Cash.....................................................................................
Accumulated Depreciation..................................................
Equipment......................................................................
26,000
69,000
95,000
c. Total expenses over sufficiently long time periods equal cash outflows, other than
cash transactions with owners. The negative $74,000 total net cash outflow for
the equipment reflects the cash outflow to acquire the equipment of $100,000
offset by the cash inflow to sell the equipment for $26,000. When the
depreciation expense, gain, and loss accounts under the retained earnings column
are summed, the total also is negative $74,000, which is the amount that reduced
income related to the purchase, use, and disposition of the equipment.
2.12 Effect of Valuation Method for Monetary Asset on Balance Sheet and Income
Statement.
a. Assume that Alfa Romeo accounts for this note throughout the three years using
its initial present value.
(1)
Assets
=
Automobile
Inventory
+30,000
Cash
–30,000
Liabilities
+
CC
Shareholders' Equity
AOCI
Automobile Inventory.........................................................
Cash................................................................................
RE
30,000
30,000
(2)
Assets
Cash
Note Receivable
Automobile
Inventory
=
Liabilities
+
CC
Shareholders' Equity
AOCI
+5,000
Sales
+40,000
RE
+45,000
Cost of Goods Sold –30,000
–30,000
download full file at
Chapter 2
Asset and Liability Valuation
and Income Measurement
Cash.....................................................................................
Note Receivable..................................................................
Sales................................................................................
5,000
40,000
Cost of Goods Sold.............................................................
Automobile Inventory....................................................
30,000
45,000
30,000
(3)
Assets
Cash
Note Receivable
=
Liabilities
+
CC
Shareholders' Equity
AOCI
+14,414
b
–12,814
RE
Interest Revenue
Cash.....................................................................................
Note Receivable.............................................................
Interest Revenue.............................................................
+1,600
a
+1,087
c
+555
e
14,414
12,814b
1,600a
$1,600 = 0.04 x $40,000
$12,814 = $14,414 – $1,600
a
b
(4)
Assets
Cash
Note Receivable
=
Liabilities
+
CC
Shareholders' Equity
AOCI
+14,414
d
–13,327
RE
Interest Revenue
Cash.....................................................................................
Note Receivable.............................................................
Interest Revenue.............................................................
14,414
13,327d
1,087c
$1,087 = .04 x ($40,000 – $12,814)
$13,327 = $14,414 – $1,087
c
d
(5)
Assets
Cash
Note Receivable
=
Liabilities
+
CC
Shareholders' Equity
AOCI
+14,414
f
–13,859
RE
Interest Revenue
Cash.....................................................................................
Note Receivable.............................................................
Interest Revenue.............................................................
14,414
13,859f
555e
$555 = .04 x $13,859 plus an additional $1 due to rounding
$13,859 = $14,414 – $555
e
f
214
Copyright © 2011 Cengage Learning. All Rights Reserved. May not be scanned, copied, or duplicated, in whole or in part, except
for use as permitted in a license distributed with a certain product or service or otherwise on a password-protected website for
classroom use.
download full file at
b. Assume that Alfa Romeo values this note receivable at fair value each year.
(1)
Assets
=
Automobile
Inventory
+30,000
Cash
–30,000
Liabilities
+
CC
Shareholders' Equity
AOCI
Automobile Inventory.........................................................
Cash................................................................................
RE
30,000
30,000
(2)
Assets
Cash
=
Liabilities
+
CC
Shareholders' Equity
AOCI
+5,000
Note Receivable
Automobile
Inventory
RE
Sales
+40,000
+45,000
Cost of Goods Sold –30,000
–30,000
Cash.....................................................................................
Note Receivable..................................................................
Sales................................................................................
5,000
40,000
Cost of Goods Sold.............................................................
Automobile Inventory....................................................
30,000
45,000
30,000
(3)
Assets
Cash
Note Receivable
=
Liabilities
+
CC
Shareholders' Equity
AOCI
+14,414
b
–12,814
RE
Interest Revenue
Cash.....................................................................................
Note Receivable.............................................................
Interest Revenue.............................................................
$1,600 = .04 x $40,000
$12,814 = $14,414 – $1,600
a
b
download full file at
14,414
12,814b
1,600a
+1,600
a
Chapter 2
Asset and Liability Valuation
and Income Measurement
(4)
Assets
Note Receivable
=
Liabilities
+
CC
–384
Shareholders' Equity
AOCI
RE
Loss on Decline in
Fair Value of Note
Receivable
Loss on Decline in Fair Value of Note Receivable.............
Note Receivable.............................................................
c
–384
384c
384
c
$384 = $26,802 – ($40,000 – $12,814)
(5)
Assets
Cash
Note Receivable
=
Liabilities
+
CC
Shareholders' Equity
AOCI
+14,414
e
–13,074
RE
Interest Revenue
Cash.....................................................................................
Note Receivable.............................................................
Interest Revenue.............................................................
+1,340
d
14,414
13,074e
1,340d
$1,340 = .05 x $26,802
$13,074 = $14,414 – $1,340
d
e
(6)
Assets
Note Receivable
=
Liabilities
+
CC
–382
Shareholders' Equity
AOCI
RE
Loss on Decline in
Fair Value of Note
Receivable
Loss on Decline in Fair Value of Note Receivable.............
Note Receivable.............................................................
f
382f
382
$382 = $13,346 – ($26,802 – $13,074)
216
Copyright © 2011 Cengage Learning. All Rights Reserved. May not be scanned, copied, or duplicated, in whole or in part, except
for use as permitted in a license distributed with a certain product or service or otherwise on a password-protected website for
classroom use.
f
–382
download full file at
(7)
Assets
Cash
Note Receivable
=
Liabilities
+
CC
Shareholders' Equity
AOCI
+14,414
h
–13,346
RE
Interest Revenue
Cash.....................................................................................
Note Receivable.............................................................
Interest Revenue.............................................................
14,414
13,346h
1,068g
$1,068 = .08 x $13,346
$13,346 = $14,414 – $1,068
g
h
c. Total expenses over sufficiently long time periods equal cash inflows minus cash
outflows, other than cash transactions with owners. The $18,242 balance in
retained earnings equals the cash inflows of $48,242 ($5,000 + $14,414 + $14,414
+ $14,414) minus cash outflows of $30,000 for the cost of the automobile.
d. In Part a., the balance sheet suffers at the end of 2010 and 2011 because the note
receivable is overvalued. The overvaluation is due to the market interest rate that
Alfa Romeo ought to be realizing on the note being higher than what the company
is actually realizing. Thus, the note is worth less than its adjusted acquisition cost
(that is, the initial present value minus payments). In Part b., however, the fair
valuation of the note receivable on the balance sheet results in volatility of the
“loss” and “interest revenue” line items, reflecting the fair value adjustments.
2.13 Deferred Tax Assets.
a. Biosante Pharmaceuticals discloses that the amount of the net operating loss
carryforwards at the end of 2008 is $62,542,000. This amount reflects the
accumulated total of taxable losses (as opposed to taxable income) that Biosante
has reported on its tax returns (possibly offset by taxable income, but this seems
unlikely). In future years, Biosante could offset up to $62,542,000 of taxable
income with the tax loss carryforwards, for which the company did not receive
any tax benefit at the time they were reported. The amount of the deferred tax
asset for these net operating loss carryforwards is $23,609,594. This is the
income tax “shield” available due to the $62,542,000 tax loss carryfowards.
The link between these two amounts is that the deferred tax asset represents the
tax effect of the tax loss carryforwards. Generally, this text uses 35–40 percent
as the tax effect of income and deductions. You can back into the rate that was
assumed by Biosante. $23,609,594/$62,542,000 = 37.75%. Intuitively, for each
dollar of taxable income the company might report in the future (up to
$62,542,000), it would be able to save $0.3775 in tax because it would offset
that dollar of taxable income with a dollar of its tax loss carryforwards.
download full file at
+1,068
g
Chapter 2
Asset and Liability Valuation
and Income Measurement
b. The company has recorded a valuation allowance for the deferred tax asset
equal to the entire amount of the deferred tax asset. What this means is that the
company believes that it is “more likely than not” to use its deferred tax assets
before they expire. This implies that management is not optimistic about the
company’s ability to generate future taxable income.
c. The increase in the valuation allowance was achieved by the following entry:
Income Tax Expense (28,946,363 – 21,818,084)...............7,128,279
Valuation Allowance.......................................................
7,128,279
The income tax expense entry decreased net income; the valuation allowance
entry decreased the deferred tax asset. However, note that the change in the
valuation allowance exactly equals the increase in the deferred tax assets. This
increase in deferred tax assets would have been achieved via a cumulative
adjustment to the financial statements for the individual deferred tax assets,
symbolically represented as follows:
Deferred Tax Asset (28,946,363 – 21,818,084)..................7,128,279
Income Tax Expense.......................................................
7,128,279
As a result of the build-up of the deferred tax assets but the full reserve for this
build-up, there was no impact on net income for fiscal 2008. Indeed, the
company’s tax provision disclosed in the footnotes is as follows:
Taxes at U.S. Federal Statutory Rate.............................................. $(6,030,952)
State Taxes, Net of Federal Benefit................................................
(568,133)
Research and Development Credits................................................
(526,196)
Other, Net........................................................................................
(2,998)
Change in Valuation Allowance......................................................
7,128,279
Income Tax Expense....................................................................... $
0
2.14 Interpreting Income Tax Disclosures.
a. ABC’s income before income taxes for financial reporting exceeded taxable
income because the net deferred tax liability increased between the end of 2007
and the end of 2008. Also note that total income tax expense exceeds income
taxes currently payable, so ABC deferred some tax payments to later years.
b. Income before income taxes for financial reporting exceeded taxable income
because the net deferred tax liability increased between the end of 2007 and the
end of 2008. In addition, total income tax expense exceeded income taxes
currently payable.
218
Copyright © 2011 Cengage Learning. All Rights Reserved. May not be scanned, copied, or duplicated, in whole or in part, except
for use as permitted in a license distributed with a certain product or service or otherwise on a password-protected website for
classroom use.
download full file at
c. The deferral of tax payments in 2007 and 2008 results in an addition to net
income of $208 million and $94 million, respectively, when cash flow from
operations is computed. ABC did not pay as much income taxes as the
subtraction for income tax expense in the income statement would suggest.
d. ABC recognizes insurance expense earlier for financial reporting than for tax
reporting, giving rise to a deferred tax asset for the future savings in income
taxes when actual losses materialize. The decline in the deferred tax asset for
self-insured benefits between the end of 2006 and the end of 2007 indicates that
ABC paid out more in actual claims during 2007 than it recognized as an
expense. The increase in the deferred tax asset for self-insured benefits between
the end of 2007 and the end of 2008 indicates that ABC recognized more
expense than it paid in actual claims during 2008.
e. ABC recognizes these costs as expenses earlier for financial reporting than for
tax reporting, giving rise to a deferred tax asset for the future income taxes
savings when it sells the inventory items. The decline in the deferred tax assets
for inventory between the end of 2006 and the end of 2007 suggests that
inventories declined during 2007, resulting in a larger expense for tax reporting
than for financial reporting. The increase in the deferred tax assets for inventory
between the end of 2007 and the end of 2008 suggests that inventories increased
during 2008.
f. The deferred tax asset related to the health care obligation indicates that ABC
has recognized more expenses cumulatively for financial reporting than for
payments made to the health care plan. The slight increase in the deferred tax
assets for postretirement health care between the end of 2006 and the end of
2007 indicates that ABC grew the number of employees, improved health care
benefits, or experienced increased health care costs during 2007. The decrease
in the deferred tax assets for postretirement health care between the end of 2007
and the end of 2008 suggests a decline in the number of employees, lower
health care benefits, or lower health care costs. The deferred tax liability related
to pension indicates that ABC has contributed larger amounts cumulatively to its
pension fund than it has recognized as expenses for financial reporting. The
growing amounts over time suggest that ABC has consistently grown the
number of its employees or their retirement benefits each year.
g. The deferred tax asset related to uncollectible accounts indicates that ABC
recognizes losses for uncollectibles earlier for financial reporting than for tax
reporting. The deferred tax asset indicates the future savings in income taxes
the firm will realize when it writes off actual uncollectible accounts. The
increasing amount for this deferred tax asset is consistent with growth in sales.
download full file at
Chapter 2
Asset and Liability Valuation
and Income Measurement
h. The deferred tax liability indicates that ABC recognizes depreciation earlier for
tax reporting than for financial reporting. The increasing amounts for this
deferred tax liability suggest that ABC increased its capital expenditures each
year and therefore had more depreciable assets in the early years of their lives,
when accelerated depreciation exceeds straight-line depreciation, than it has
depreciable assets in the later years of their lives, when straight-line
depreciation exceeds accelerated depreciation.
2.15 Interpreting Income Tax Disclosures.
a.In 2008, the deferred income tax provision is positive, whereas in 2007, it is
negative. This shows that income before taxes exceeded taxable income in
2008, but the reverse was true for 2007.
b. During 2008, the deferred tax liability increased from $110 million to $495
million. Because this increase was associated with a deferred income tax
provision of $385 million but no associated tax payment for this amount was
made, this increase will appear on the statement of cash flows as a positive
adjustment to net income. In 2007, the opposite is true, although the 2006
balance sheet amount of deferred tax liabilities in the footnote disclosure is not
available. However, it is not needed because the components of the provision
are such that the deferred provision was negative, indicating that the company
reported higher taxable income in 2007 than income before taxes.
c.The premiums collected from customers go immediately into taxable income, but
they do not get reported as financial income until ratably over the period in
which customers have purchased legal insurance. Thus, PPD has paid taxes on
these amounts although they have not been reported as financial reporting
income. In the future, when PPD recognizes the revenue currently deferred,
financial reporting income will increase for these amounts; however, there will
be no associated taxable income for these amounts. As a consequence, the taxes
already paid on the amounts deferred represent an asset of PPD, and they are
categorized appropriately as deferred tax assets on the balance sheet.
d. The explanation for why the deferred tax effect of deferred costs shows up as a
liability is complementary to the explanation for deferred revenues in Part c.
above. When PPD pays costs for acquiring customers, they are able to deduct
these amounts. However, when these amounts are subsequently reported as
expenses for financial reporting purposes, income before taxes are reduced, yet
there is no associated deduction for tax reporting purposes; thus, taxable income
will be higher than income before taxes. Accordingly, these amounts represent
a future tax liability and are categorized as deferred tax liabilities.
220
Copyright © 2011 Cengage Learning. All Rights Reserved. May not be scanned, copied, or duplicated, in whole or in part, except
for use as permitted in a license distributed with a certain product or service or otherwise on a password-protected website for
classroom use.
download full file at
e.Accelerated depreciation deductions, all else equal, reduce current taxable income
and taxes payable. However, because total tax depreciation and financial
reporting depreciation will equal over the life of an asset, in future years when
straight-line depreciation exceeds accelerated depreciation, PPD will show
higher taxable income relative to financial reporting income. Accordingly, the
excess depreciation deductions already reported are associated with a deferred
tax liability.
f. Although the limited income tax footnote disclosures can provide only limited
insight into the overall reported growth and profitability (because there are
many other aspects of reported profitability than are revealed in the footnote),
certain items are suggestive. For example, a buildup in deferred tax liabilities
for property and equipment suggests that a company is continuing to make
investments in property and equipment, which generally occurs when managers
are bullish on future prospects. Similarly, a buildup in the deferred tax asset for
deferred revenues would indicate that the company is generating growth in
sales. For PPD, the deferred tax liability for property and equipment grew, but
the deferred tax asset for deferred revenue fell in 2008. Thus, these signals are
mixed. The greatest difficulty posed by deducing growth and profitability from
the income tax footnote for PPD is that a large component of the deferred tax
effects on its balance sheet reflects the mix of cash versus accrual mix of the
business. If PPD realizes an increase in the frequency of customers paying in
advance with cash relative to paying ratably, this could accompany an increase,
a decrease, or a flat pattern in sales. However, what the income tax footnote is
frequently useful for is quickly identifying accrual accounting differences from
cash flows. A quick glance at PPD’s tax footnote reveals that it (i) defers costs
of acquiring new customers and (ii) defers revenues. Given judgment often
required in such deferrals, analysts can use the tax footnote as a quick way to
identify possible accounting quality issues.
2.16 Interpreting Income Tax Disclosures.
a.Nike’s income before income taxes (also referred to as book income) exceeded
taxable income for 2007 because total income tax expense exceeded income
taxes currently payable (that is, $708.4 million income tax expense versus
$674.1 currently payable).
b. Opposite 2007, the taxable income for 2008 was higher than income before
taxes, made clear by the fact that income tax expense is approximately $300
million less than income taxes currently payable ($619.5 million versus $920.1
million). In addition, during 2008, Nike switched from a net deferred tax
liability position to a net deferred tax asset position, consistent with the
company paying a substantial sum for taxes relative to amounts currently
expensed.
download full file at
Chapter 2
Asset and Liability Valuation
and Income Measurement
c.The adjustment to net income to compute cash flow from operations will be a
subtraction because the cash payment is larger than income tax expense.
d. Nike recognizes an estimated expense or revenue reduction earlier for financial
reporting than for tax reporting. The delayed reduction in taxable income gives
rise to the payment of taxes in early years and a reduction in taxes in later years,
resulting in a deferred tax asset in between. The increasing deferred tax assets
for both sales returns and allowance for doubtful accounts indicate that Nike’s
sales grew each year (assuming a level mix of returns and allowances and
doubtful accounts estimates).
e.Nike recognizes deferred compensation expense earlier for financial reporting
than for tax reporting, giving rise to a future tax benefit that the firm will realize
when it actually pays out cash to employees in later years. The increase in the
deferred tax asset for deferred compensation suggests that Nike increase the
number of employees or the deferred compensation benefits.
f. The amount of the deferred tax asset for foreign loss carryforwards increased
significantly each year, suggesting that some foreign units continued to operate
at a net loss. Normally, an increase in such deferred tax assets would be
expected to trigger an increase in the valuation allowance as well. However, the
valuation allowance decreased slightly from 2007 to 2008. This indicates
Nike’s greater confidence that there is a reduced probability of not being able to
realize the benefits of these tax loss carryforwards, perhaps due to better
prospects of future profits that can be offset by tax loss carryforwards for tax
reporting purposes.
g. Apparently, when Nike acquired Umbro, it was able to deduct a large number of
these amounts currently, although for financial reporting, the company is
required to recognize intangible assets. The result is that Nike faces a deferred
tax liability for the amounts currently residing on the balance sheet as “expenses
waiting to happen.
h. Nike recognizes foreign-source income earlier for financial reporting than for
tax reporting, thereby delaying the payment of taxes and creating a deferred tax
liability in the meantime.
i. Some of Nike’s foreign units operate at a net loss, giving rise to a deferred tax
asset, while other units operate at a net profit, giving rise to a deferred tax
liability.
222
Copyright © 2011 Cengage Learning. All Rights Reserved. May not be scanned, copied, or duplicated, in whole or in part, except
for use as permitted in a license distributed with a certain product or service or otherwise on a password-protected website for
classroom use.
download full file at
2.17 Analyzing Transactions.
a.
Assets
Cash
=
Liabilities
+
+50,000
CC
Common Stock
and Paid-inCapital
+50,000
Shareholders' Equity
AOCI
Cash.....................................................................................
Common Stock and Paid-in-Capital...............................
RE
50,000
50,000
b.
Assets
Building
Cash
=
+35,000
–5,000
Liabilities
Note Payable
+
CC
Shareholders' Equity
AOCI
RE
+30,000
Building...............................................................................
Cash................................................................................
Note Payable...................................................................
35,000
5,000
30,000
c.
Assets
Inventory
=
+40,000
Liabilities
+
CC
Shareholders' Equity
AOCI
RE
Accounts Payable +40,000
Inventory.............................................................................
Accounts Payable...........................................................
40,000
40,000
d.
Assets
=
Liabilities
+
CC
Shareholders' Equity
AOCI
RE
Accounts
Receivable
+65,000
Sales
Inventory
–30,000
Cost of Goods Sold –30,000
Accounts Receivable...........................................................
Sales................................................................................
65,000
Cost of Goods Sold.............................................................
Inventory........................................................................
30,000
download full file at
+65,000
65,000
30,000
Chapter 2
Asset and Liability Valuation
and Income Measurement
e.
Assets
Cash
=
Liabilities
+
CC
–15,000
Shareholders' Equity
AOCI
RE
Compensation
Expense
Compensation Expense.......................................................
Cash................................................................................
–15,000
15,000
15,000
f.
Assets
Cash
Accounts
Receivable
=
Liabilities
+
CC
Shareholders' Equity
AOCI
RE
+45,000
–45,000
Cash.....................................................................................
Accounts Receivable......................................................
45,000
45,000
g.
Assets
Cash
=
–28,000
Liabilities
+
CC
Shareholders' Equity
AOCI
RE
Accounts Payable –28,000
Accounts Payable................................................................
Cash................................................................................
28,000
28,000
h.
Assets
Accumulated
Depreciation
=
Liabilities
+
CC
–7,000
Shareholders' Equity
AOCI
RE
Depreciation
Expense
Depreciation Expense.........................................................
Accumulated Depreciation.............................................
–7,000
7,000
7,000
i.
Assets
=
Liabilities
Wages Payable
+
CC
+4,000
Shareholders' Equity
AOCI
RE
Compensation
Expense
Compensation Expense.......................................................
Wages Payable................................................................
4,000
4,000
224
Copyright © 2011 Cengage Learning. All Rights Reserved. May not be scanned, copied, or duplicated, in whole or in part, except
for use as permitted in a license distributed with a certain product or service or otherwise on a password-protected website for
classroom use.
–4,000
download full file at
j.
Assets
=
Cash
+
Liabilities
CC
Shareholders' Equity
AOCI
–2,400
RE
Interest Expense
Interest Expense..................................................................
Cash................................................................................
–2,400
2,400
2,400
k.
Assets
=
Cash
–1,440
b
+
Liabilities
Deferred Tax
Liability
+1,200
c
CC
Shareholders' Equity
AOCI
Income Tax
Expense
Income Tax Expense...........................................................
Cash................................................................................
Deferred Tax Liability....................................................
2,640a
a
Sales.......................................................................................................
Cost of Goods Sold...............................................................................
Compensation Expense.........................................................................
Depreciation Expense............................................................................
Interest Expense....................................................................................
Income before Taxes...................................................................
Income Tax Expense...................................................................
b
Sales......................................................................................................
Cost of Goods Sold...............................................................................
Compensation Deduction......................................................................
Depreciation Deduction........................................................................
Interest Deduction.................................................................................
Taxable Income..........................................................................
Current Taxes Payable................................................................
c
$1,200 = $2,640 – $1,440
download full file at
RE
1,440b
1,200c
$ 65,000
30,000
15,000
4,000
7,000
2,400
$ 6,600
x 40%
$ 2,640
$ 65,000
30,000
15,000
4,000
10,000
2,400
$ 3,600
x 40%
$ 1,440
–2,640
a