Spatial modeling principles in earth sciences
Bạn đang xem bản rút gọn của tài liệu. Xem và tải ngay bản đầy đủ của tài liệu tại đây (14.28 MB, 424 trang )
Zekai Sen
Spatial Modeling
Principles in
Earth Sciences
Second Edition
Spatial Modeling Principles in Earth Sciences
ThiS is a FM Blank Page
Zekai Sen
Spatial Modeling Principles
in Earth Sciences
Second Edition
Zekai Sen
Faculty of Civil Engineering
Istanbul Technical University
Istanbul, Turkey
ISBN 978-3-319-41756-1
ISBN 978-3-319-41758-5
DOI 10.1007/978-3-319-41758-5
(eBook)
Library of Congress Control Number: 2016951726
1st edition: © Springer Science+Business Media B.V. 2009
© Springer International Publishing Switzerland 2016
This work is subject to copyright. All rights are reserved by the Publisher, whether the whole or part of
the material is concerned, specifically the rights of translation, reprinting, reuse of illustrations,
recitation, broadcasting, reproduction on microfilms or in any other physical way, and transmission
or information storage and retrieval, electronic adaptation, computer software, or by similar or
dissimilar methodology now known or hereafter developed.
The use of general descriptive names, registered names, trademarks, service marks, etc. in this
publication does not imply, even in the absence of a specific statement, that such names are exempt
from the relevant protective laws and regulations and therefore free for general use.
The publisher, the authors and the editors are safe to assume that the advice and information in this
book are believed to be true and accurate at the date of publication. Neither the publisher nor the
authors or the editors give a warranty, express or implied, with respect to the material contained
herein or for any errors or omissions that may have been made.
Printed on acid-free paper
This Springer imprint is published by Springer Nature
The registered company is Springer International Publishing AG Switzerland
Our earth is the only place where we can live
in harmony, peace, and cooperation for the
betterment of humanity. It is the duty of each
individual to try with utmost ambition to care
for the earth environmental issues so that a
sustainable future can be handed over to new
generations. This is possible only through the
scientific principles, where the earth systems
and sciences are the major branches.
This book is dedicated to those who care for
such a balance by logical, rational, scientific,
and ethical considerations for the sake of
other living creatures’ rights.
ThiS is a FM Blank Page
Preface
Earth systems and sciences cover a vast amount of disciplines that are effective in
the daily life of human beings. Among these are the atmospheric sciences, meteorology, hydrogeology, hydrology, petroleum geology, engineering geology, geophysics, and marine and planary systems. Their subtopics such as floods,
groundwater and surface water resources, droughts, rock fractures, and earthquakes
have basic measurements in the form of records of their past events and need to
have suitable models for their spatio-temporal predictions. There are various
software for the solution of problems related to earth systems and sciences
concerning the environment, but unfortunately they are ready-made models, most
often without any basic information. It is the main purpose of this book to present
the basic knowledge and information about the evolution of earth sciences events
on rational, logical, and at places scientific and philosophical features so that the
reader can grasp the underlying principles in a simple and applicable manner. The
book also directs the reader to proper basic references for further reading and
enlarging the background information. I have gained almost all of the field,
laboratory and theoretical as well actual applications, during my stay at the Faculty
of Earth Sciences, Hydrogeology Department, King Abdulaziz University (KAU),
and the Saudi Geological Survey (SGS), which are in Jeddah, Kingdom of Saudi
Arabia. Additionally, especially on the atmospheric sciences, meteorology and
surface water resources aspects are developed at Istanbul Technical University
¨ ), Turkey.
(I˙TU
It is well sought to adapt spatial modeling and simulation methodologies in
actual earth sciences problem solutions for exploring the inherent variability such
as in fracture frequencies, spacing, rock quality designation, grain size distribution,
groundwater exploration and quality variations, and many similar random behaviors of the rock and porous medium. The book includes many innovative spatial
modeling methodologies with actual application examples from real-life problems.
Most of such innovative approaches appear for the first time in this book with the
necessary interpretations and recommendations of their use in real life.
vii
viii
Preface
The second print of the book indicates the need for spatial modeling in earth
sciences. The book has an additional chapter and also some recent methodological
procedures in some chapters, which cannot be found in the first print. I wish that the
content will be beneficial to anyone interested in spatial earth system modeling and
simulation.
Throughout the first and this second edition preparation process, my wife Fatma
Hanim has encouraged me to think that such a work will be beneficial to all humans
in the world and those who are interested in the topics of this book. I appreciate the
encouragement by Springer Publishing Company for the second printing of
this book.
Istanbul, Turkey
18 May 2016
Zekai Sen
Contents
1
Introduction . . . . . . . . . . . . . . . . . . . . . . . . . . . . . . . . . . . . . . . . . . .
1.1
General . . . . . . . . . . . . . . . . . . . . . . . . . . . . . . . . . . . . . . . . . .
1.2
Earth Sciences Phenomena . . . . . . . . . . . . . . . . . . . . . . . . . . . .
1.3
Variability . . . . . . . . . . . . . . . . . . . . . . . . . . . . . . . . . . . . . . . .
1.3.1
Temporal . . . . . . . . . . . . . . . . . . . . . . . . . . . . . . . . . .
1.3.2
Point . . . . . . . . . . . . . . . . . . . . . . . . . . . . . . . . . . . . . .
1.3.3
Regional . . . . . . . . . . . . . . . . . . . . . . . . . . . . . . . . . . .
1.3.4
Spatial . . . . . . . . . . . . . . . . . . . . . . . . . . . . . . . . . . . . .
1.4
Determinism . . . . . . . . . . . . . . . . . . . . . . . . . . . . . . . . . . . . . .
1.5
Uncertainty . . . . . . . . . . . . . . . . . . . . . . . . . . . . . . . . . . . . . . .
1.5.1
Probabilistic . . . . . . . . . . . . . . . . . . . . . . . . . . . . . . . .
1.5.2
Statistical . . . . . . . . . . . . . . . . . . . . . . . . . . . . . . . . . .
1.5.3
Stochastic . . . . . . . . . . . . . . . . . . . . . . . . . . . . . . . . . .
1.5.4
Fuzzy . . . . . . . . . . . . . . . . . . . . . . . . . . . . . . . . . . . . .
1.5.5
Chaotic Uncertainty . . . . . . . . . . . . . . . . . . . . . . . . . . .
1.6
Random Field (RF) . . . . . . . . . . . . . . . . . . . . . . . . . . . . . . . . . .
References . . . . . . . . . . . . . . . . . . . . . . . . . . . . . . . . . . . . . . . . . . . . .
1
1
4
8
12
12
13
13
13
14
15
16
17
18
19
21
22
2
Sampling and Deterministic Modeling Methods . . . . . . . . . . . . . . . .
2.1
General . . . . . . . . . . . . . . . . . . . . . . . . . . . . . . . . . . . . . . . . . .
2.2
Observations . . . . . . . . . . . . . . . . . . . . . . . . . . . . . . . . . . . . . .
2.3
Sampling . . . . . . . . . . . . . . . . . . . . . . . . . . . . . . . . . . . . . . . . .
2.4
Numerical Data . . . . . . . . . . . . . . . . . . . . . . . . . . . . . . . . . . . .
2.5
Number of Data . . . . . . . . . . . . . . . . . . . . . . . . . . . . . . . . . . . .
2.5.1
Small Sample Length of Independent Models . . . . . . . .
2.5.2
Small Sample Length of Dependent Models . . . . . . . . .
2.6
Regional Representation . . . . . . . . . . . . . . . . . . . . . . . . . . . . . .
2.6.1
Variability Range . . . . . . . . . . . . . . . . . . . . . . . . . . . . .
2.6.2
Inverse Distance Models . . . . . . . . . . . . . . . . . . . . . . .
25
25
26
29
34
36
37
40
46
46
49
ix
x
3
4
Contents
2.7
Subareal Partition . . . . . . . . . . . . . . . . . . . . . . . . . . . . . . . . . .
2.7.1
Triangularization . . . . . . . . . . . . . . . . . . . . . . . . . . . .
2.8
Polygonizations . . . . . . . . . . . . . . . . . . . . . . . . . . . . . . . . . . .
2.8.1
Delaney, Varoni, and Thiessen Polygons . . . . . . . . . . .
2.8.2
Percentage-Weighted Polygon (PWP) Method . . . . . . .
2.9
Areal Coverage Probability . . . . . . . . . . . . . . . . . . . . . . . . . . .
2.9.1
Theoretical Treatment . . . . . . . . . . . . . . . . . . . . . . . .
2.9.2
Extreme Value Probabilities . . . . . . . . . . . . . . . . . . . .
2.10 Spatio-Temporal Drought Theory and Analysis . . . . . . . . . . . .
2.10.1 Drought Parameters . . . . . . . . . . . . . . . . . . . . . . . . . .
2.11 Spatio-Temporal Modeling . . . . . . . . . . . . . . . . . . . . . . . . . . .
References . . . . . . . . . . . . . . . . . . . . . . . . . . . . . . . . . . . . . . . . . . . .
.
.
.
.
.
.
.
.
.
.
.
.
51
51
55
57
59
71
73
76
77
80
84
95
Point and Temporal Uncertainty Modeling . . . . . . . . . . . . . . . . . .
3.1
General . . . . . . . . . . . . . . . . . . . . . . . . . . . . . . . . . . . . . . . . .
3.2
Regular Data Set . . . . . . . . . . . . . . . . . . . . . . . . . . . . . . . . . .
3.3
Irregular Data Set . . . . . . . . . . . . . . . . . . . . . . . . . . . . . . . . . .
3.4
Point Data Set Modeling . . . . . . . . . . . . . . . . . . . . . . . . . . . . .
3.4.1
Empirical Frequency Distribution Function . . . . . . . . .
3.4.2
Relative Frequency Definition . . . . . . . . . . . . . . . . . .
3.4.3
Classical Definition . . . . . . . . . . . . . . . . . . . . . . . . . .
3.4.4
Subjective Definition . . . . . . . . . . . . . . . . . . . . . . . . .
3.4.5
Empirical Cumulative Distribution Function . . . . . . . .
3.4.6
Histogram and Theoretical Probability Distribution
Function . . . . . . . . . . . . . . . . . . . . . . . . . . . . . . . . . .
3.4.7
Cumulative Probability Distribution Function . . . . . . .
3.4.8
Prediction Methods . . . . . . . . . . . . . . . . . . . . . . . . . .
3.5
Temporal Data Set Modeling . . . . . . . . . . . . . . . . . . . . . . . . .
3.5.1
Time Series Analysis . . . . . . . . . . . . . . . . . . . . . . . . .
3.6
Empirical Correlation Function . . . . . . . . . . . . . . . . . . . . . . . .
References . . . . . . . . . . . . . . . . . . . . . . . . . . . . . . . . . . . . . . . . . . . .
.
.
.
.
.
.
.
.
.
.
97
97
99
99
100
100
100
101
101
105
.
.
.
.
.
.
.
106
112
113
116
116
124
127
Classical Spatial Variation Models . . . . . . . . . . . . . . . . . . . . . . . . . .
4.1
General . . . . . . . . . . . . . . . . . . . . . . . . . . . . . . . . . . . . . . . . . .
4.2
Spatiotemporal Characteristics . . . . . . . . . . . . . . . . . . . . . . . . .
4.3
Spatial Pattern Search . . . . . . . . . . . . . . . . . . . . . . . . . . . . . . . .
4.4
Simple Uniformity Test . . . . . . . . . . . . . . . . . . . . . . . . . . . . . .
4.5
Random Field . . . . . . . . . . . . . . . . . . . . . . . . . . . . . . . . . . . . . .
4.6
Cluster Sampling . . . . . . . . . . . . . . . . . . . . . . . . . . . . . . . . . . .
4.7
Nearest Neighbor Analysis . . . . . . . . . . . . . . . . . . . . . . . . . . . .
4.8
Search Algorithms . . . . . . . . . . . . . . . . . . . . . . . . . . . . . . . . . .
4.8.1
Geometric Weighting Functions . . . . . . . . . . . . . . . . . .
4.9
Trend Surface Analysis . . . . . . . . . . . . . . . . . . . . . . . . . . . . . . .
4.9.1
Trend Model Parameter Estimations . . . . . . . . . . . . . . .
129
129
130
131
138
141
145
146
148
150
153
155
Contents
xi
4.10
Multisite Kalman Filter (KF) Methodology . . . . . . . . . . . . . . .
4.10.1 1D KF . . . . . . . . . . . . . . . . . . . . . . . . . . . . . . . . . . . .
4.10.2 KF Application . . . . . . . . . . . . . . . . . . . . . . . . . . . . .
References . . . . . . . . . . . . . . . . . . . . . . . . . . . . . . . . . . . . . . . . . . . .
.
.
.
.
159
160
163
175
5
Spatial Dependence Measures . . . . . . . . . . . . . . . . . . . . . . . . . . . . .
5.1
General . . . . . . . . . . . . . . . . . . . . . . . . . . . . . . . . . . . . . . . . .
5.2
Isotropy, Anisotropy, and Homogeneity . . . . . . . . . . . . . . . . . .
5.3
Spatial Dependence Function (SDF) . . . . . . . . . . . . . . . . . . . .
5.4
Spatial Correlation Function (SCF) . . . . . . . . . . . . . . . . . . . . .
5.4.1
Correlation Coefficient Drawback . . . . . . . . . . . . . . . .
5.5
Semivariogram (SV) Regional Dependence Measure . . . . . . . .
5.5.1
SV Philosophy . . . . . . . . . . . . . . . . . . . . . . . . . . . . . .
5.5.2
SV Definition . . . . . . . . . . . . . . . . . . . . . . . . . . . . . .
5.5.3
SV Limitations . . . . . . . . . . . . . . . . . . . . . . . . . . . . .
5.6
Sample SV . . . . . . . . . . . . . . . . . . . . . . . . . . . . . . . . . . . . . . .
5.7
Theoretical SV . . . . . . . . . . . . . . . . . . . . . . . . . . . . . . . . . . . .
5.7.1
Simple Nugget SV . . . . . . . . . . . . . . . . . . . . . . . . . . .
5.7.2
Linear SV . . . . . . . . . . . . . . . . . . . . . . . . . . . . . . . . .
5.7.3
Exponential SV . . . . . . . . . . . . . . . . . . . . . . . . . . . . .
5.7.4
Gaussian SV . . . . . . . . . . . . . . . . . . . . . . . . . . . . . . .
5.7.5
Quadratic SV . . . . . . . . . . . . . . . . . . . . . . . . . . . . . . .
5.7.6
Rational Quadratic SV . . . . . . . . . . . . . . . . . . . . . . . .
5.7.7
Power SV . . . . . . . . . . . . . . . . . . . . . . . . . . . . . . . . .
5.7.8
Wave (Hole Effect) SV . . . . . . . . . . . . . . . . . . . . . . .
5.7.9
Spherical SV . . . . . . . . . . . . . . . . . . . . . . . . . . . . . . .
5.7.10 Logarithmic SV . . . . . . . . . . . . . . . . . . . . . . . . . . . . .
5.8
Cumulative Semivariogram (CSV) . . . . . . . . . . . . . . . . . . . . .
5.8.1
Sample CSV . . . . . . . . . . . . . . . . . . . . . . . . . . . . . . .
5.8.2
Theoretical CSV Models . . . . . . . . . . . . . . . . . . . . . .
5.9
Point Cumulative Semivariogram (PCSV) . . . . . . . . . . . . . . . .
5.10 Spatial Dependence Function (SDF) . . . . . . . . . . . . . . . . . . . .
References . . . . . . . . . . . . . . . . . . . . . . . . . . . . . . . . . . . . . . . . . . . .
.
.
.
.
.
.
.
.
.
.
.
.
.
.
.
.
.
.
.
.
.
.
.
.
.
.
.
.
177
177
179
182
185
186
190
190
195
199
201
203
207
208
210
210
211
212
212
213
215
215
216
219
220
227
236
250
6
Spatial Modeling . . . . . . . . . . . . . . . . . . . . . . . . . . . . . . . . . . . . . . . .
6.1
General . . . . . . . . . . . . . . . . . . . . . . . . . . . . . . . . . . . . . . . . . .
6.2
Spatial Estimation of ReV . . . . . . . . . . . . . . . . . . . . . . . . . . . . .
6.3
Optimum Interpolation Model (OIM) . . . . . . . . . . . . . . . . . . . . .
6.3.1
Data and Application . . . . . . . . . . . . . . . . . . . . . . . . . .
6.4
Geostatistical Analysis . . . . . . . . . . . . . . . . . . . . . . . . . . . . . . .
6.4.1
Kriging Technique . . . . . . . . . . . . . . . . . . . . . . . . . . . .
6.5
Geostatistical Estimator (Kriging) . . . . . . . . . . . . . . . . . . . . . . .
6.5.1
Kriging Methodologies and Advantages . . . . . . . . . . . .
6.6
Simple Kriging (SK) . . . . . . . . . . . . . . . . . . . . . . . . . . . . . . . . .
6.7
Ordinary Kriging (OK) . . . . . . . . . . . . . . . . . . . . . . . . . . . . . . .
253
254
255
257
262
275
276
279
281
284
291
xii
Contents
6.8
Universal Kriging (UK) . . . . . . . . . . . . . . . . . . . . . . . . . . . . .
6.9
Block Kriging (BK) . . . . . . . . . . . . . . . . . . . . . . . . . . . . . . . .
6.10 Triple Diagram Model (TDM) . . . . . . . . . . . . . . . . . . . . . . . . .
6.11 Regional Rainfall Pattern Description . . . . . . . . . . . . . . . . . . .
References . . . . . . . . . . . . . . . . . . . . . . . . . . . . . . . . . . . . . . . . . . . .
7
.
.
.
.
.
297
301
302
309
326
Spatial Simulation . . . . . . . . . . . . . . . . . . . . . . . . . . . . . . . . . . . . . . .
7.1
General . . . . . . . . . . . . . . . . . . . . . . . . . . . . . . . . . . . . . . . . . .
7.2
3D Autoregressive Model . . . . . . . . . . . . . . . . . . . . . . . . . . . . .
7.2.1
Parameter Estimation . . . . . . . . . . . . . . . . . . . . . . . . . .
7.2.2
2D Uniform Model Parameters . . . . . . . . . . . . . . . . . . .
7.2.3
Extension to 3D . . . . . . . . . . . . . . . . . . . . . . . . . . . . . .
7.3
Rock Quality Designation (RQD) Simulation . . . . . . . . . . . . . . .
7.3.1
Independent Intact Lengths . . . . . . . . . . . . . . . . . . . . . .
7.3.2
Dependent Intact Lengths . . . . . . . . . . . . . . . . . . . . . . .
7.4
RQD and Correlated Intact Length Simulation . . . . . . . . . . . . . .
7.4.1
Proposed Models of Persistence . . . . . . . . . . . . . . . . . .
7.4.2
Simulation of Intact Lengths . . . . . . . . . . . . . . . . . . . .
7.5
Autorun Simulation of Porous Material . . . . . . . . . . . . . . . . . . .
7.5.1
Line Characteristic Function of Porous Medium . . . . . .
7.5.2
Autorun Analysis of Sandstone . . . . . . . . . . . . . . . . . . .
7.5.3
Autorun Modeling of Porous Media . . . . . . . . . . . . . . .
7.6
CSV Technique for Identification of Intact Length Correlation
Structure . . . . . . . . . . . . . . . . . . . . . . . . . . . . . . . . . . . . . . . . .
7.6.1
Intact Length CSV . . . . . . . . . . . . . . . . . . . . . . . . . . . .
7.6.2
Theoretical CSV Model . . . . . . . . . . . . . . . . . . . . . . . .
7.7
Multi-directional RQD Simulation . . . . . . . . . . . . . . . . . . . . . . .
7.7.1
Fracture Network Model . . . . . . . . . . . . . . . . . . . . . . .
7.7.2
RQD Analysis . . . . . . . . . . . . . . . . . . . . . . . . . . . . . . .
7.7.3
RQD Simulation Results . . . . . . . . . . . . . . . . . . . . . . .
References . . . . . . . . . . . . . . . . . . . . . . . . . . . . . . . . . . . . . . . . . . . . .
329
330
331
332
335
339
339
340
347
358
361
364
369
370
371
375
381
383
384
393
394
395
397
401
Index . . . . . . . . . . . . . . . . . . . . . . . . . . . . . . . . . . . . . . . . . . . . . . . . . . . 405
Chapter 1
Introduction
Abstract Earth science events have spatial, temporal and spatio-temporal variabilities depending on the scale and the purpose of the assessments. Various earth
sciences branches such as hydrogeology, engineering geology, petroleum geology,
geophysics, and related topics have, in general, spatio-temporal variabilities that
need for effective modeling techniques for proper estimation and planning the
future events in each branch according to scientific principles. Determinism and
especially uncertainty techniques are frequently used in the description and modeling these events conveniently through simple and rather complicated computer
software. However, the basic principles in any software require simple and effective mathematical, probabilistic, statistical, stochastic and recently fuzzy methodologies or their combination for an objective solution of the problem based on field
or laboratory data. This chapter provides comparetive and simple explanation of
each one of these approaches.
Keywords Earth sciences • Model • Randomness • Probability • Random field •
Statistics • Stochastic • Variability
1.1
General
There has been a good deal of discussion and curiosity about the natural
event occurrences during the last century. These discussions have included comparisons between uncertainty in earth and atmospheric sciences and uncertainty
in physics which has, inevitably it seems, led to the question of determinism
and indeterminism in nature (Leopold and Langbein 1963; Krauskopf 1968;
Mann 1970).
At the very core of scientific theories lies the notion of “cause” and “effect”
relationship in an absolute certainty in scientific studies. One of the modern
philosophers of science, Popper (1957), stated that “to give a causal explanation
of a certain specific event means deducing a statement describing this event from
two kinds of premises: from some universal laws, and from some singular or
specific statements which we may call the specific initial conditions.” According
to him there must be a very special kind of connection between the premises and the
conclusions of a causal explanation, and it must be deductive. In this manner, the
© Springer International Publishing Switzerland 2016
Z. Sen, Spatial Modeling Principles in Earth Sciences,
DOI 10.1007/978-3-319-41758-5_1
1
2
1 Introduction
conclusion follows necessarily from the premises. Prior to any mathematical
formulation, the premises and the conclusion consist of verbal (linguistic) statements. It is necessary to justify at every step of deductive argument by citing a
logical rule that is concerned with the relationship among statements. On the other
hand, the concept of “law” lies at the heart of deductive explanation and, therefore,
at the heart of the certainty of our knowledge about specific events.
Recently, the scientific evolution of the methodologies has shown that the more
the researchers try to clarify the boundaries of their domain of interest, the more
they become blurred with other domains of research. For instance, as the hydrogeologist tries to model the groundwater pollution as one of the modern nuisances of
humanity as far as the water resources are concerned, they need information about
the geological environment of the aquifers, meteorological and atmospheric conditions for the groundwater recharge, and social and human settlement environmental issues for the pollution sources. Hence, many common philosophies, logical
basic deductions, methodologies, and approaches become common to different
disciplines, and the data processing is among the most important topics which
include the same methodologies applicable to diversity of disciplines. The way
that earth, environmental, and atmospheric scientists frame their questions varies
enormously, but the solution algorithms may include the same or at least similar
procedures. Some of the common questions that may be asked by various research
groups are summarized as follows. Most of these questions have been explained by
Johnston (1989).
Any natural phenomenon or its similitude occurs extensively over a region, and
therefore, its recordings or observations at different locations pose some questions
such as, for instance, are there relationships between phenomena in various locations? In such a question, the time is as if it is frozen and the phenomenon
concerned is investigated over the area and its behavioral occurrence between the
locations. An answer to this question may be provided descriptively in linguistic,
subjective, and vague terms which may be understood even by nonspecialists in the
discipline. However, their quantification necessitates objective methodologies
which are one of the purposes of the context in this book. Another question that
may be stated right at the beginning of the research in the earth, environmental, and
atmospheric sciences is: are places different in terms of the phenomena present
there? Such questions are the source of many people’s interest in the subject.
Our minds are preconditioned on the Euclidian geometry, and consequently
ordinary human beings are bound to think in 3D spaces as length, width, and
depth in addition to the time as the fourth dimension. Hence, all the scientific
formulations, differential equations, and others include space and time variabilities.
All the earth, environmental, and atmospheric variables vary along these four
dimensions. If their changes along the time are not considered, then it is said to
be frozen in time, and therefore a steady situation remains along the time axis but
variable in concern has variations along the space. A good example for such a
change can be considered as geological events which do not change with human life
time span. Iron content of a rock mass varies rather randomly from one point to
another within the rock and hence spatial variation is considered. Another example
1.1 General
3
is the measurement of rainfall amounts at many irregularly located meteorology
stations spread over an area, i.e., simultaneous measurement of rainfall amounts;
again the time is frozen and the spatial variation is sought.
On the other hand, there are timewise variations which are referred to as the
temporal variations in the natural phenomenon. For such a variation, it suffices to
measure the event at a given location which is the case in any meteorology station.
Depending on the time evolution of the event whether it is continuous or not, time
series records can be obtained. A time series is the systematic measurement of any
natural event along the time axis at regular time intervals. Depending on this time
interval, time series is called as hourly, daily, weekly, monthly, or yearly time
series. Contrary to time variations, it is not possible to consider space series where
the records are kept at regular distances except in very specific cases. For example,
if water samples along a river are taken at every 1 km, then the measurements
provide a distance series in the regularity sense. In fact, distance series are very
limited as if there are no such data sequences. On the other hand, depending on the
interest of event, there are series which include time data, but they are not time
series due to irregularity or randomness in the time intervals between successive
occurrences of the same event. Flood and drought occurrences in hydrology
correspond to such cases. One cannot know the duration of floods or droughts.
Likewise, in meteorology the occurrence of precipitation or any dangerous levels of
concentrations of air pollutants all do not have time series characteristics.
Any natural event evolves in the 4D human visualization domains, and consequently its records should involve the characteristics of both time and space
variabilities. Any record that has this property is referred to as the spatiotemporal
variation.
Mathematical, statistical, probabilistic, stochastic, and alike procedures are
applicable only in the case of spatial or temporal variability in natural or artificial
phenomena. It is not possible to consider any approach of earth sciences phenomena without the variability property, which is encountered everywhere almost
explicitly but at times and places also implicitly. Explicit variability is the main
source of reasoning, but implicit variability leads to thousands of imagination with
different geometrical shapes on which one is then able to ponder and generate ideas
and conclusions. It is possible to sum up that the variability is one of the fundamental ingredients of philosophic thinking, which can be separated into different
rational components by mental restrictions based on the logic. Almost all social,
physical, economical, and natural events in small scales and phenomena in large
scales include variability at different levels (micro, meso, or macro) and types
(geometry, kinematics, and dynamics). Hence, the very word “variability” deserves
detailed qualitative understanding for the construction of our future quantitative
models.
Proper understanding of earth sciences phenomenon is itself incomplete, rather
vague, and cannot provide a unique or precise answer. However, in the case of data
availability, the statistical methods support the phenomenon understanding and
deducing meaningful and rational results. These methods suggest the way to weight
the available data so as to compute best estimates and predictions with acceptable
4
1 Introduction
error limits. Unfortunately statistics and use of its methods are taken as cookbook
procedures without fundamental rational background in problem solving. There are
many software programs available to use, but the results cannot be interpreted in a
meaningful, plausible, and rational manner for the service of practical applications
or further researches.
It is, therefore, the purpose of this book to provide fundamentals, logical basis,
and insights into spatial statistical techniques that are frequently used in engineering applications and scientific research works. In this manner prior to cookbook
procedure applications and software use, the professional can give his expert view
about the phenomenon concerned and the treatment alternatives of the available
data. The major problems in the spatial analysis are the point estimation from a set
of data sampling points where the measurements are not found, areal average
calculations and contour mapping of the regionalized variables. The main purpose
of this chapter is to lay out the basic spatial variability ingredients, their simple
conceptual grasp and models.
1.2
Earth Sciences Phenomena
The phenomenologic occurrences in earth sciences are natural events, and their
prediction and control need scientific methodological approaches under the domain
of uncertainty and risk conceptions in cases of design for mitigation against their
dangerous consequences and inflictions on the society at large. The common
features of these phenomena in general are their rather random behaviors in
amounts, occurrence time and location, duration, intensity, and spatial coverages.
Although future average behaviors are taken as a basis in any design, it is
recommended in this book that risk concept at 5 or 10 % must be taken into
consideration and accordingly the necessary design structures must be implemented
for reduction of dangerous occurrences and impacts. The necessary scientific
algorithms, models, procedures, programs, seminars, and methodologies and if
possible a comprehensive software must be prepared for effective, speedy, and
timely precautions. Earth sciences hazards must be assessed logically, conceptually, and numerically by an efficient monitoring system and following data treatments. In various chapters of this book, different methodological data-processing
procedures are presented with factual data applications.
Earth sciences deal with spatial and temporal behaviors of natural phenomena at
every scale for the purpose of predicting the future replicas of the similar phenomena which help to make significant decisions in planning, management, operation,
and maintenance of natural occurrences related to social, environmental, and
engineering activities. Since any of these phenomena cannot be accounted by
measurements which involve uncertain behaviors, their analysis, control, and
prediction need to use uncertainty techniques for significant achievements for
future characteristic estimations. Many natural phenomena cannot be monitored
at desired instances of time and locations in space, and such restrictive time and
1.2 Earth Sciences Phenomena
5
location limitations bring additional irregularity in the measurements. Consequently, the analyst, in addition to uncertain temporal and spatial occurrences,
has the problem of sampling the natural phenomenon at irregular sites and times.
For instance, floods, earthquakes, car accidents, illnesses, and fracture occurrences
are all among the irregularly distributed temporal and spatial events. Uncertainty
and irregularity are the common properties of natural phenomenon measurements
in earth and atmospheric researches, but the analytical solutions through numerical
approximations all require regularly available initial and boundary conditions that
cannot be obtained by lying regular measurement sites or time instances. In an
uncertain environment, any cause will be associated with different effects each with
different levels of possibilities. Herein, possibility means some preference index for
the occurrence of each effect. The greater the possibility index, the more frequent
the event occurrence.
Geology, hydrology, and meteorology are the sciences of lithosphere, hydrosphere, and atmosphere that consist of different rock, water, and air layers, their
occurrences, distribution, physical and chemical genesis, mechanical properties,
and structural constitutions and interrelationships. It is also one of the significant
subjects of these phenomena to deal with historical evolution of rock, water, and
atmosphere types and masses concerning their positions, movement, and internal
contents. These features indicate the wide content of earth sciences studies. Unfortunately, these phenomena cannot be simulated under laboratory conditions, and
therefore, field observations and measurements are the basic information sources of
information.
In large scales, geological, hydrological, and meteorological compositions are
very anisotropic and heterogeneous; in small scales, their homogeneity and isotropy
increase but the practical representatively decreases. It is therefore necessary to
study them in rather medium scales that can be assumable as homogeneous and
isotropic. In any phenomenon study, the general procedure is to have its behavioral
features and properties at small locations and by correlation to generalize to larger
scales. Unfortunately, most often the description of earth sciences phenomena
provides linguistic and verbal qualitative interpretations that are most often subjective and depend on the common consensus. The more the contribution to such
consensus of experts, the better are the conclusions and interpretations, but even
then it is not possible to estimate or derive general conclusions on an objective
basis. It is, therefore, necessary to try and increase the effect of quantitative
approaches and methodologies in earth sciences, especially by the use of personal
computers, which help to minimize the calculation procedures and time requirements by software. However, software programs are attractive in appearance and
usage, but without fundamental handling of procedures and methodologies, the
results from these programs cannot be done properly with useful interpretations and
satisfactory calculations that are acceptable by common expertise. This is one of the
very sensitive issues that are mostly missing in software program training or ready
software uses.
It is advised in this book that without knowing the fundamentals of earth
sciences procedure, methodology, or data processing, one must avoid the use of
6
1 Introduction
software programs. Otherwise, mechanical learning of software from colleagues
and friends or during tutorials with missing fundamentals does not lead the user to
write proper reports or even to discuss the results of software with somebody expert
in the area who may not know software use.
Phenomena in earth sciences are of multitude types, and each needs at times
special interpretation, but whatever the differences, there is one common basis,
which is the data processing. Hence, any earth sciences equipped with proper dataprocessing technique with fundamentals can help others and make significant
contributions to open literature, which is of great need for such interpretations.
Besides, whatever the techniques and technological level reached, these phenomena show especially spatial (length, area, volume) differences at many scales, areas,
locations, and depths, and consequently, development of any technique cannot
cover the whole of these variations simultaneously, and there is always an empty
space for further interpretations and researches. It is possible to consider the earth
sciences all over the world in two categories, namely, conventionalists that are
more descriptive working group with linguistic and verbal interpretations, and
conclusions with very basic and simple calculations. The second group includes
those who are well equipped with advanced quantitative techniques starting with
simple probabilistic, statistical, stochastic, and deterministic mathematical models
and calculation principles. The latter group might be very addicted to quantitative
approaches with little linguistic, verbal, i.e., qualitative interpretations. The view
taken in this book remains in between where the earth scientist should not ignore the
verbal and linguistic descriptive information or conclusions, but he also looks for
quantitative interpretation techniques to support the views and arrive at general
conclusions. Unfortunately, most often earth scientists are within these two
extremes and sometimes cannot understand each other although the same phenomena are considered. Both views are necessary but not exclusively. The best conclusions are possible with a good combination of two views. However, the priority is
always with the linguistic and verbal descriptions, because in scientific training,
these are the first stones of learning and their logical combinations rationalistically
constitute quantitative descriptions. Even during the quantitative studies, the interpretations are based on descriptive, qualitative, linguistic, and verbal statements. It
is well known in scientific arena that the basic information is in the forms of logical
sentences, postulates, definitions, or theorems, and in earth sciences, even speculations might be proposed prior to quantitative studies, and the objectivity increases
with shifting toward quantitative interpretations.
Any geological phenomenon can be viewed initially without detailed information to have the following general characteristics:
1. It does not change with time or at least within the lifetime of human, and
therefore, geological variations have spatial characters, and these variations
can be presented in the best possible way by convenient maps. For example,
geological description leads to lithological variation of different rock types. In
this simplest classification of rocks, the researcher is not able to look for
different possibilities or ore reserves, water sources, oil field possibilities, etc.
1.2 Earth Sciences Phenomena
7
Oil reserves cannot be in igneous or metamorphic rock units, and therefore,
he/she has to restrict the attention on the areas of sedimentary rocks. It is possible
to look for regions of groundwater, which is in connection with atmosphere, i.e.,
the rainfall leads to direct infiltration. This information implies shallow groundwater possibilities, and consequently quaternary sediments (wadi alluviums of
present epoch geological activity) can be delimited from such a map.
2. Geological units are neither uniform nor isotropic nor heterogeneous in horizontal and vertical extends. A first glance on any geological map indicates
obviously that in any direction (NS, EW, etc.) the geological variation is not
constant. There is the succession of different rock types and subunits along the
vertical direction than is referred to as stratigraphic along which neither the
thickness of each unit nor the slope is constant. It is possible to conclude from
these two points that the spatial geometry of geological phenomena is not
definite, and furthermore, its description is not possible with Euclidean geometry
which is based on lines, planes, and volumes of regular shapes. However, in
practical calculations, the geometric dimensions are simplified so as to use
Euclidean representations and make simple calculations. Otherwise, just the
geometry can be intangible, hindering calculations. This indicates that in calculations besides other earth sciences quantities that will be mentioned later in this
book, initially geometry causes approximations in the calculations, and in any
calculation, geometry is involved. One can conclude from this statement that
even if the other spatial variations are constant, approximation in geometry gives
rise to approximate results. It is very convenient to mention here that the only
definite Euclidean geometry exists at rock crystalline elements. However, their
accumulation leads to irregular geometry that is not expressible by classical
geometry.
3. Rock materials are not isotropic and heterogeneous even at small scales of few
centimeters except at crystalline or atomic levels. Hence, the compositional
variation within the geometrical boundaries differs from one point to another,
which makes the quantitative appreciation almost impossible. In order to
alleviate the situation mentally, researchers visualize an ideal world by simplifications leading to the features as isotropic and homogeneous.
4. Isotropy implies uniformity along any direction, i.e., directional property constancy. The homogeneity means constancy of any property at each point. These
properties can be satisfied in artificial material produced by man, but natural
material such as rocks and any natural phenomenon in hydrology and meteorology cannot have these properties in the absolute sense. However, provided that
the directional or pointwise variations are not very appreciably different from
each other, then the geological medium can be considered as homogeneous and
isotropic on the average. In this last sentence, the word “average” is the most
widely used parameter in quantitative descriptions, but there are many other
averages that are used in the earth sciences evaluations. If there is not any
specification with this world, then it will imply arithmetic average. Arithmetic
average does not attach any weight or priority to any point or direction, i.e., it is
an equal-weight average.
8
1 Introduction
5. It can be concluded from the previous points that spatial variations cannot be
deterministic in the sense of isotropy and homogeneity, and therefore, they can
be considered as nondeterministic which implies uncertainty, and in turn it
means that the spatial assessments and calculations cannot be adopted as the
final crisp value. At this stage, rather than well-founded deterministic mathematical rules of calculation and evaluation, it is possible to deal with spatial
assessments and evaluations by uncertainty calculations, which are probability,
statistical, and stochastic processes.
6. Apart from the geometry and material features, the earth sciences event media
also includes in a nondeterministic way tectonic effects such as fissures, fractures, faults, folds, or chemical solution cavities, which appear rather randomly.
It is a scientific truth that the earth sciences phenomena cannot be studied with
deterministic methodologies for meaningful and useful interpretations or applications. The nondeterministic, i.e., uncertainty, techniques such as probability,
statistical, and stochastic methodologies are more suitable for the reflection of
any spatial behavior.
1.3
Variability
Variability in earth sciences implies irregularities, randomness, and uncertainty,
which cannot be predicted with certainty, and always there is a certain level of
error involved such as practically acceptable Æ5 % or Æ10 % levels. These levels
are also considered as risk amounts in any earth sciences design such as in
engineering geology, hydrogeology, and geophysical event evaluation and atmospheric, hydrologic, and environmental scientific and engineering projects. The
natural phenomena includes variability with uncertainty component.
Variability is a word that reflects different connotations that are commonly used
in everyday life, but unfortunately without noticing its epistemological content. For
instance, this word implies inequality, irregularity, heterogeneity, fluctuations,
randomness, statistical variability, probability, stochasticity, and chaos. Since science is concerned with materialistic world, variability property can be in time or
space (points, lines, areas, and volumes). Uncertainty is concerned with the haphazard variations in nature.
Earth, environmental, and atmospheric phenomena evolve with time and space,
and their appreciation as to the occurrence, magnitude, and location is possible by
observations and still better by measurements along the time or space reference
systems. The basic information about the phenomenon is obtained from the measurements. Any measurement can be considered as the trace of the phenomenon at a
given time and location. Hence, any measurement should be specified by time and
location, but its magnitude is not at the hand of the researcher. Initial observance of
the phenomenon leads to nonnumerical form of descriptive data that cannot be
evaluated with uncertainty.
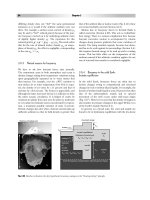
1.3 Variability
Fig. 1.1 Data variation by
(a) time, (b) space
9
a
Data
Time
b
*A
*B
*C
*D
*F
*E
0
10 km
The worth of data in earth sciences and geology is very high since most of the
interpretations and decisions are based on their qualitative and quantitative information contents. This information is hidden in representative field samples which
are analyzed for extraction of numerical or descriptive characteristics. These
characteristics are referred to as data. Data collection in earth sciences is difficult
and expensive and requires special care for accurately representing the geological
phenomenon. After all, various parameters necessary for the description and
modeling of the geological event, such as bearing capacity, fracture frequency,
aperture, orientation, effective strength, porosity, hydraulic conductivity, chemical
contents, etc., are hidden within each sample, but they individually represent a
specific point in space and time. Hence, it is possible to attach with data temporal
and three spatial reference systems as shown in Fig. 1.1.
In geological sciences and applications, the concerned phenomenon can be
examined and assessed through the collection of field data and accordingly meaningful solutions can be proposed. It is, therefore, necessary to make the best use of
available data from different points. Geological data are collected either directly in
the field or field samples are transferred to laboratories in order to make necessary
analysis and measurements. For instance, in hydrogeology domain among field
measurements are the groundwater table elevations, pH, and total dissolved solution (TDS) readings, whereas some of the laboratory measurements are chemical
elements in parts per million (ppm), etc. There are also office calculations that yield
also hydrogeological data such as hydraulic conductivity, transmissivity, and storage coefficients. In the meantime, many other data sources from soil surveys,
topographic measurements, geological prospection, remote sensing evaluations,
10
1 Introduction
Data
Systematic
Trend
Random
Time
Fig. 1.2 Systematic (trend, seasonality) and unsystematic (random) components
and others may also support data for the investigation concerned. The common
property of these measurements and calculations of laboratory analysis is that they
include uncertainty attached at a particular time and sampling point only. Hence,
the first question is how to deal with rather uncertain (randomly) varying data. At
times, the data is random, sometimes, chaotic, and still in other cases irregular or
very regular. These changes can be categorized into two broad classes as systematic
and unsystematic. Systematic data yields mathematically depictable variations with
time, space, or both. For instance, as the depth increases, so does the temperature
and this variation is an example of systematic variation. Especially, if there is only
one type of geological formation, this systematic variation becomes more pronounced. Otherwise, on the basis of rather systematic variation on the average,
there are unsystematic deviations which might be irregular or random. Systematic
and unsystematic data components are shown in Fig. 1.2.
In many studies, the systematic changes (seasonality and trend) are referred to as
the deterministic components, which are due to systematic natural (geography,
astronomy, climatology) factors that are explainable to a certain extent. On the
other hand, unsystematic variations are unexplainable or have random parts that
need more probabilistic and statistical treatments.
There has been a good deal of discussion and curiosity about the natural
event occurrences during the last century. These discussions have included comparisons between uncertainty in earth and atmospheric sciences and uncertainty
in physics, which has, inevitably it seems, led to the question of determinism
and indeterminism in nature (Leopold and Langbein 1963; Krauskopf 1968;
Mann 1970).
At the very core of scientific theories lies the notion of “cause” and “effect”
relationships in an absolute certainty in scientific studies. One of the modern
philosophers of science, Popper (1957), stated that
to give a causal explanation of a certain specific event means deducing a statement
describing this event from two kinds of premises: from some universal laws and from
some singular or specific statements which we may call the specific initial conditions
According to him there must be a very special kind of connections between the
premises and the conclusions of a causal explanation, and it must be deductive. In
this manner, the conclusion follows necessarily from the premises. Prior to any
1.3 Variability
11
mathematical formulation, the premises and the conclusion consist of verbal (linguistic) statements (Ross 1995; S¸en 2010). It is necessary to justify at every step of
deductive argument by citing a logical rule that is concerned with the relationship
among causes and results. On the other hand, the concept of “law” lies at the heart
of deductive explanation and, therefore, at the heart of the certainty of our knowledge about specific events.
Recently, the scientific evolution of the methodologies has shown that the more
the researchers try to clarify the boundaries of their domain of interest, the more
they become blurred with other domains of research. For instance, as the hydrogeologist tries to model the groundwater pollution as one of the modern nuisances of
humanity, as far as the water resources are concerned, they need information about
the geological environment of the aquifers, meteorological and atmospheric conditions for the groundwater recharge, and social and human settlement environmental issues for the pollution sources. Hence, many common philosophies, logical
basic deductions, methodologies, and approaches become common to different
disciplines, and uncertainty data processing is among the most important topics,
which include the same methodologies applicable to diversity of disciplines. The
way that earth, environmental, and atmospheric scientists frame their questions
varies enormously, but the solution algorithms may include the same or at least
similar procedures.
Any natural phenomenon or its similitude occurs extensively over a region, and
therefore, its recordings (measurements) or observations at different locations
pose some questions such as, for instance, are there relationships between phenomena in various locations? In such a question, the time is as if it is frozen, and
the phenomenon concerned is investigated over the area and its behavioral
occurrence between the locations. Frozen time considerations of any earth sciences events expose the spatial variability of the phenomenon concerned. An
answer to this question may be provided descriptively in linguistic, subjective,
and vague terms, which may be understood even by nonspecialists in the discipline. However, their quantification necessitates objective methodologies, which
are one of the purposes of the context in this book. Another question that may be
stated right at the beginning of the research in the earth, environmental, and
atmospheric sciences is that are places different in terms of the phenomena
present there? Such questions provide interest to researchers in the subject of
spatial variability.
On the other hand, there are timewise variations, which are referred to as the
temporal variations in natural phenomena. For such a variation, it suffices to
measure the event at a given location, which is the case in any meteorology station
or groundwater and petroleum well.
Any natural event evolves in the 4D human visualization domains, and consequently, its records should involve the characteristics of both time and space
variabilities. Any record that has this property is referred to as to have spatiotemporal variation.
12
1.3.1
1 Introduction
Temporal
Most of the natural phenomena and events take place with time, and hence, they
leave time traces that are recordable by convenient instruments. Astronomic
events have systematic time variations in regular diurnal, monthly, seasonal,
and annual time steps, and these recorded traces appear in the form of time series
or a set of time measurements. Depending on the time evolution of the event
whether it is continuous or not, time series records can be obtained. A time series
is the systematic measurement of any natural event along the time axis at regular
time intervals. Depending on this time interval, time series is called as hourly,
daily, weekly, monthly, or yearly time series. It is not possible to consider space
series at regular distances and the records are kept at irregular locations except in
very specific cases. For example, if water samples along a river are taken at every
1 km, then the measurements provide a distance series in the regularity sense.
Such series are very limited as if there are no such data sequences in practical
works.
On the other hand, depending on the interest of event, there are series along time
axis but they are not time series due to irregularity or randomness in the time
intervals between successive occurrences of the same event. Flood and drought
occurrences in hydrology correspond to such cases. One cannot know the duration
of floods or droughts. Likewise, in meteorology the occurrence instances of precipitation or any dangerous levels of concentrations such as air pollutants do not
have regular time series characteristics.
1.3.2
Point
In earth sciences, records at a set of locations concerning any variable provide
information of variability at the fixed point. For instance, at a single point, one can
measure different variables, say, for instance, in the engineering geological studies,
one can obtain the porosity, specific yield, failure resistance, friction angle, grain
sizes, and alike measurements. In hydrogeology, taken water sample from a well
may have different anions (Ca, Mg, K, Na) and cations (Cl, SO4, CO3, HCO3), all of
which provide specification of water quality collectively at a point. Point records
are very important for regional and spatial assessments of earth sciences variable so
as to obtain information about the behavior of the same variable at unmeasured
sites. The soil specification as for the porosity, shear strength, Atterberg limits
(shrinkage plastic and liquid), water content, compression strength, etc. is also
among the point measurements that are useful in many geological, engineering,
scientific, and agricultural activities.