Tools for high performance computing 2015
Bạn đang xem bản rút gọn của tài liệu. Xem và tải ngay bản đầy đủ của tài liệu tại đây (6.94 MB, 184 trang )
Andreas Knüpfer · Tobias Hilbrich
Christoph Niethammer · José Gracia
Wolfgang E. Nagel · Michael M. Resch
Editors
Tools for
High Performance
Computing
2015
123
Tools for High Performance Computing 2015
Andreas Knüpfer Tobias Hilbrich
Christoph Niethammer José Gracia
Wolfgang E. Nagel Michael M. Resch
•
•
•
Editors
Tools for High Performance
Computing 2015
Proceedings of the 9th International
Workshop on Parallel Tools
for High Performance Computing,
September 2015, Dresden, Germany
123
Editors
Andreas Knüpfer
Zentrum für Informationsdienste und
Hochleistungsrechnen (ZIH)
Technische Universität Dresden
Dresden
Germany
Tobias Hilbrich
Zentrum für Informationsdienste und
Hochleistungsrechnen (ZIH)
Technische Universität Dresden
Dresden
Germany
Christoph Niethammer
Höchstleistungszentrum Stuttgart (HLRS)
Universität Stuttgart
Stuttgart
Germany
José Gracia
Höchstleistungszentrum Stuttgart (HLRS)
Universität Stuttgart
Stuttgart
Germany
Wolfgang E. Nagel
Zentrum für Informationsdienste und
Hochleistungsrechnen (ZIH)
Technische Universität Dresden
Dresden
Germany
Michael M. Resch
Höchstleistungszentrum Stuttgart (HLRS)
Universität Stuttgart
Stuttgart
Germany
Cover front figure: OpenFOAM Large Eddy Simulations of dimethyl ether combustion with growing
resolutions of 1.3 million elements, 10 million elements, and 100 million elements from left to right
reveal how more computing power produces more realistic results. Courtesy of Sebastian Popp,
Prof. Christian Hasse, TU Bergakademie Freiberg, Germany.
ISBN 978-3-319-39588-3
DOI 10.1007/978-3-319-39589-0
ISBN 978-3-319-39589-0
(eBook)
Library of Congress Control Number: 2016941316
Mathematics Subject Classification (2010): 68U20
© Springer International Publishing Switzerland 2016
This work is subject to copyright. All rights are reserved by the Publisher, whether the whole or part
of the material is concerned, specifically the rights of translation, reprinting, reuse of illustrations,
recitation, broadcasting, reproduction on microfilms or in any other physical way, and transmission
or information storage and retrieval, electronic adaptation, computer software, or by similar or dissimilar
methodology now known or hereafter developed.
The use of general descriptive names, registered names, trademarks, service marks, etc. in this
publication does not imply, even in the absence of a specific statement, that such names are exempt from
the relevant protective laws and regulations and therefore free for general use.
The publisher, the authors and the editors are safe to assume that the advice and information in this
book are believed to be true and accurate at the date of publication. Neither the publisher nor the
authors or the editors give a warranty, express or implied, with respect to the material contained herein or
for any errors or omissions that may have been made.
Printed on acid-free paper
This Springer imprint is published by Springer Nature
The registered company is Springer International Publishing AG Switzerland
Preface
Highest-scale parallel computing remains a challenging task that offers huge
potentials and benefits for science and society. At the same time, it requires deep
understanding of the computational matters and specialized software in order to use
it effectively and efficiently.
Maybe the most prominent challenge nowadays, on the hardware side, is
heterogeneity in High Performance Computing (HPC) architectures. This inflicts
challenges on the software side. First, it adds complexity for parallel programming,
because one parallelization model is not enough; rather two or three need to be
combined. And second, portability and especially performance portability are at
risk. Developers need to decide which architectures they want to support.
Development or effort decisions can exclude certain architectures. Also, developers
need to consider specific performance tuning for their target hardware architecture,
which may cause performance penalties on others. Yet, avoiding architecture
specific optimizations altogether is also a performance loss, compared to a single
specific optimization. As the last resort, one can maintain a set of specific variants
of the same code. This is unsatisfactory in terms of software development and it
multiplies the necessary effort for testing, debugging, performance analysis, tuning,
etc. Other challenges in HPC remain relevant such as reliability, energy efficiency,
or reproducibility.
Dedicated software tools are still important parts of the HPC software landscape
to relieve or solve today’s challenges. Even though a tool is by definition not a part
of an application, but rather a supplemental piece of software, it can make a
fundamental difference during the development of an application. This starts with a
debugger that makes it possible (or just more convenient and quicker) to detect a
critical mistake. And it goes all the way to performance analysis tools that help to
speed up or scale up the application, potentially resolving system effects that could
not be understood without the tool. Software tools in HPC face their own challenges. In addition to the general challenges mentioned above there is the bootstrap
challenge—tools should be there early when a new hardware architecture is
v
vi
Preface
introduced or an unprecedented scalability level is reached. Yet, there are no tools
to help the tools to get there.
Since the previous workshop in this series, there have been interesting developments for stable and reliable tools as well as tool frameworks. Also there are new
approaches and experimental tools that are still under research. Both kinds are very
valuable for a software ecosystem, of course. In addition, there are greatly appreciated verification activities for existing tools components. And there are valuable
standardization efforts for tools interfaces in parallel programming abstractions.
The 9th International Parallel Tools Workshop in Dresden in September 2015
included all those topics. In addition, there was a special session about user
experiences with tools including a panel discussion. And as an outreach to another
community of computation intensive science there was a session about Big Data
algorithms. The contributions presented there are interesting in two ways. First as
target applications for HPC tools. And second as interesting methods that may be
employed in the HPC tools.
This book contains the contributed papers to the presentations at the workshop in
September 2015.1 As in the previous years, the workshop was organized jointly
between the Center of Information Services and High Performance Computing
(ZIH)2 and the High Performance Computing Center (HLRS).3
Dresden, Germany
January 2016
1
/> />3
.
2
Andreas Knüpfer
Tobias Hilbrich
Christoph Niethammer
José Gracia
Wolfgang E. Nagel
Michael M. Resch
Contents
1
2
Dyninst and MRNet: Foundational Infrastructure
for Parallel Tools . . . . . . . . . . . . . . . . . . . . . . . . . . . . . . . . . . . . .
William R. Williams, Xiaozhu Meng, Benjamin Welton
and Barton P. Miller
Validation of Hardware Events for Successful Performance
Pattern Identification in High Performance Computing . . . . . . . . .
Thomas Röhl, Jan Eitzinger, Georg Hager and Gerhard Wellein
1
17
3
Performance Optimization for the Trinity RNA-Seq Assembler . . .
Michael Wagner, Ben Fulton and Robert Henschel
29
4
Power Management and Event Verification in PAPI . . . . . . . . . . .
Heike Jagode, Asim YarKhan, Anthony Danalis and Jack Dongarra
41
5
Gleaming the Cube: Online Performance Analysis
and Visualization Using MALP . . . . . . . . . . . . . . . . . . . . . . . . . .
Jean-Baptiste Besnard, Allen D. Malony, Sameer Shende,
Marc Pérache and Julien Jaeger
6
7
8
Evaluation of Tool Interface Standards for Performance
Analysis of OpenACC and OpenMP Programs . . . . . . . . . . . . . . .
Robert Dietrich, Ronny Tschüter, Tim Cramer, Guido Juckeland
and Andreas Knüpfer
Extending MUST to Check Hybrid-Parallel Programs for
Correctness Using the OpenMP Tools Interface. . . . . . . . . . . . . . .
Tim Cramer, Felix Münchhalfen, Christian Terboven, Tobias Hilbrich
and Matthias S. Müller
53
67
85
Event Flow Graphs for MPI Performance Monitoring
and Analysis . . . . . . . . . . . . . . . . . . . . . . . . . . . . . . . . . . . . . . . . 103
Xavier Aguilar, Karl Fürlinger and Erwin Laure
vii
viii
9
Contents
Aura: A Flexible Dataflow Engine for Scalable
Data Processing . . . . . . . . . . . . . . . . . . . . . . . . . . . . . . . . . . . . . . 117
Tobias Herb, Lauritz Thamsen, Thomas Renner and Odej Kao
10 Parallel Code Analysis in HPC User Support . . . . . . . . . . . . . . . . 127
Rene Sitt, Alexandra Feith and Dörte C. Sternel
11 PARCOACH Extension for Hybrid Applications
with Interprocedural Analysis . . . . . . . . . . . . . . . . . . . . . . . . . . . 135
Emmanuelle Saillard, Hugo Brunie, Patrick Carribault
and Denis Barthou
12 Enabling Model-Centric Debugging for Task-Based
Programming Models—A Tasking Control Interface . . . . . . . . . . . 147
Mathias Nachtmann and José Gracia
13 Evaluating Out-of-Order Engine Limitations Using
Uop Flow Simulation . . . . . . . . . . . . . . . . . . . . . . . . . . . . . . . . . . 161
Vincent Palomares, David C. Wong, David J. Kuck
and William Jalby
Chapter 1
Dyninst and MRNet: Foundational
Infrastructure for Parallel Tools
William R. Williams, Xiaozhu Meng, Benjamin Welton
and Barton P. Miller
Abstract Parallel tools require common pieces of infrastructure: the ability to
control, monitor, and instrument programs, and the ability to massively scale these
operations as the application program being studied scales. The Paradyn Project has a
long history of developing new technologies in these two areas and producing readyto-use tool kits that embody these technologies: Dyninst, which provides binary
program control, instrumentation, and modification, and MRNet, which provides a
scalable and extensible infrastructure to simplify the construction of massively parallel tools, middleware and applications. We will discuss new techniques that we
have developed in these areas, and present examples of current use of these tool kits
in a variety of tool and middleware projects. In addition, we will discuss features in
these tool kits that have not yet been fully exploited in parallel tool development,
and that could lead to advancements in parallel tools.
1.1 Introduction
Parallel tools require common pieces of infrastructure: the ability to control, monitor,
and instrument programs, and the ability to massively scale these operations as the
application program being studied scales. The Paradyn Project has a long history
of developing new technologies in these two areas and producing ready-to-use tool
kits that embody these technologies. One of these tool kits is Dyninst, which provides binary program control, instrumentation, and modification. When we initially
designed Dyninst, our goal was to provide a platform-independent binary instrumentation platform that captured only the necessary complexities of binary code.
We believe that the breadth of tools using Dyninst, and the breadth of Dyninst components that they use, reflects how well we have adhered to these guiding principles.
We discuss the structure and features of Dyninst in Sect. 1.2.
Another tool kit we have developed is MRNet, which provides a scalable and
extensible infrastructure to simplify the construction of massively parallel tools,
W.R. Williams (B) · X. Meng · B. Welton · B.P. Miller
University of Wisconsin, 1210 W. Dayton St., Madison, WI 53706, USA
e-mail:
© Springer International Publishing Switzerland 2016
A. Knüpfer et al. (eds.), Tools for High Performance Computing 2015,
DOI 10.1007/978-3-319-39589-0_1
1
2
W.R. Williams et al.
middleware and applications. MRNet was designed from the beginning to be a flexible and scalable piece of infrastructure for a wide variety of tools. It has been applied
to data aggregation, command and control, and even to the implementation of distributed filesystems. MRNet provides the scalability foundation for several critical
pieces of debugging software. We discuss the features of MRNet in Sect. 1.3.
We discuss common problems in scalable tool development that our tool kits
have been used to solve in the domains of performance analysis (Sect. 1.4) and
debugging (Sect. 1.5). These problems include providing control flow context for an
address in the binary, providing local variable locations and values that are valid at an
address in the binary, collecting execution and stack traces, aggregating trace data,
and dynamically instrumenting a binary in response to newly collected information.
We also discuss several usage scenarios of our tool kits in binary analysis
(Sect. 1.6) and binary modification (Sect. 1.7) applications. Analysis applications
of our tools (Fig. 1.3) include enhancing debugging information to provide a more
accurate mapping of memory and register locations to local variables, improved
analysis of indirect branches, and improved detection of function entry points that
lack symbol information. Applications of our tools for binary modification include
instruction replacement, control flow graph modification, and stack layout modification. Some of these analysis and modification applications have already proven
useful in high-performance computing. We conclude (Sect. 1.8) with a summary of
future plans for development.
1.2 DyninstAPI and Components
DyninstAPI provides an interface for binary instrumentation, modification, and
control, operating both on running processes and on binary files (executables and
libraries) on disk. Its fundamental abstractions are points, specifying where to instrument, and snippets, specifying what instrumentation should do. Dyninst provides
platform-independent abstractions representing many aspects of processes and binaries, including address spaces, functions, variables, basic blocks, control flow edges,
binary files and their component modules.
Points are specified in terms of the control flow graph (CFG) of a binary. This
provides a natural description of locations that programmers understand, such as
function entry/exit, loop entry/exit, basic block boundaries, call sites, and control
flow edges. Previous work, including earlier versions of Dyninst [7], specified instrumentation locations by instruction addresses or by control flow transfers. Bernat and
Miller [5] provide a detailed argument why, in general, instrumentation before or after
an instruction, or instrumentation on a control transfer, does not accurately capture
certain important locations in the program. In particular, it is difficult to characterize
points related to functions or loops by using only addresses or control transfers.
1 Dyninst and MRNet: Foundational Infrastructure for Parallel Tools
3
Snippets are specified in a platform-independent abstract syntax tree language [7].
The platform-independent nature of the instrumentation specification allows Dyninstbased tools (mutators) to, in most cases, be written once and run on any supported
platform.
To instrument a binary, extra space must be provided in the code for the instrumentation code. This space may be created by relocating some or all of the original
code in order to provide room for instrumentation. The instrumentation and associated program code may be positioned so that the instrumentation executes inline
with its program context or out-of-line from its context. Bernat and Miller [5] determined that, given current processor characteristics, relocating whole functions and
generating their associated instrumentation inline minimizes overhead by improving
instruction cache coherence compared to other approaches.
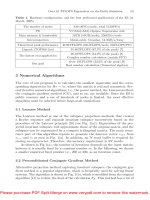
Dyninst has been deconstructed into several component libraries [24], each performing some aspect of binary instrumentation, analysis, or control (Fig. 1.1). As we
will see, many of these components are commonly used in various smaller subsets
for common tasks in parallel tool design. As a benefit of creating smaller components, each of these components deals with a much smaller amount of platform
variation than Dyninst. For example, while Dyninst supports a wide variety of architectures and operating systems, the SymtabAPI component is concerned primarily
with the details of binary file formats. This allows us to largely simplify SymtabAPI
to handling ELF and PE files correctly, with small and well-defined architecture and
Fig. 1.1 Dyninst and its
component libraries
BPatch
PatchAPI
CodeGen
Stackwalker
ProcControl
ParseAPI
InstructionAPI
SymtabAPI
Legend
Analysis
Components
Instrumentation
Components
4
W.R. Williams et al.
operating system specific subcomponents. The Dyninst components include tools
for analyzing and interpreting binaries, interacting with processes, and modifying
binaries and inserting instrumentation. The analysis and interpretation components
include SymtabAPI, which provides a format-independent representation of binary
files and debugging information; InstructionAPI, which disassembles instructions;
ParseAPI, which constructs control flow graphs; and DataflowAPI, which contains
a selection of data flow analysis algorithms used inside Dyninst. StackwalkerAPI
and ProcControlAPI, respectively, collect stack traces from processes and control
processes and threads via the debug interface of the operating system. PatchAPI,
CodeGen, DynC, and DyninstAPI itself collectively provide the point-snippet interface used by instrumentation, the interfaces for control flow modification, and a
C-like wrapper language to generate snippet construction code. The components
and their supported platforms are listed in Table 1.1.
Table 1.1 Dyninst components and their capabilities
Component
Description
SymtabAPI
InstructionAPI
ParseAPI
DataflowAPI
StackwalkerAPI
ProcControlAPI
PatchAPI
CodeGen
DynC
Reads symbol tables and debugging
information
Decodes instructions to an operation
and operand ASTs
Constructs control flow graphs
Performs data flow analyses:
slicing, register liveness, stack
analysis, symbolic evaluation
Collects call stacks
Supported platforms
ELF, PE
x86, x86_64, PowerPC32,
PowerPC64
x86, x86_64, PowerPC32,
PowerPC64
x86, x86_64, PowerPC32,
PowerPC64
Linux, Windows, x86, x86_64,
PowerPC32, PowerPC64, ARMv8
Provides a platform-independent
Linux, Windows, x86, x86_64,
layer on top of the operating system PowerPC32, PowerPC64, ARMv8
debug interface
Provides a point of indirection to
x86, x86_64, PowerPC32,
represent transformations to a
PowerPC64
control flow graph
Generates code for instrumentation x86, x86_64, PowerPC32,
snippets and code to ensure those
PowerPC64
snippets do not interfere with the
original program
Provides a C-like language for
x86, x86_64, PowerPC32,
specifying instrumentation snippets PowerPC64
1 Dyninst and MRNet: Foundational Infrastructure for Parallel Tools
5
1.3 MRNet
Scalable computation is an important challenge, whether you are building applications, tools, or large scale distributed systems. The challenge of scale requires
that developers for distributed systems select computational patterns that have the
properties that allow for scaling and the expressiveness to apply to a broad range of
problems. Tree-based Overlay Networks (TBONs) are an ideal method of parallelizing computation supplying a scalable communication pattern that can express the
solution to a wide range of distributed computation problems. TBONs connect a set
of processes into a tree layout where leaf nodes perform the bulk processing work,
internal tree processes perform aggregation/multicasting of results out of the tree,
and a single front end process which aggregates results to produce a single output.
Scalability is achieved with TBONs by use of aggregation and multicast filters to
reduce data moving through the tree.
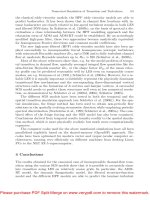
The Multicast Reduction Network (MRNet) [26] is a framework that implements
the TBON model to provide scalable communication to distributed system developers. MRNet handles the creation and connection of processes into a tree network
layout. MRNet assigns each process a role as a frontend (FE), communication (CP),
or backend (BE) process, as shown in Fig. 1.2. The size of the tree and layout of
Fig. 1.2 The layout of a MRNet tree and its various components
6
W.R. Williams et al.
processes can be modified by users without modifying the program, allowing a single
codebase to scale from one process to millions. Users can supply custom aggregation
and multicast filters to MRNet. The MRNet framework has been used extensively
to build highly scalable tools and applications that are in use on leadership class
machines [2, 3, 28].
1.4 Performance Tools
Performance tools collect and interpret information about how a program uses various system resources, such as CPU, memory, and networks. There are two notable
categories of performance tools where Dyninst components have been used as part
of these tasks: sampling tools and tracing tools. Figures 1.3 and 1.4 illustrate how
performance tools may use Dyninst and its components in both analysis and instrumentation contexts.
1.4.1 Sampling Tools
Sampling tools periodically observe some aspect of program behavior and record
these observations. One common form of sampling is call-stack sampling, which
collects a set of program counter (PC) values and return address (RA) values that
comprise the call stack of an executing thread. From these addresses in the program’s
code segment, one may derive a variety of further context:
• Binary file
• Source file
• Function
Fig. 1.3 Tools using
Dyninst’s binary analysis
components
NAPA
HPCToolkit
Open|SpeedShop
ParseAPI
InstructionAPI
SymtabAPI
Legend
External tools
Dyninst and MRNet
components
1 Dyninst and MRNet: Foundational Infrastructure for Parallel Tools
CRAFT
COBI
Extrae
BPatch
PatchAPI
TAU
STAT
Stackwalker
SystemTap
ATP
CCDB
7
DySectAPI
TotalView
MRNet
Legend
External tools
Dyninst and MRNet
components
Fig. 1.4 Tools using Dyninst’s instrumentation, monitoring, and debugging components
• Source line
• Loop
• Basic block
HPCToolkit [1] and Open|SpeedShop [29] both use SymtabAPI and ParseAPI
to determine this contextual information from the addresses in a call stack. Reconstructing both the full source-level calling context (including inline functions) and
the loop nesting context (including irreducible loops) from a call stack provides users
with additional insight into where their code suffers from performance problems.
1.4.2 Tracing Tools
Tracing may be performed at function, basic block, memory reference, or instruction
granularities. It captures records of events as they occur in the program. Many wellknown performance tools collect or analyze tracing data. In particular, COBI [23],
Tau [31], and Extrae [20] can use Dyninst’s binary rewriting functionality in order
to insert instrumentation that produces tracing data.
Instrumentation-based tracing relies on the insertion of instrumentation at the various points where trace data is to be collected. This instrumentation may be inserted
as source code, during the compilation and linking process, through modification of
the binary once it has been linked, or at run time. Instrumentation that occurs at any
point up to and including the linking process we describe as source instrumentation;
instrumentation that occurs afterward we describe as binary instrumentation. Dyninst
and its components are concerned with binary instrumentation.
Binary instrumentation relies on the ability to understand and manipulate binary
code without access to authoritative source code or compiler intermediate representations. It is necessarily a more difficult process than source instrumentation, but
8
W.R. Williams et al.
comes with compensating advantages. First, if a user wishes to dynamically modify the set of events that they are recording based on the data they have collected,
it is necessary to insert or remove instrumentation at run time. In the subset of
cases where the user already knows what instrumentation they would wish to insert
prior to run time, this capability can be emulated at the source level by selectively
enabling and disabling instrumentation execution, but binary instrumentation allows
arbitrary instrumentation to be inserted at arbitrary points in response to observed
events. Second, binary instrumentation can be inserted without recompiling a program. Particularly in cases where a user wishes to instrument a small portion of a
large application, this can provide a significant time savings. Third, while source
instrumenters have been improving their ability to avoid perturbing the resulting
binary, they are not perfect in this respect. Binary instrumentation, of course, also
perturbs the resulting binary, but its starting ground truth is precisely the binary that
the compiler would generate without instrumentation.
In addition to tracing control flow events, the Dyninst interface allows users to perform tracing of a wide variety of memory operations: tracking allocations and deallocations, instrumenting memory accesses, and observing the effective addresses
and byte counts they affect. As with all forms of fine-grained (instruction level)
instrumentation, the overhead imposed by observing and recording every memory
access is quite high in most cases. It is consequently common in our experience for
users to develop specialized tools for memory tracing to diagnose particular performance problems. We hope that broader exposure of the Dyninst memory instrumentation features will lead to more general-purpose memory instrumentation tools
being developed, both for performance analysis and for debugging.
1.5 Debugging Tools
In addition to analyzing the performance of parallel software, it is often necessary to
debug it. The combination of certain Dyninst components with MRNet has proven
to be a potent combination for developing lightweight tools for identifying bugs at
extremely large scales.
1.5.1 Stack Trace Aggregation
A basic and useful approach to developing highly scalable debugging tools is stack
trace aggregation: collecting stack traces from all of the threads and processes in a
large parallel program, and merging them into a call stack prefix tree. Examples of this
approach include Stack Trace Analysis Tool (STAT) [3] from Lawrence Livermore
National Laboratories (LLNL) and Cray’s Abnormal Termination Processing (ATP)
tool [9]. Each of these tools uses StackwalkerAPI to collect call stacks. Users of the
1 Dyninst and MRNet: Foundational Infrastructure for Parallel Tools
9
tools may collect local variable information and function contexts, as in Sect. 1.4.1,
using SymtabAPI and potentially also ParseAPI. MRNet is then used by these tools
to aggregate the stack traces in a scalable manner into a call stack prefix tree. STAT
and ATP differ in their intended use cases; STAT is often used to debug hangs and
stalls, whereas ATP is specifically focused on debugging crashes.
STAT has been successfully used to detect a wide variety of problems in both software and hardware. It has detected bugs in the LUSTRE filesystem, slow decrementors on particular processor cores resulting in 1,000,000x slowdowns in sleep(),
and numerous bugs in application code as well [17]. STAT has collected call stacks
from the entire Sequoia supercomputer (approximately 750,000 cores), and has collected call stacks from approximately 200k cores in under a second [19]. ATP is a
standard part of Cray’s Linux distribution [9], and is automatically invoked whenever
an appropriately launched application crashes.
1.5.2 Distributed Debuggers with MRNet
MRNet has also been used as infrastructure for providing scalable control of existing
full-featured debugging tools. The TotalView debugger has employed MRNet as a
distributed process control layer [22], as has Cray’s CCDB debugger.
TotalView is a high performance parallel debugger developed by Roguewave
capable of debugging and profiling applications running on large node counts. With
Totalview, application developers can perform wide range of debugging and profiling
tasks such as setting breakpoints, reading and writing memory locations and registers,
and single stepping through an application. MRNet is used by Totalview to scale
these operations across an application running on thousands of nodes. A tree based
overlay network is constructed between the application processes running on nodes
and a frontend process that controls debugging and profiling operations. The frontend
presents a user with a graphical representation of the current state of a running
distributed application. A user can then issue commands (such as setting a breakpoint)
that are passed through the overlay network down to application processes where
they are executed. TotalView uses aggregation filters to reduce the volume of data
generated by application processes so that a snapshot of the current state of a running
application can be presented to the developer. Multicast filters are used by TotalView
to broadcast commands down to individual nodes.
The Scalable Parallel Debugging Library [16] (SPDL), which provides a generic
parallel debugging interface on top of MRNet and Eclipse SCI [8], has been used
to extend Cray’s CCDB debugger to larger scales [10]. SPDL provides comparable
infrastructure to the TotalView implementation described above. CCDB, using this
infrastructure, demonstrates command latency of less than a second at scales up to
32,000 processes.
10
W.R. Williams et al.
1.5.3 Dynamic Instrumentation for Debugging
For some debugging problems, stack traces are insufficient, and the programmer
requires knowledge of how the current point of execution was reached. This is an
area where dynamic instrumentation can be applied in at least two ways: as a method
for generating automated equivalents of typical interactive debugging commands,
and as a method for generating debugging traces that precisely capture interesting
behavior. We consider an example of each of these applications.
DySectAPI [15] builds on the foundation of STAT, and attempts to provide the
ability to script gdb-like query and process control operations: breakpoints, probe
points, conditional breakpoints and watchpoints, and access to registers and variables.
Much of this functionality can be exposed with only trivial extensions to STAT (for
instance, allowing the user to write to local variables as well as reading them); some,
however, requires significantly more of the Dyninst component stack. In particular,
the execution of an arbitrary remote procedure call requires some form of code
generation.
SystemTap [12] is a kernel instrumentation and tracing tool developed by RedHat
that uses Dyninst instrumentation to extend its capabilities to user space. The current
SystemTap model is mostly oriented towards instrumentation specified statically, as
it must support the compilation of scripts to kernel modules. For those cases where
it is performing instrumentation that appears to be dynamic, that appearance is in
most cases granted through conditional execution. SystemTap does allow scripts to
invoke arbitrary system commands; we believe that special handling of the recursive
invocation of SystemTap itself through dynamic instrumentation would increase the
power of this idiom.
1.6 Analysis Tools
Improving the understanding of a binary’s behavior can allow other tools to perform
their tasks better. We present a data flow analysis use case, where slicing is used to
improve the understanding of local variable access, and a control flow analysis use
case, where accurate understanding of the CFG of a binary allows more efficient and
accurate instrumentation within Dyninst itself.
1.6.1 Slicing
Slicing [33] is a data flow analysis that determines which instructions affect (backwards slicing) or are affected by (forwards slicing) the value of a given abstract location (register or memory location) at a given instruction. The DataflowAPI includes
1 Dyninst and MRNet: Foundational Infrastructure for Parallel Tools
11
a slicing implementation that refines this concept to consider not just instructions,
but assignments within those instructions.
The NAPA tool, currently under development at LLNL, uses DataflowAPI’s slicer
in an effort to improve the ability of tools to match individual load and store instructions with their corresponding variables. In principle, debugging information such
as DWARF [11] should contain sufficient information that all such memory accesses
can be resolved. In practice, for many data structures, this is not the case. For example, while the debugging information may contain one of the ways to refer to a
location within an aggregate, the actual load or store will use a different alias to the
same location. Applying a backwards slicing analysis to the load or store, searching
through the containing function until the effective address being accessed has been
derived from some set of local variables, improves the input data to further analyses,
such as blame assignment [27].
1.6.2 Binary Parsing
The goal of parsing a binary is to represent the binary with code constructs that are
familiar to programmers, including CFGs, functions, loops and basic blocks. These
code constructs are the foundations for performing a data flow analysis, such as
slicing (Sect. 1.6.1), and specifying instrumentation points, such as instrumenting at
the entry of a function or at the exit of a loop.
Algorithms to recover these code constructs from binaries are encapsulated in
ParseAPI. ParseAPI uses recursive traversal parsing [30] to construct basic blocks,
determine function boundaries, and build CFGs. It starts from known entry points
such as the program entry point and function entry points from symbol tables and follows the control flow transfers to build the CFG and identify more entry points. Not
all code will necessarily be found by recursive traversal alone; this leaves gaps [14] in
the binary where code may be present, but has not yet been identified. Furthermore,
recursive traversal does not explicitly address the problem of how to resolve control
flow targets in non-trivial cases, such as indirect branches. If these challenges are
not handled properly, the parser would miss real code, have inaccurate CFGs, and
observe degrading qualities of data flow analysis, binary instrumentation, and binary
modification. We describe our new techniques for resolving jump tables, which represent a well-defined subset of indirect branches, and for gap parsing, which improves
our parsing coverage for stripped binaries.
Jump tables are commonly used to implement switch statements and loop
unrolling optimizations and they often represent intraprocedural control transfers.
Because of Dyninst’s function-based relocation approach (Sect. 1.2), it is necessary
to safely overapproximate the potential targets of an indirect branch to relocate a
function. This means that we must ensure that our understanding of a function’s
structure does not miss any code, and our understanding of its basic blocks does not
ignore any block boundaries. In practical terms, this means that our analysis of an
12
W.R. Williams et al.
indirect branch must contain a proper superset of the true targets of that branch, or we
will be unable to safely relocate and instrument the function containing the indirect
branch.
We implemented a new slicing-based data flow analysis [21] to improve our
handling of jump tables, relying on the following two key characterizations of jump
tables: (1) jump table entries are contiguous and reside in read-only memory regions;
(2) the jump target depends on a single bounded input value, which often corresponds
to the switch variable in a switch statement. Our analysis is able to handle several
variations of jump tables that appear in real software: (1) the table contents can be
either jump target addresses or offsets relative to a base address; (2) the table location
can be either explicitly encoded in instructions or computed; (3) the input value can
be bounded through conditional jumps or computation; (4) arbitrary levels of tables
involved in address calculation, where prior level tables are used to index into later
level tables.
Our evaluations show that the new analysis can reduce the number of uninstrumentable functions in glibc by 30 % with a 20 % increase in parse overhead and
reduce 7 % uninstrumentable functions in normal binaries with a 5 % increase in
parse overhead.
Stripped binaries are significantly more difficult to analyze because when no function entry points are present, it is not easy to decide which addresses to start the control
flow traversal. Recent research has used machine learning based approaches to learn
code features such as instruction sequences [4, 25] or raw byte sequences [32] for
identifying function entry points. Dyninst 9.0 uses Rosenblum et al’s approach [25] to
select instruction sequences from a set of training binaries and assigns each selected
instruction sequence a weight to represent the probability that an address is a function
entry point if the sequence is matched at the address. We scan through the binary
searching for addresses where the probability that the address is a function entry
point is greater than a configurable threshold. For each address where this is true,
we then apply Dyninst’s recursive traversal implementation, analyzing the function
implied by this entry point and all of its callees to reduce the size of the gaps that
must be scanned. Note that if we have identified a function entry point with some
probability p, every one of its call targets must be a function entry point with probability q ≥ p. Thus, all of the function entry points generated by this approach will
be true function entry points with p ≥ t for a threshold t.
We compared the abilities of two versions of Dyninst to identify function entry
points in stripped binaries. Dyninst 8.2.1 uses a few manually-designed instruction
patterns and Dyninst 9.0 uses the machine learning approach to train its model. The
test binaries are from binutils, coreutils, and findutils, built with ICC and GCC, at
-O0 to -O3. The test results are summarized in Table 1.2. Precision, in this case, is
the percentage of function entry points identified by Dyninst that are real function
entry points; recall is the percentage of real function entry points identified as such.
We make two observations about these results. First, we see that the machine
learning approach dramatically increases the recall in both 32-bit and 64-bit binaries,
at the cost of some precision. This means that ParseAPI can discover much more code
in gaps, with some of the discovered code being not real code. Second, the results
1 Dyninst and MRNet: Foundational Infrastructure for Parallel Tools
Table 1.2 Gap parsing test results
Version
Platform
Manually-designed
patterns (8.2.1)
Manually-designed
patterns (8.2.1)
Machine
learning-derived
idioms (9.0)
Machine
learning-derived
idioms (9.0)
13
Average precision (%) Average recall (%)
64-bit x86
98.1
37.4
32-bit x86
95.6
53.9
64-bit x86
94.7
83.2
32-bit x86
97.1
93.8
show that 64-bit function entry points are more difficult to identify. Our examination
of the rules generated for Dyninst 9.0 suggests that the increased size of the register
set and the consequent decreased need to use the stack for parameter passing and
temporary space are largely responsible for this increased difficulty.
1.7 Modification Tools
In addition to performing instrumentation, where the behavior of the original binary
is not changed, Dyninst and its components allow modification of the binary. This
modification can occur at the instruction level, at the CFG level, or even at the level
of data layout on the stack. We present an example of each of these use cases.
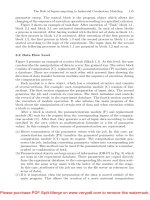
CRAFT [18] is a tool that determines which double-precision values in a binary
can best be replaced by single-precision, attempting to obtain the maximum performance benefit while ensuring that output accuracy remains within a user-specified tolerance. To do this, it replaces each double-precision instruction with a code sequence
that performs the same operation in parallel in single and double precision, and then
tracks the error introduced by conversion to single precision. Figure 1.5 illustrates
this operation.
Bernat and Miller [6] demonstrated the use of Dyninst components to apply security patches at the binary level to a running process by matching a CFG fingerprint,
constructing the code added by the patch in snippet form, and modifying the control
flow of the binary appropriately. This application, unlike CRAFT, typically works
by replacing blocks and edges as an entire subgraph of the CFG; Bernat and Miller’s
example patches the Apache HTTP server by wrapping a function call in an appropriate error checking and handling conditional. This CFG-based approach to binary
modification does not rely on symbols or particular instruction patterns. This allows
it to properly apply patches across binaries generated by a wide range of compilers,
and to be robust against inlining of the location to be patched.
14
W.R. Williams et al.
Fig. 1.5 Replacing instructions in basic blocks with CRAFT [18]
Gember-Jacobson and Miller [13] implemented primitives within Dyninst that
allow the modification of functions’ stack frames in well-specified manners: insertion
and removal of space, and exchanging two local variables within the same contiguous
stack region. This work does not alter the control flow of the binary at all; its purpose
is solely to affect the data layout of the stack. In addition to the modifications that
can be expressed purely in terms of insertion, removal, and exchange, they provide
implementations for inserting stack canaries into functions and randomizing the order
of local variables on the stack. Unlike the previous two examples, which altered the
control flow graph of the program, this work modifies the data flow graph of the
program while holding control flow constant.
1.8 Future Work
Dyninst and MRNet have become projects with a broad base of contributors and
ongoing development. As we deconstructed Dyninst into smaller tool kits, we refined
which complexities are actually necessary, and refined our abstractions to better
match what users need. In particular, the deconstruction of Dyninst has shown us
that Dyninst components may be used in a far broader set of applications than we
initially expected.
In Dyninst, we plan to add full support for ARM64/Linux, add support for 64-bit
Windows, and add support for Windows binary rewriting in the near term. We are also
continually working to support new high-performance computing environments. In
MRNet, we plan to implement a zero-copy interface that will improve performance.
1 Dyninst and MRNet: Foundational Infrastructure for Parallel Tools
15
Both Dyninst and MRNet are available via anonymous git checkout from http://
git.dyninst.org. The Dyninst mailing list is The MRNet
mailing list is Contributions, questions, and feature requests
are always welcome.
Acknowledgments This work is supported in part by Department of Energy grant DE-SC0010474;
National Science Foundation Cyber Infrastructure grants OCI-1234408 and OCI-1032341; and
Department of Homeland Security under Air Force Research Lab contract FA8750-12-2-0289. The
authors would also like to thank the many previous developers and users of Dyninst and MRNet.
References
1. Adhianto, L., Banerjee, S., Fagan, M., Krentel, M., Marin, G., Mellor-Crummey, J., Tallent,
N.R.: HPCToolkit: tools for performance analysis of optimized parallel programs. Concurr.
Comput.: Pract. Exp. 22(6), 685–701 (2010)
2. Ahn, D.H., De Supinski, B.R., Laguna, I., Lee, G.L., Liblit, B., Miller, B.P., Schulz, M.: Scalable
temporal order analysis for large scale debugging. In: Proceedings of the Conference on High
Performance Computing Networking, Storage and Analysis (SC09). ACM, Portland, Oregon,
November 2009
3. Arnold, D.C., Ahn, D.H., De Supinski, B.R., Lee, G.L., Miller, B.P., Schulz, M.: Stack trace
analysis for large scale debugging. In: IEEE International Parallel and Distributed Processing
Symposium, 2007 (IPDPS 2007). IEEE, Long Beach, California, March 2007
4. Bao, T., Burket, J., Woo, M., Turner, R., Brumley, D.: BYTEWEIGHT: Learning to recognize
functions in binary code. In: 23rd USENIX Conference on Security Symposium (SEC). San
Diego, California, August 2014
5. Bernat, A.R., Miller, B.P.: Anywhere, any-time binary instrumentation. In: Proceedings of the
10th ACM SIGPLAN-SIGSOFT workshop on Program analysis for software tools (PASTE).
ACM, Szeged, Hungary, September 2011
6. Bernat, A.R., Miller, B.P.: Structured binary editing with a CFG transformation algebra. In:
2012 19th Working Conference on Reverse Engineering (WCRE). IEEE, Kingston, Ontario,
October 2012
7. Buck, B., Hollingsworth, J.K.: An API for runtime code patching. Int. J. High Perform. Comput.
Appl. 14(4), 317–329 (2000)
8. Buntinas, D., Bosilca, G., Graham, R.L., Vallée, G., Watson, G.R.: A scalable tools communications infrastructure. In: 22nd International Symposium on High Performance Computing
Systems and Applications, 2008 (HPCS 2008). IEEE, Ottawa, Ontario, April 2008
9. Cray, Inc.: Cray Programming Environment User’s Guide. Cray, Inc. (2014)
10. Dinh, M.N., Abramson, D., Chao, J., DeRose, L., Moench, B., Gontarek, A.: Supporting relative
debugging for large-scale UPC programs. Procedia Comput. Sci. 29, 1491–1503 (2014)
11. DWARF Standards Committee: The DWARF Debugging Standard, version 4. http://dwarfstd.
org (2013)
12. Eigler, F.C., Red Hat, Inc.: Problem solving with SystemTap. In: Proceedings of the Ottawa
Linux Symposium. Citeseer, Ottawa, Ontario, July 2006
13. Gember-Jacobson, E.R., Miller, B.: Performing stack frame modifications on binary code.
Technical report, Computer Sciences Department, University of Wisconsin, Madison (2015)
14. Harris, L., Miller, B.: Practical analysis of stripped binary code. ACM SIGARCH Comput.
Archit. News 33(5), 63–68 (2005)
15. Jensen, N.B., Karlsson, S., Quarfot Nielsen, N., Lee, G.L., Ahn, D.H., Legendre, M., Schulz, M.:
Dysectapi: Scalable prescriptive debugging. In: International Conference for High Performance
Computing, Networking, Storage and Analysis (SC14). New Orleans, Louisiana, November
2014
16
W.R. Williams et al.
16. Jin, C., Abramson, D., Dinh, M.N., Gontarek, A., Moench, R., DeRose, L.: A scalable parallel
debugging library with pluggable communication protocols. In: 2012 12th IEEE/ACM International Symposium on Cluster, Cloud and Grid Computing (CCGrid). IEEE, Ottawa, Ontario,
May 2012
17. Laguna, I., Ahn, D.H., de Supinski, B.R., Gamblin, T., Lee, G.L., Schulz, M., Bagchi, S.,
Kulkarni, M., Zhou, B., Qin, F.: Debugging high-performance computing applications at massive scales. Commun. ACM 58(9), 72–81 (2015)
18. Lam, M.O., Hollingsworth, J.K., de Supinski, B.R., LeGendre, M.P.: Automatically adapting
programs for mixed-precision floating-point computation. In: Proceedings of the 27th International ACM Conference on International Conference on Supercomputing (SC13). ACM,
Denver, Colorado, November 2013
19. Lee, G.L., Ahn, D.H., Arnold, D.C., De Supinski, B.R., Legendre, M., Miller, B.P., Schulz, M.,
Liblit, B.: Lessons learned at 208k: towards debugging millions of cores. In: International Conference for High Performance Computing, Networking, Storage and Analysis, 2008. (SC08).
IEEE, Austin, Texas, November 2008
20. Llort, G., Servat, H.: Extrae. Barcelona Supercomputer Center. (2015)
21. Meng, X., Miller, B.: Binary code is not easy. Technical report, Computer Sciences Department,
University of Wisconsin, Madison (2015)
22. Miller, B.P., Roth, P., DelSignore, J.: A path to operating system and runtime support for
extreme scale tools. Technical report, TotalView Technologies LLC (2012)
23. Mußler, J., Lorenz, D., Wolf, F.: Reducing the overhead of direct application instrumentation
using prior static analysis. In: Proceedings of the 17th International Conference on Parallel
Processing-Volume Part I (Euro-Par 2011). Springer, Bordeaux, France, September 2011
24. Ravipati, G., Bernat, A.R., Rosenblum, N., Miller, B.P., Hollingsworth, J.K.: Toward the deconstruction of Dyninst. Technical report, Computer Sciences Department, University of Wisconsin, Madison. (2007)
25. Rosenblum, N., Zhu, X., Miller, B.P., Hunt, K.: Learning to analyze binary computer code. In:
23rd National Conference on Artificial Intelligence (AAAI). AAAI Press, Chicago, Illinois,
July 2008
26. Roth, P.C., Arnold, D.C., Miller, B.P.: MRNet: A software-based multicast/reduction network
for scalable tools. In: Proceedings of the 2003 ACM/IEEE Conference on Supercomputing
(SC03). ACM, Phoenix, Arizona, November 2003
27. Rutar, N., Hollingsworth, J.K.: Assigning blame: Mapping performance to high level parallel
programming abstractions. In: Sips, H., Epema, D., Lin, H.X. (eds.) Euro-Par 2009 Parallel
Processing. Lecture Notes in Computer Science, vol. 5704. Springer, Berlin, Heidelberg, Delft,
The Netherlands, August 2009
28. Schulz, M., Ahn, D., Bernat, A., de Supinski, B.R., Ko, S.Y., Lee, G., Rountree, B.: Scalable
dynamic binary instrumentation for Blue Gene/L. ACM SIGARCH Comput. Archit. News
33(5), 9–14 (2005)
29. Schulz, M., Galarowicz, J., Maghrak, D., Hachfeld, W., Montoya, D., Cranford, S.:
Open|SpeedShop: an open source infrastructure for parallel performance analysis. Sci. Program. 16(2–3), 105–121 (2008)
30. Schwarz, B., Debray, S., Andrews, G.: Disassembly of executable code revisited. In: Proceedings of the Ninth Working Conference on Reverse Engineering (WCRE’02). IEEE Computer
Society, Richmond, Virginia, October 2002
31. Shende, S.S., Malony, A.D., Morris, A.: Improving the scalability of performance evaluation
tools. In: Proceedings of the 10th International Conference on Applied Parallel and Scientific
Computing-Volume 2 (PARA 2010). Springer, Reykjavik, Iceland, June 2010
32. Shin, E.C.R., Song, D., Moazzezi, R.: Recognizing functions in binaries with neural networks.
In: 24th USENIX Conference on Security Symposium (SEC). USENIX Association, Washington, D.C., August 2015
33. Weiser, M.: Program slicing. In: Proceedings of the 5th International Conference on Software
Engineering (ICSE). IEEE Press, San Diego, California, March 1981
Chapter 2
Validation of Hardware Events
for Successful Performance Pattern
Identification in High Performance
Computing
Thomas Röhl, Jan Eitzinger, Georg Hager and Gerhard Wellein
Abstract Hardware performance monitoring (HPM) is a crucial ingredient of
performance analysis tools. While there are interfaces like LIKWID, PAPI or the
kernel interface perf_event which provide HPM access with some additional features, many higher level tools combine event counts with results retrieved from other
sources like function call traces to derive (semi-)automatic performance advice. However, although HPM is available for x86 systems since the early 90s, only a small
subset of the HPM features is used in practice. Performance patterns provide a more
comprehensive approach, enabling the identification of various performance-limiting
effects. Patterns address issues like bandwidth saturation, load imbalance, non-local
data access in ccNUMA systems, or false sharing of cache lines. This work defines
HPM event sets that are best suited to identify a selection of performance patterns on
the Intel Haswell processor. We validate the chosen event sets for accuracy in order
to arrive at a reliable pattern detection mechanism and point out shortcomings that
cannot be easily circumvented due to bugs or limitations in the hardware.
2.1 Introduction and Related Work
Hardware performance monitoring (HPM) was introduced for the x86 architecture with the Intel Pentium in 1993 [15]. Since that time, HPM gained more and
more attention in the computer science community and consequently a lot of HPM
related tools were developed. Some provide basic access to the HPM registers
with some additional features like LIKWID [17], PAPI [12] or the kernel interface perf_event [4]. Furthermore, some higher level analysis tools gather additional
information by combining the HPM counts with application level traces. Popular representatives of that analysis method are HPCToolkit [1], PerfSuite [10],
Open|Speedshop [16] or Scalasca [3]. The intention of these tools is to advise
the application developer with educated optimization hints. To this end, the tool
T. Röhl (B) · J. Eitzinger · G. Hager · G. Wellein
Erlangen Regional Computing Center (RRZE), University of Erlangen-Nuremberg,
Erlangen, Germany
e-mail:
© Springer International Publishing Switzerland 2016
A. Knüpfer et al. (eds.), Tools for High Performance Computing 2015,
DOI 10.1007/978-3-319-39589-0_2
17