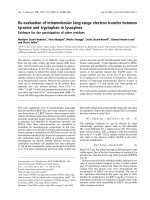
Accounting choice decisions and unlevered firms further evidence on debtequity hypothesis
Bạn đang xem bản rút gọn của tài liệu. Xem và tải ngay bản đầy đủ của tài liệu tại đây (56.04 KB, 15 trang )
Journal Of Financial And Strategic Decisions
Volume 7 Number 3
Fall 1994
ACCOUNTING CHOICE DECISIONS
AND UNLEVERED FIRMS: FURTHER
EVIDENCE ON DEBT/EQUITY HYPOTHESIS
V. Gopalakrishnan*
Abstract
This study extends the accounting choice literature by empirically examining a set of firms that do not
have long-term debt (unlevered) in their capital structure. Currently, evidence on how these firms make
accounting choice decisions is scarce. Empirical evidence on this issue is important for two reasons. First,
the case of unlevered firms serves as an additional testing ground for the positive theory of accounting
choice and the findings are likely to enhance our understanding of accounting choice decisions per se.
Second, it offers light in the area of generalizability of debt/equity and political cost hypotheses, particularly
to smaller firms. The results indicate that unlevered firms tend to choose income-increasing accounting
methods more than their levered counterparts. This is particularly true in the case of inventory method
choice. It appears that even without the presence of long-term debt, leverage, measured as total short-term
liabilities over equity, is a significant determinant of accounting choice. Finally, political cost hypothesis
does not seem to apply to smaller firms.
INTRODUCTION
A number of researchers have attempted to model what motivates managers in choosing accounting methods
(Hagerman and Zmijewski [11]; Zmijewski and Hagerman [23]), why managers lobby before standard setting
agencies (Francis [7]), and why the stock market reacts to mandated accounting changes (Leftwich [14]; Lys
[16]).1 Within the accounting choice literature, researchers have used the following perspectives to identify the
determinants of accounting choice: the opportunistic behavior, efficient contracting and information perspectives
(Holthausen [13]). It has been well documented that 'leverage' and 'political visibility' are important determinants
of accounting choice.
However, the prior researchers in general examined firms that were generally large and more importantly,
levered. This study extends the accounting choice literature by examining the depreciation and inventory method
choices for a set of firms that do not have long-term debt in their capital structure. Empirical evidence on this
issue is important for two reasons. First, the case of unlevered firms serves as an additional testing ground for the
positive theory of accounting choice. The accounting choice literature concludes that managers of levered firms are
likely to adopt "asset-increasing" and "income-increasing" accounting choices. One may argue that managers of
levered and unlevered firms do not share similar incentives to choose an income increasing accounting method and
therefore one would expect a different set of determinants of accounting choice for unlevered firms. In short, this
study is likely to enhance our understanding of accounting choice decisions per se. Second, it offers light in the
area of generalizability of contracting and political cost hypotheses, particularly to smaller firms. The prior
researchers, based on their analysis of mostly large firms found firm size, a proxy for political visibility, to be
negatively correlated with accounting choice. However, it is not clear whether for managers of smaller firms,
*
George Mason University
The author acknowledges the helpful comments of P. R. Chandy, Joseph Cheung, Mohinder Parkash and participants at the 1992 Annual Meetings of
the Decision Sciences Institute held at San Francisco.
33
34
Journal Of Financial And Strategic Decisions
minimizing political visibility is a concern. By focusing on a set of smaller firms, this study examines the question
whether the political visibility argument explains the accounting choice decisions.
This paper is organized as follows. The next section presents the hypotheses, develops the empirical models,
describes the sample selection process and offers evidence on the types of accounting-based covenants present in
short-term credit agreements. Section three presents the results followed by conclusions.
HYPOTHESES, MODEL AND SAMPLE SELECTION
Hypotheses
Two hypotheses have been extensively tested in the accounting choice literature (Watts and Zimmerman [20],
Ch. 9 and 10). They are (1) 'debt/equity hypothesis' : ceteris paribus, the larger a firm's debt/equity ratio, the more
likely the firm's manager is to select accounting procedures that shift reported earnings from future periods to the
current period; and (2) 'size hypothesis' (also known as political cost hypothesis) : ceteris paribus, the larger the
firm, the more likely the manager is to choose accounting procedures that defer reported earnings from current to
future periods.
Consistent with the extant literature, I postulate the following four hypotheses to examine how unlevered firms
choose their depreciation and inventory accounting methods.
Hypothesis 1:
Ceteris paribus, the higher the leverage, the greater the likelihood that a firm will choose straight-line depreciation method.
Hypothesis 2:
Ceteris paribus, the higher the leverage, the greater the likelihood that a firm will choose FIFO inventory method.
Here, leverage is defined as total current liabilities divided by market value of equity. If short-term liabilities
were to influence the choice of depreciation and inventory methods, one would expect a positive association
between leverage and an income-increasing accounting method.
Hypothesis 3:
Ceteris paribus, the larger the firm, the lesser the likelihood, it will choose straight-line depreciation method.
Hypothesis 4:
Ceteris paribus, the larger the firm, the lesser the likelihood, it will choose FIFO inventory method.
Hypotheses 3 and 4 test whether or not the political cost hypothesis apply to unlevered firms, which are
generally smaller than their levered counterparts. Descriptive statistics for the sample firms are presented in a
later section.
Model
I propose the following logit models to test hypothesis 1 through 4:2
Equation 1
log[Psl,i/(1-Psl,i)] = b0 + b1SIZEi + b2LEVERAGEi + b3PROFITi
35
Accounting Choice Decisions And Unlevered Firms
where:
Psl,i
SIZE
LEVERAGE
PROFIT
Probability firm i will choose the Straight-Line (SL) method of depreciation
Log of total sales
Total current liabilities divided by market value of equity
Operating income before depreciation and exclusive of changes in LIFO reserve divided by
market value of equity and total current liabilities
=
=
=
=
Here, SIZE and LEVERAGE are the variables of interest. Both leverage and size are generally found significant
in studies of accounting choice.3 However, Lilien, Mellman and Pastena [15] provide evidence that unsuccessful
firms are more likely to choose income increasing accounting procedures than successful firms. Thus, PROFIT is
included as a control variable. Thus, consistent with the extant literature, both b1 and b3 are expected to be < 0 and
b2 > 0.
Model (1) will be estimated to test hypotheses 1 and 3 that deal with the choice of depreciation methods. To
test the remaining two hypotheses (2 and 4), the following model will be estimated:
Equation 2
log[Pfifo,i/(1-Pfifo,i)] = b0 + b1SIZEi + b2LEVERAGEi + b3PROFITi + b4TAXRATEi
where Pfifo,i is the probability firm i will choose the FIFO (First-In-First-Out) method and TAXRATE is the firm's tax
rate calculated by dividing tax expense by net income. Since inventory method choices could be subject to tax
incentives, TAXRATE is included as a second control variable. Once again, b1, b3 and b4 are expected to be < 0 and
b2 > 0.
Sample Selection
To identify firms that do not have any long-term debt in their capital structure, I first searched the Compustat
database for firms with a long-term debt of zero.4 Second, I excluded regulated and non-service firms from the
sample.5 Third, I excluded firms that did not report depreciation method or did not have inventory and firms that
used methods other than LIFO or FIFO. Firms for which data on independent variables, particularly, closing
market price and operating income before depreciation were not available were deleted. I repeated these steps for
the years 1983 through 1987. My objective was to obtain a sufficient set of firms, for a consecutive five year period
to estimate the logit model. The final sample include 727 and 690 firms reporting depreciation and inventory
method choices, respectively. Table 1 contains the descriptive statistics for the sample on size measure, leverage
and profitability ratios and dependent variables.
TABLE 1
Descriptive Statistics For A Sample Of 727 Non-Regulated, Non-Service
And Unlevered Firms For The Years 1983 Through 1987
MEAN
S.D.
MIN
MAX
LEVERAGE
0.32
0.81
0.00
10.79
PROFIT
0.02
0.16
-1.74
1.00
SIZE1
2.49
2.25
-6.91
7.89
36
Journal Of Financial And Strategic Decisions
TABLE 1
Descriptive Statistics For A Sample Of 727 Non-Regulated, Non-Service
And Unlevered Firms For The Years 1983 Through 1987
(CONT’D)
MEAN
S.D.
MIN
MAX
SIZE2
2.64
1.66
-1.22
7.39
TAXRATE
0.31
1.11
0.00
0.83
DEPRECIATION
0.84
0.35
0
1
INVENTORY
0.85
0.36
0
1
MVE$
97.51
332.40
0.15
7123.97
BVE$
38.20
94.52
-266.06
1073.70
SALES$
90.03
253.32
0.01
2661.07
ASSETS$
59.26
154.56
0.29
1624.90
CURRENT
LIABILITIES$
13.44
42.30
0.02
551.20
LEVERAGE
PROFIT
= total current liabilities divided by market value of equity;
= operating income before depreciation and exclusive of changes in LIFO
reserve divided by market value of equity and total current liabilities;
SIZE1
= log of sales;
SIZE2
= log of total assets;
TAXRATE
= tax expense divided by net income;
DEPRECIATION = coded as 1 for straight-line and 0 for accelerated methods;
INVENTORY
= coded as 1 for FIFO and 0 for LIFO.
MVE
= market value of equity
BVE
= book value of equity
$ in millions.
The mean for sales and market value of equity was about $90 million and $98 million respectively. The mean
current liabilities over the same period was about $13 million. It appears that the sample firms are much smaller
than firms used in prior studies. For example, the mean sales in Hagerman and Zmijewski [11] was $1,760
million. Similarly, the mean market value of equity and sales in Press and Weintrop [18] was $775 million and
$1,911 million, respectively. The accounting choice literature indicates (Watts and Zimmerman [19]) that the
political cost hypothesis is generally applicable to large firms like the ones used in Watts and Zimmerman [19] and
in subsequent studies. The descriptive statistics in Table 1 underscores the differences in firm size between the
sample firms and firms examined in prior studies. This difference allows us to test whether or not the political cost
hypothesis apply to the sample firms.
Table 1 shows that the sample firms were barely making profits. The mean return on investments was about
2%. Given this low profitability ratio, it is likely that profitability could influence the choice of an accounting
method. Another note worthy finding from Table 1 is the tendency of the sample firms to choose incomeincreasing accounting methods, particularly, FIFO inventory method. Table 2 reports the distribution of
depreciation and inventory choices for the sample firms.
37
Accounting Choice Decisions And Unlevered Firms
TABLE 2
Distribution Of Depreciation And Inventory Accounting
Policy Choices For The Sample Firms During 1983-1987
Depreciation
Inventory
Income-Increasing1
611
587
Income-Decreasing2
116
_____
727
_____
84
103
_____
690
_____
85
Total Number Of Firms
Percent
1 Income-Increasing
2 Income-Decreasing
Percent
= Straight-Line Method (Depreciation) And FIFO (Inventory).
= Accelerated Method (Depreciation) And LIFO (Inventory).
= Percentage Of Firms Choosing An Income-Increasing
Method (SL/FIFO).
The percentage of sample firms choosing straight-line depreciation method during was 84%. This is consistent
with evidence reported in Hagerman and Zmijewski [11] and Press and Weintrop [18] for levered firms. However,
there is a significant difference between unlevered firms and levered firms in the case of chosen inventory methods.
The percentage of firms choosing FIFO over LIFO was 50% in Hagerman and Zmijewski [11] and 41% in Press
and Weintrop [18]. For the sample firms, the mean percentage of firms choosing FIFO was 85%. This is
interesting given that for smaller firms, where maximizing cash flow is likely to be an important objective, tax
based incentives generally lead to a preference in favor of LIFO. An empirical test of whether or not taxes
influence inventory method choice is presented in a later section.
Presence Of Restrictive Covenants For Sample Firms
To find out whether or not the sample firms are subject to restrictive covenants as part of short-term debt
agreements, I searched the annual reports to locate the nature and extent of binding covenants if any.6 Generally, I
found that firms disclose the existence of covenants either in management discussion and analysis section or in
footnotes to the financial statements section. A description of the identified covenants appears in Table 3.
TABLE 3
A Description Of Restrictive Covenants Found For
A Sample Of 31 'All-Equity' Firms1
Type Of Covenant
Number
Of Firms
1.
Maintenance of a minimum tangible net worth.
17
2.
Maintenance of a minimum working capital.
14
3.
Total number of firms where the only information reported was
"...the agreement requires the company to maintain certain
financial ratios".
14
38
Journal Of Financial And Strategic Decisions
TABLE 3
A Description Of Restrictive Covenants Found For
A Sample Of 31 'All-Equity' Firms1
(CONT’D)
Type Of Covenant
Number
Of Firms
4.
Prohibition or restriction on payment of cash dividends.
13
5.
Ceilings on total liabilities to equity ratio.
9
6.
Maintenance of a minimum current ratio.
5
7.
Restrictions on investments and acquisitions.
4
8.
Restrictions on incurring additional indebtedness.
3
9.
Prohibition or restriction on purchasing, redeeming or
retiring any capital stock.
2
10. Maintenance of a minimum profitability ratio.
2
11. Restrictions on incurring additional capital expenditures.
2
12. Restrictions on the ability of the firm to encumber its assets or
engage in certain transactions outside the normal course of business.
2
13. Restrictions on pledging of certain assets.
2
14. Maintenance of a minimum quick ratio.
1
15. Maintenance of cash flow.
1
1. Source: Company Annual Reports
The fifteen types of covenants identified for a sub-sample of 31 firms relate exclusively to short-term
obligations. Typically, these covenants were part of the short-term line-of-credit agreements. These covenants are
very similar to covenants identified for levered firms (Frost and Bernard [8]; Healy and Palepu [12]; and Press and
Weintrop [18]). The most common covenant was maintenance of a minimum dollar amount of tangible net worth.
I also find that the levels and ratios expressed in the covenants, typically used accounting numbers. However, this
sub-sample of 31 firms may or may not be representative of the entire sample. At the least, the above evidence
suggests that the managers of unlevered firms and levered firms face similar incentives to choose accounting
methods that relax covenants found in the lending agreements.
Univariate Analyses
Tables 4 and 5 present the results of univariate analyses. Spearman rank correlations among the dependent and
independent variables are contained in Table 4.
It appears that both PROFIT and SIZE seem to be associated with the choice of depreciation methods. The
correlation between DEPRECIATION and SIZE is negative as predicted and significant at the 0.01 level. Similarly,
PROFIT is negatively correlated with DEPRECIATION as expected and the correlation is significant at the 0.05 level.
As expected, LEVERAGE and DEPRECIATION are positively correlated but the correlation is not statistically
significant.
39
Accounting Choice Decisions And Unlevered Firms
In the case of inventory method choice, all the four predictor variables LEVERAGE, PROFIT and SIZE are
correlated with INVENTORY at the 0.01 level. As hypothesized earlier, PROFIT, SIZE and TAXRATE are negatively
correlated with INVENTORY. Similarly, as predicted, LEVERAGE is positively correlated with INVENTORY. Thus,
in summary, the correlation analysis offers support that both SIZE and PROFIT drive the choice of both depreciation
and inventory method choices. On the other hand, LEVERAGE appears to drive only the choice of inventory
method not the depreciation. Overall, the correlation analysis lend a strong support in favor of the political cost
hypothesis and a weak support for the debt/equity hypothesis. Also, there is no evidence of serious
multicollinearity among the independent variables.
TABLE 4
Correlation Matrix1
Panel A: Depreciation Choice
DEPRECIATION
LEVERAGE
1.00
0.07
DEPRECIATION
LEVERAGE
PROFIT
SIZE1
-0.10**
1.00
PROFIT
-0.16***
0.22***
0.37***
1.00
0.64***
SIZE1
1.00
Panel B: Inventory Choice
INVENTORY
INVENTORY
1.00
LEVERAGE
LEVERAGE
0.18***
1.00
PROFIT
SIZE1
PROFIT
SIZE1
-0.28***
-0.48***
-0.26***
0.20***
0.36***
0.16***
1.00
0.65***
0.60***
1.00
0.60***
TAXRATE
DEPRECIATION
INVENTORY
LEVERAGE
PROFIT
SIZE1
TAXRATE
TAXRATE
1.00
=
=
=
=
coded as 1 for straight-line and 0 for accelerated methods;
coded as 1 for FIFO and 0 for LIFO;
total current liabilities divided by market value of equity;
operating income before depreciation and exclusive of changes in LIFO;reserve
divided by market value of equity and total current liabilities;
= log of sales;
= tax expense divided by net income.
1 Spearman Rank Correlations.
*** significant at the 0.01 level, two-tailed test.
** significant at the 0.05 level, two-tailed test.
40
Journal Of Financial And Strategic Decisions
TABLE 5
Results Of Univariate Analysis Of Firms That Made
Income-Increasing And Income-Decreasing Accounting
Choices During 1983-1987
Panel A: Depreciation Choice
MEAN
MEDIAN
SL
ACC
t-Stat
SL
ACC
Chi-Sq
LEVERAGE
0.54
0.28
1.72*
0.12
0.11
0.04
SIZE1
2.35
3.47
4.43***
2.46
3.24
6.43***
PROFIT
0.02
0.06
1.96*
0.05
0.07
7.54***
Panel B: Inventory Choice
MEAN
MEDIAN
FIFO
LIFO
t-Stat
FIFO
LIFO
Chi-Sq
LEVERAGE
0.47
0.27
1.69*
0.18
0.09
15.7***
SIZE1
1.96
5.06
18.74***
2.10
5.07
89.3***
PROFIT
0.01
0.11
6.79***
0.03
0.11
52.6***
TAXRATE
0.24
0.37
3.24***
0.31
0.45
49.5***
SL and ACC are straight-line and accelerated depreciation methods, respectively.
*, ** and *** denote statistical significance in two-tailed tests, at the 0.10, 0.05 and 0.01 levels,
respectively. The t-statistic is for the significance of the differences between the means of the two
groups. The chi-square test is for the equality of the median of the two groups.
Table 5 reports the results of more univariate analysis of depreciation and inventory method choices made by
unlevered firms. These results, like correlation analysis, indicate how the predictor variables when considered
individually, are related to accounting choice. For each accounting choice, the sample firms are partitioned into
income-increasing (straight- line or first-in-first-out) and income-decreasing (accelerated or last-in-first-out)
methods.7 I then applied univariate tests (two-sample t and median tests) to examine whether there is a systematic
difference between firms that chose income-increasing and income-decreasing methods with respect to LEVERAGE,
SIZE1, PROFIT and TAXRATE.
For the depreciation method choice, the findings are consistent with the size hypothesis documented in prior
studies of accounting choice. Firms that chose accelerated depreciation methods were larger than those that chose
straight-line depreciation. In other words, larger firms, as expected, chose income-decreasing accounting methods
compared to smaller firms. The differences in SIZE1 are statistically significant at the 0.01 level. Consistent with
the debt/equity hypothesis, the mean LEVERAGE for firms choosing straight-line depreciation are higher compared
41
Accounting Choice Decisions And Unlevered Firms
to firms choosing accelerated methods. These differences are significant at the 0.10 level. However, the
differences in the median LEVERAGE are not significant at the 0.10 level even though the median LEVERAGE for
firms that chose straight-line depreciation is higher. Finally, both the mean and median PROFIT for the firms that
chose straight-line depreciation is lesser than firms that chose accelerated methods. This is consistent with Lilien,
Mellman and Pastena [15] that poor performers are more likely to choose income increasing methods than
successful performers.
The findings regarding inventory method choice is supportive of both the size and debt/equity hypotheses. Both
the mean and the median LEVERAGE for firms that chose FIFO is higher compared to firms that chose LIFO and
these differences are statistically significant. Similarly, LIFO firms are larger than FIFO firms and these
differences are significant at the 0.01 level. The mean and median PROFIT is higher for LIFO firms and this is
consistent with the notion that PROFIT influences inventory method choice. Finally, there is a significant
difference (at the 0.01 level) in the tax rates of LIFO firms compared to FIFO firms. As expected, both the mean
and median tax rates are higher for LIFO firms.
Overall, the results presented in Table 5 are consistent with the extant literature that both leverage and size are
determinants of accounting choice. The results of the multivariate models are discussed in the next section.
RESULTS OF MULTIVARIATE ANALYSES
The empirical results of models (1) and (2) are contained in Table 6. I discuss the results pertaining to
depreciation method choice first.
TABLE 6
Results Of The Logit Models Of Depreciation
And Inventory Method Choice1
Variable &
Predicted Sign
Depreciation
Inventory
INTERCEPT (?)
-2.59
(0.000)
-5.87
(0.000)
LEVERAGE (+)
0.25
(0.013)
0.40
(0.014)
SIZE1 (-)
0.25
(0.000)
1.05
(0.000)
PROFIT (-)
0.03
(0.961)
0.67
(0.626)
TAXRATE (-)
----
-0.03
(0.937)
-2*log L
573.47
346.58
Model Chi-Square
30.54
161.66
df
3
4
42
Journal Of Financial And Strategic Decisions
TABLE 6
Results Of The Logit Models Of Depreciation
And Inventory Method Choice1
(CONT’D)
p-Value
0.0001
0.0001
Correctly Classified2
86%
90%
Sample Size
727
690
LEVERAGE = total current liabilities divided by market value of equity;
PROFIT
= operating income before depreciation and exclusive of changes in
LIFO; reserve divided by market value of equity and total current
liabilities;
SIZE1
= log of sales;
TAXRATE = tax expense divided by net income.
1 Dependent variable is coded as 1 for income-increasing methods (SL or FIFO) and
0 for income-decreasing methods (accelerated or LIFO). A positive coefficient
indicates a higher probability of choosing an income-increasing method.
2 A naive prediction of 84% (85% for inventory) can be achieved based on the
proportion of the more commonly selected alternative. p-Values in parentheses.
Depreciation Method Choice
Several noteworthy points emerge from the findings. First, the chi-square statistic of 30.54 relating to the joint
significance of the three explanatory variables in model (1) is highly significant (at the 0.0001 level). The value of
chi-square statistic reported in Table 6 is higher than values reported in prior research. Second, the overall
predictability of the model is high. In prior studies of accounting choice (Zmijewski and Hagerman [23], Elliot
and Kennedy [6] and Press and Weintrop [18]), the classification rate ranged from 33% to about 73%.8 Here, for
depreciation method choice, the classification rate is 86% which is higher than a naive prediction rate of 84%
based on the proportion of the more commonly selected alternative as shown in Table 6. Both in models (1) and
(2), LEVERAGE and SIZE are the variables of interest. Results of univariate analyses presented in Tables 4 and 5
indicate that both PROFIT and TAXRATE (for inventory) could influence accounting choice. Therefore, these are
included as control variables in the logit models. If LEVERAGE and SIZE are key determinants of accounting
choice, then both of them should be statistically significant after controlling for PROFIT and TAXRATE (for
inventory). Of the explanatory variables, only LEVERAGE coefficient has the predicted sign. LEVERAGE is positive
as hypothesized and is highly significant (at less than 0.02 level). SIZE coefficient is positive and is significant at
the 0.001 level. The coefficient for PROFIT is close to zero and is statistically insignificant. Finally, the intercept
term is significant, suggesting possible measurement error in the model. This is consistent with the prior research.
Hagerman and Zmijewski [11], Zmijewski and Hagerman [23] and Press and Weintrop [18] all report significant
intercept terms.
Overall, the above evidence offers support for the hypothesis that the higher the leverage, the greater the
likelihood that a firm will choose straight-line depreciation method. This finding is consistent with the extant
literature on accounting choices. However, the interesting about this finding is the role of leverage as a significant
determinant of accounting choice even in the extreme case of firms with no long-term debt. In other words, the
above findings along with the findings documented in the extant literature may be interpreted as follows. As long
as there are constraints present in the lending agreements, whether short-term or long-term, managers are likely to
relax the tightness of those constraints by choosing income-increasing accounting methods.
The above findings do not support the hypothesis that the larger the firm, the lesser the likelihood, it will
choose straight-line depreciation method. On the contrary, it appears that, larger the firm, the greater the
Accounting Choice Decisions And Unlevered Firms
43
likelihood of adopting straight-line depreciation method. This result is not surprising for the following reasons.
First, Watts and Zimmerman [19] posit that political costs which are operationalized through the SIZE variable, are
important only for very large firms. In other firms, they argue that there is a threshold effect. Minimizing political
visibility is not likely to be a major concern for smaller firms compared to larger firms.
Second, empirical evidence based on a sub-sample of low political cost firms, presented in Zmijewski and
Hagerman [23] (Table 5) does not offer support for the political cost hypothesis. In Zmijewski and Hagerman, the
SIZE coefficient was positive and not significant. Similarly, Bowen, Noreen and Lacey [3] found that outside the
oil and gas industry, larger firms were more likely to capitalize interest, an income-increasing policy. More
evidence of a positive relationship between firm size and accounting choice is found in Gray [10]. Gray reports
that 72% of the largest industrial and commercial banks examined chose to adopt SFAS No. 8 in 1981 which
increased reported earnings.9
Third, Ball and Foster [2] point out that the political sensitivity is not the only factor for which SIZE could
proxy. They suggest that SIZE could represent the competitive disadvantages of disclosure, information production
costs and management ability and advice. The information production costs are likely to be important, particularly
for smaller firms and therefore smaller firms, may be motivated to choose accounting methods that are inexpensive
(such as straight-line depreciation) to implement. Therefore, to the extent the SIZE variable captures the
information production costs, for smaller firms, the SIZE variable is likely to be positively related to an inexpensive
accounting method.
Inventory Method Choice
Results of model (2) concerning inventory method choice are also contained in Table 6. Once again, the chisquare statistic relating to the joint significance of the four predictor variables is highly significant (at the 0.0001
level). The chi-square statistic values are much higher for inventory choice model compared to depreciation
method choice. The predictability rate of the model was 90%. This compares favorably to a naive prediction rate
of 85% (587 firms out of 690 chose FIFO) and 58% reported in Hagerman and Zmijewski [11]. Once again, the
coefficient for LEVERAGE has the predicted sign and is highly significant.
SIZE is positive and remains highly significant. This is consistent with the results reported earlier for
depreciation choice. To the extent the SIZE represents information production costs, for smaller firms, the SIZE
variable is likely to be positively related to an inexpensive accounting method such as FIFO. The administrative
burden associated with the adoption of LIFO is well-known. If a firm maintains its inventory records based on
FIFO method and if it wants to reduce taxes by adopting LIFO, then under the LIFO conformity requirement, it
must also use LIFO for external reporting. Compliance with this requirement generally increases book-keeping
cost. Based on a survey of chief financial officers of firms that did not use LIFO, Granof and Short [9] found that
20% of the respondents cited the presence of high administrative cost for rejecting LIFO in favor of FIFO.
The PROFIT variable is positive and is not significant at the 0.10 level. The second control variable, TAXRATE
is negative as predicted and is not statistically significant. Overall, results reported in Table 6 offer support for the
hypothesis that higher the leverage, the greater the likelihood that a firm will choose FIFO inventory method. This
is consistent with the results based on model (1) reported earlier. However, the findings do not support the
hypothesis that larger the firm, the lesser the likelihood, it will choose FIFO inventory method.
The above findings are also consistent with evidence reported in Agrawal and Nagarajan [1]. Based on an
analysis of a sample of unlevered firms, Agrawal and Nagarajan report that unlevered firms maintain a large
cushion of liquid assets and generally appear to be averse to debt, both long-term and short-term. They conclude
that the decision to shun long-term debt is consistent with the managerial concern for default risk.
In summary, the following two conclusions emerge based on the results contained in Table 6. First, consistent
with the debt/equity hypothesis, it appears that depreciation and inventory methods choice decisions made by
unlevered firms are driven by leverage. Results based on the multivariate models after controlling for profitability
and tax strongly support the notion that higher the leverage, the greater the likelihood of choosing straight-line
depreciation and or FIFO. Second, the so called political cost hypothesis documented in extant literature does not
seem to apply to smaller firms examined in this study.
44
Journal Of Financial And Strategic Decisions
Alternate Specifications
It is possible that the empirical results presented in Table 6 could be subject to specification error particularly
with respect to SIZE1. I estimated models (1) and (2) again with an alternative proxy, SIZE2 (log of total assets).
This measure of size has been used in Hagerman and Zmijewski [11]. Findings based on alternate specifications
confirm my earlier findings and fully supports the two conclusions reached earlier. The classification rates remain
unchanged and the overall significance of the models are much stronger. For both depreciation and inventory
choice, the chi-square values were higher than comparable values reported in Table 6. I also estimated models (1)
and (2) with an alternate specification for LEVERAGE1. Consistent with Chow [4] and Press and Weintrop [18], I
defined LEVERAGE2 as total current liabilities divided by market value of equity plus total current liabilities. These
extensions did not change the conclusions reached earlier.10
As an additional analysis, I also examined the accounting choice decisions of the sample firms when they
acquire long-term debt. Particularly, I was examining whether firms that used an income-decreasing accounting
method (LIFO or accelerated depreciation methods) change to an income-increasing method after acquiring longterm debt. I found that of the few firms that did acquire long-term debt, there was no change in their accounting
choice decisions, because these firms already chose an income-increasing method prior to acquiring long-term
debt. One possible explanation for this could be that the firms planning to seek long-term financing prepare
themselves by adopting income-increasing accounting methods, to mitigate contracting costs imposed by debt
covenants.
SUMMARY AND CONCLUSIONS
A plethora of research studies emerged during the eighties as a result of a seminal work by Watts and
Zimmerman [19]. Of particular interest to the researchers was the linkage between debt covenants and accounting
choice. Debt covenants typically restrict the ability of the managers to engage in certain kinds of activities and
often impose a variety of costs on the firm. Therefore, managers often tend to choose accounting methods that
moves the firm away from the restrictions imposed by the debt covenants. It has been well documented in the
accounting choice literature that leverage and political costs are key determinants of accounting choice. However,
the above evidence was essentially based on firms carrying long-term debt in their capital structure.
This study extends the accounting choice literature by examining the depreciation and inventory method
choices for a sample of unlevered firms. An examination of the accounting choice decisions made by the unlevered
firms is motivated by the opportunity to test a well established theory in an extreme case. The findings lead to the
following conclusions. First, it appears that unlevered firms tend to choose income-increasing accounting methods
more than their levered counterparts. This particularly true in the case of inventory method choice.
Second, an analysis of actual debt covenants for a small sub-sample reveals the presence of a variety of
affirmative and negative covenants similar to the ones documented by prior researchers for levered firms. This
suggests that the managers of unlevered firms and levered firms face similar incentives to choose accounting
methods to mitigate costs imposed by restrictive covenants.
Third, it appears that, even without the presence of long-term debt, leverage, measured as total short-term
liabilities over equity, is a determinant of accounting choice. This is consistent with the debt/equity hypothesis
documented in the extant literature.
Fourth, political cost hypothesis does not seem to apply to smaller firms. The coefficient for the SIZE variable,
a proxy for political visibility, was consistently positive. In other words, the findings confirm the presence of a
threshold effect discussed in the literature (Zimmerman [22]). To the extent, the SIZE variable proxy for
information production cost, it appears that there is a positive association between firm size and accounting choice.
This is consistent with the notion that managers, particularly in very small firms, to keep information production
costs low, are likely to adopt accounting methods that are 'inexpensive' (such as straight-line method or FIFO) to
implement.
Fifth, LEVERAGE and SIZE factors influence accounting choice decisions even after controlling for tax and
profitability factors. There is no evidence of managers being influenced by profitability and tax factors in setting
accounting policies. This is surprising given the evidence in Lilien, Mellman and Pastena [15] and the fact the
sample firms were barely making profits during the time period studied.
Accounting Choice Decisions And Unlevered Firms
45
The case of unlevered firms holds promise in further enhancing our understanding of how and why firms make
accounting choice decisions. For example, Watts and Zimmerman [21] suggest that accounting choice decisions
could be correlated with investment opportunity set, financial policy and organizational structure. Thus, a
comparative study of accounting choices made by both levered and unlevered firms could throw light on the
linkage between capital structure choice and accounting choice.
ENDNOTES
1.
See Watts and Zimmerman [20], [21] for a review.
2.
Prior researchers have used both probit (Zmijewski and Hagerman [23] and Press and Weintrop [18]) and logit
(Malmquist [17]) models. However, Elliot and Kennedy [6] while replicating Zmijewski and Hagerman [23] found
that logit model generally outperformed probit model.
3.
For example, Zmijewski and Hagerman [23] report that in addition to leverage and size, management compensation
and concentration ratio were significant in explaining accounting choices. However, subsequent researchers (Press
and Weintrop [18]) have not been successful in replicating their results.
4.
The Compustat CD-ROM defines ‘long-term’ debt to include capitalized lease obligations. I reviewed the annual
reports of more than 100 of the sample firms to confirm the absence of long-term debt.
5.
This criterion excluded firms with the following four digit SIC codes: > 6000 (financial, insurance, real estate,
hospitals and services; these firms are not likely to have inventory or incur significant depreciation cost) 4811, 4890,
4911, 4922-4924, 4931 and 4932 (communications, gas and electric utilities.)
6.
I also searched Moody’s Industrial manuals to locate covenants but I did not find any covenants on short-term
obligations.
7.
My categorization of straight-line depreciation and FIFO as income-increasing and accelerated depreciation and
LIFO as income-decreasing is consistent with the prior research (Hagerman and Zmijewski [11]; Zmijewski and
Hagerman [23]; and Press and Weintrop [18]) and affords a direct comparison of my findings with the extant
literature. However, it is important to recognize that this categorization is at best a simplification. Although, LIFO is
generally income-decreasing if inventory prices and quantities are rising, it is not income decreasing if inventory
prices are falling. For example, some companies in the electronics industry have experienced declining costs. For
these companies, using FIFO is considered more conservative than using LIFO. However, without additional firmspecific information it is difficult to fine tune this categorization.
8.
In Hagerman and Zmijewski [10], the classification rate for depreciation was 85.33%. But based on a naive
prediction rule, one would expect 85% of the firms to choose straight-line depreciation, For example, 255 (85%) out
of 300 firms chose straight-line depreciation.
9.
For 1981, firms could select either SFAS No. 8 or SFAS No.52. Under SFAS No. 8, translation gains and losses are
included in net income. On the other hand, SFAS No.52 requires these gains and losses to be taken directly to the
balance sheet.
10. For model (1) (depreciation), -2*log L and the chi-square statistic were 566.75 and 39.04 (significant at 0.0001),
respectively. Both LEVERAGE and SIZE were positive and significant at the 0.02 level. PROFIT was not significant.
For model (2), -2*log L and the chi-square values were 422.70 and 153.25 (significant at the 0.0001 level). Once
again, both LEVERAGE and SIZE were positive and highly significant.
46
Journal Of Financial And Strategic Decisions
REFERENCES
[1]
Agrawal, A., and N. Nagarajan, "Corporate Capital Structure, Agency Costs, and Ownership Control: The
Case of All-Equity Firms," Journal of Finance XLV, 1990, pp. 1325-1331.
[2]
Ball, R., and G. Foster, "Corporate Financial Reporting: A Methodological Review of Empirical Research,"
Journal of Accounting Research 20, 1982, pp. 161-234.
[3]
Bowen, R. M., E. W. Noreen and J. M. Lacey, "Determinants of the Corporate Decision to Capitalize
Interest," Journal of Accounting and Economics 3, 1981, pp. 151-179.
[4]
Chow, C., "The Demand for External Auditing: Size, Debt and Ownership Influences," The Accounting
Review 57, 1982, pp. 272-291.
[5]
Christie, A., "Aggregation of Test Statistics: An Evaluation of the Evidence on Contracting and Size
Hypotheses," Journal of Accounting and Economics 12, 1990, pp. 15-36.
[6]
Elliot, J., and D. Kennedy, "Estimation and Prediction of Categorical Models in Accounting Research,"
Journal of Accounting Literature 7, 1988, pp. 202-242.
[7]
Francis, J., "Lobbying Against Proposed Accounting Standards: The Case of Employers' Pension
Accounting," Journal of Accounting and Public Policy 6, 1987, pp. 35-57.
[8]
Frost C., and V. Bernard, "The Role of Debt Covenants in Assessing the Economic Consequences of Limiting
Capitalization of Exploration Costs," The AccountingReview 64, 1989, pp. 788-808.
[9]
Granof, M., and D. Short, "Why Do Companies Reject LIFO?," Journal of Accounting, Auditing and
Finance 7, 1984, pp. 323-333.
[10] Gray, D., "Corporate Preferences for Foreign Currency Accounting Standards," Journal of Accounting
Research 22, 1984, pp. 760-764.
[11] Hagerman, R., and M. Zmijewski, "Some Economic Determinants of Accounting Policy Choice," Journal of
Accounting and Economics 1, 1979, pp. 141-161.
[12] Healy, P., and K. Palepu, "Effectiveness of Accounting-Based Dividend Covenants," Journal of Accounting
and Economics 12, 1990, pp. 97-123.
[13] Holthausen, R., "Accounting Method Choice: Opportunistic Behavior, Efficient Contracting and Information
Perspectives, " Journal of Accounting and Economics 12, 1990, pp. 207-218.
[14] Leftwich, R., "Evidence of the Impact of Mandatory Changes in Accounting Principles on Corporate Loan
Agreements," Journal of Accounting and Economics 3, 1981, pp. 3-36.
[15] Lilien, S., M. Mellman and V. Pastena, " Accounting Changes: Successful versus Unsuccessful Firms," The
Accounting Review 63, 1988, pp. 642-656.
[16] Lys, T., "Mandated Accounting Changes and Debt Covenants: The Case of Oil and Gas Accounting,"
Journal of Accounting and Economics 6, 1984, pp. 39-65.
[17] Malmquist, D., "Efficient Contracting and the Choice of Accounting Method in the Oil and Gas Industry,"
Journal of Accounting and Economics 12, 1990, pp. 173-205.
Accounting Choice Decisions And Unlevered Firms
47
[18] Press, E., and J. Weintrop, "Accounting-based Constraints in Public and Private Debt Agreements: Their
Association with Leverage and Impact on Accounting Choice," Journal of Accounting and Economics 12,
1990, pp. 65-95.
[19] Watts, R., and J. Zimmerman, "Towards a Positive Theory of the Determination of Accounting Standards,"
The Accounting Review 53, 1978, pp. 112-134.
[20] Watts, R., and J. Zimmerman, Positive accounting theory. Prentice Hall, Englewood Cliffs, NJ, 1986.
[21] Watts, R., and J. Zimmerman, "Positive Accounting Theory: A Ten Year Perspective," The Accounting
Review 65, 1990, pp. 131-156.
[22] Zimmerman, J., "Taxes and Firm Size," Journal of Accounting and Economics 5, 1983, pp. 119-149.
[23] Zmijewski, M., and R. Hagerman, "An Income Strategy Approach to the Positive Theory of Accounting
Standard Setting/Choice," Journal of Accounting and Economics 3, 1981, pp. 129-149.