ublic service quality and customer satisfaction at yen bai department of planning and investment
Bạn đang xem bản rút gọn của tài liệu. Xem và tải ngay bản đầy đủ của tài liệu tại đây (8.24 MB, 83 trang )
U P P SA L A l M V K R SI I ÉT &
UPPSALA
UNIVERSITET
VNl! U N IV K R SIT Y OF K CONOM K s & BUSINESS
£
VNU-UEB
________________ ***__.
MASTER THES1S OF MPPM
PUBLIC SERVICE QUALITY AND
CUSTOMER SATISFACTION AT
YENBAI DEPARTMENT OF
PLANNING AND INVESTMENT
A u th tìr :
N C U \ KN N( ; ( K A M I
Su p ervisor:
PROK. i.ARS-TORSTEN KRIKSSON
S u p erviso r:
[)R. PHAN C HI ANH
Class :
VI PPM Intakc 7
Hanoi, .lanuary - 2 0 1 5
Ư PPSA L A U N IV E R SIT É T
UPPSALA
UNIVERSITET
VNU U N I V E R S n Y OF
E C O N O M IC S & BUSINESS
VNU-UEB
ACKNOW LEDGEMENT
After few months of working intensivc, it is time my master thcsis completed vvhich
investigate the relationship betvveen the public Service quality and customer satisíaction.
Firstly, 1 would like to exprcss my gratiíudc to my supcrvisor Prof. Lars-Torstcn
Erikkson and Dr. Phan Chi Anh for the meaningful comments, remarks and engagement
through the lcaming process of this master thesis.
Furthermore, 1 vvould like to thank the participants in my survey, who have willingly
to share their precioưs time during the process o f intervievving.
Finally, I like to thank my beloved classmate, who have supportcd mc throughout
entire process, both by giving me useful comments to complete my master thesis and
motivating me during wording my master thesis.
Respectíully,
Nguyên Ngoe Anh
ABSTRACT
This study investigates the relationship betwcen public Service quality and the
customcr satisíaction bascd on qucstionnairc survey.
Adopting SKRVPERK modcl
(Parasuraman, et al, 1988) this study applies statistical tools to analyze the data
collected at Yenbai Department o f Planning and Investment in 2014. The rcsults o f
this study indicatc and the signiíicant íầctors f'or customcr satisíầction in public
Service o f Yenbai Department o f Planning and Investment. Based on those results, the
suggestions and recommendations to improve puhlic Service qưality at Yenbai
Department o f Planning and Investment are mađe.
Topic:
“Public
Service
Quality
and
Customer
Satisĩaction
at
Yenbai
Department o f Planning and Investnient”
Level o H h e sis: Master o f Public Management.
Authors:
NịỊuyen Ngoe Anh
Instructors: Prof. Lars-Torstcn Erikkson and Dr. Phan Chi Anh
Master deĩense day:
December 5,h, 2014.
Aim: The purposes o f this study are to asscss the public Service quality based on
opinions o f customers making transactions at Yenbai Department o f Planning and
Invcstmcnt; to study on the rclationship and factors alTecting customer satisfaction; to
givc suggcstions and rccommendations to improve public scrvicc quality at Ycnbai
Department o f Planning and Investment.
IMethod: By combining SERVỌUAL scale o f Parasuraman, this stutiy wi 11 asscss
public Service quality through 6 dimcnsions:
'
T ransp aren cy (T R )
I
I
_______________________ ,
I
_____________ ___ ______________
I!
A dm inistrutivc p ro c cd u rcs (PR)
I
_____________ ________________
I
I
I
Attitudc o f sta íìs (A T )
C o m p e te n c y of staíís (C O )
'
----------------------------------- *
----------- ----—— -----------
J
E m p ath y o f staíỉs (CM )
1
---------- 7-------- :-------777'."-------
I
'
ỉnírastructures (IN F R )
Result & Conclusions:
lu summary, researching on custom er satisíầction about public Service at the
Reception and Returning
Result for Business Registration Scction o f Yenbai
Department ơ f Planning and Investment is one o f factors for leaders o f city and
dcpartmcnts to determinc the current situation o f providing public services and aims to
complcte in the future. This is one o f thc solutions to shorten timc to enter market o f
entcrpriscs.
On the basis o f application o f the scale measuring components o f Service quality
(SERVPERF), the relationship betvveen Service quality and custoincr satisfaction and
customer satisfaction modcl o f Parasuraman and Spreng - Mackoy so that the thesis
has identiíìed ĩactors affecting customer satisfaction, quantifies the impact o f each
factor on customer satisfaction, and develop the fírst modcl on customer satisfaction
about public services at the Department o f Planning and Investment o f Yenbai city.
The research results show that the components o f public Service and affecting
customcr satisíầction
including empathy, competcncy ot' staffs, iníVastructurcs,
procedures, transparency and attitude o f staffs.
Expectations and desires o f the customers about public services arc basically shown
through rcsearch results. It is consistent vvith the results ot' customer surveys before
data analysis. With public scrvices, particularly in thc ríelcl o f public administration
scrviccs, customer desiretl to rcccivc polite attitudc, courtcous, reliablc o f staffs, as
well as transparency o f process, proccdurcs, mcthod of payment, fees, and timc to
provide Service...
Contribution of the thesis:
()n the basic o f this research results, the thcsis proposcd a Iiinnbcr of solutions and
rccommendations to enhance customer satisiầction bascd on the actual perception
o f the positive aspects and limitations in providing puhlic Service, through íaetors
illustrating the systcmatic and gencrali/ed charactcristics o f thc rcscarch model.
The Department should registration for intcllcctual property o f Logo and Slogan;
better implement issued quality policy... aims to shorten the time to enter the market
o f enterpriscs.
IV
The Department o f Planning and Investment Yenbai shoulci organize to apply
rescarching on c u sto m er satisfaction with public scrviccs in thc City, to rcspect the
indcpendence o f research implemcntation.
Thesis liniitations:
Time and íìnancial budgct limit.
Small samples, so that the author could not usc more technique to investigate (such
as S E M ...).
Suggestions for future research:
Collecting more sam plc
Using SEM (Structural equation modeling) technique to analyze the rclationship
betvveen Service quality and C ustom er Satisfaction.
Key
vvords:
Public
Service
quality,
customer
SERV Ọ U A L.
V
satisíaction,
SERVPERP,
C O N T liN T S
I. INT R O D U C T IO N
1.1
1.1.1
1
B ackground........................................................................................................................ I
Introduction about establisliment process ot the Proccdure Reception
and
Result Retum for Business Rcgistration Section...................................................................1
1.1.2
Functions, tasks o f the Division o f Reception
and Return o f Business
Registration..................................................................................................................................... 1
1.1.3
Results at the Reception and Returning Result
for Business Registration
Section o f Yenbai Department o f Planning and Investment from 2008 to 2 0 1 3 .........4
1.2
Research q u e s tio n ............................................................................................................. 5
1.3
Research purpose and speciíìc objectives................................................................... 6
1.4
Subjects and scope o f the s t u d y ................................................................................. 6
II. FRAM E OF R E K E R E N C E .................................................................................................. 7
2.1
Five gaps Service quality m o d e l..................................................................................7
2.2
IVIeasuring Service quality: SE R V Q U A L s c a l c .....................................................9
2.3
The studies applying SER V Q U A L and S E R V P E R F .......................................... 9
2.4
Kactors affecting public Service q u a l i t y .................................................................... 1 1
III. RESEARCH M ET H O D O L O G Y
13
3.1
Research m o d c l.............................................................................................................. 13
3.2
Discuss relevance of research modcl ĨIIpublic s ec to r ......................................... 14
3.3
M eth o d o lo g y ....................................................................................................................15
3.3.!
Research m cth o d o lo g y ................................................................................................15
3.3.2
Research process........................................................................................................... 15
3.4
Preliminary rescarch (q ualitatỉve)..........................................................................16
3.4. i
Research p u rp o s e s ........................................................................................................16
3.4.2
Im plem entation..............................................................................................................17
3.4.3
Rcsults............................................................................................................................. 17
3.5
Pormal rescarch (quantitative)................................................................................. 18
3.5.1
Analytical ữamevvork:.................................................................................................18
3.5.2
Scale................................................................................................................................. 18
VI
3.6
Data analysis p r o c e s s ...................................................................................................20
3.6.1
Reliability analysis hy C ronbach’s a lp h a .............................................................. 21
3.6.2
Exploratory factor analysis.......................................................................................22
3.6.3
Regression analysis..................................................................................................... 23
IV. DATA AN AI-V S I S .............................................................................................................. 24
4.1
Data d escrip tio n ............................................................................................................24
4.1.1
G end er............................................................................................................................24
4.1.2
A g e ..................................................................................................................................25
4.1.3
Education le v e l............................................................................................................26
4.1.4
Sources o f Iníb rm atio n ..............................................................................................26
4.1.5
Service u s e d ..................................................................................................................27
4.2
Reliability a n a ly sis....................................................................................................... 28
4.2.1
Reliability o f Transparency s c a le ........................................................................... 28
4.2.2
Reliability o f Procedure scale.................................................................................. 28
4.2.3
Reliability o f Attitude scale......................................................................................29
4.2.4
Reliability o f Competency scale.............................................................................. 30
4.2.5
Reliability o f Empathy scale.....................................................................................30
4.2.6
Reliability o f Inữastructure s c a le ............................................................................ 31
4.2.7
Reliability o f C U STO M ER SA TISK A C H O N scale..........................................33
4.3
Kactor analvsis................................................................................................................34
4.3.1
l;actor analysis 1'or Transparcncy scale.................................................................. 34
4.3.2
Factor analysis for Procedure s c a le ........................................................................ 35
4.3.3
Factor analysis for Attitudc s c a l e ........................................................................... 36
4.3.4
Kactor analysis for Competency s c a le ....................................................................38
4.3.5
Pactor analysis for Empathy s c a le .......................................................................... 39
4.3.6
Pactor analysis for Inữastructure scale.................................................................. 40
4.3.7
Pactor analysis o f customer satisfaction sca le ...................................................... 41
4.4
Evaluation H v p oth eses............................................................................................... 42
4.4.1
Evaluating customer feelings o f Service quality p e rfo m ia n c e .........................42
4.4.2
Correlation A n alysis.................................................................................................. 44
4.4.3
Regression analysis..................................................................................................... 45
vii
V. R EFLEC TIO N AND C O N C L U S IO N
47
5.1
Summary of rcsearch íindinịỊS..................................................................................47
5.2
S o lu tio n ............................................................................................................................. 48
5.2.1
T ran sp a ren c y ..................................................................................................................48
5.2.2
Procedures........................................................................................................................48
5.2.3
A ttitu d e ............................................................................................................................. 51
5.2.4
Competency o f the o fficials........................................................................................ 53
5.2.5
Empathy o f the o ff ic ia ls .............................................................................................. 53
5.2.6
Inữastructures.................................................................................................................54
5.3
Concỉusion....................................................................................................................... 56
VI. LEARNING E X P E R IE N C E S T H R O U G H RESEA RC H
57
R E F E R E N C E S ............................................................................................................................... 58
A PP E N D IX ....................................................................................................................................... 61
VIII
L IS T O F T A B L E S
Table 1.
Rcsults at the Reception and Returning Rcsult for Business Registration
Scction o f Yenbai Department o f Planning and Investm ent............................4
Table 2.
SERV PER F s c a l e .....................................................................................................10
Tablc 3.
Observed
variables
used
to identif'y components
aỉTecting customer
satisỉầction with public scrviccs at Ycnbai Department ot' Planning and
Investm ent.................................................................................................................. 19
Table 4.
Cronhach alpha valucs and intemal consistency (George & Mallery, 2003)..
............................................................................................................................................................................ 21
Table 5. Reliability statistics o f Transparency s c a l e .......................................................... 28
Table 6. Reliability statistics o f Proccdurc s c a lc ................................................................. 28
Tablc 7. Reliability statistics o f Attitude s c a le .....................................................................29
Table 8. Reliability statistics o f Competency s c a le ............................................................ 30
Table 9. Reliability statistics o f Empathy scale................................................................... 30
Table 10. Reliability statistics ofInfrastructure s c a l e ....................................................... 31
Table 11. Pinal Reliability statistics o f Inữastructure s c a le ............................................. 32
Table 12. Reliability statistics o f Customer satisíaction s c a l e ........................................ 33
Tablc I 3. Exploratory faclor analysis for transparency scale KMO and Bartlett's T e s t .
...................................................................................................................................... 34
Table 14. Procetlure scale factor analysis KMO and Bartlctt's T e s t ..............................35
Table 15. Atlitude scale factor an aly sis.................................................................................36
Tablc 16. Com pctcncy scalc tầctor analysis KMO and Bartlctt's T c s t ......................... 3
Tahle IX. ỉnfrastructurc scale ĩactor analysis KMO and Bartlctt's T e st........................ 40
Table 19. Custom cr satistầction scale íầctor analysis KMO and Bartlett's T e s t.........41
Tablc 20. Correlation m atrix.................................................................................................... 44
Tablc 21. Pinal Rcgrcssion a n a ly s is .......................................................................................46
IX
L IS T O F F I G U R E S
F ig u r e l.
Procedurc to direct, receive, proccss and return rcsults for husiness
rcgistration.................................................................................................................. 3
Figure 2.
Results at the Reception and Returning Result for Business Registration
Section o f Yenbai Department o f Planning and Invcstment.......................... 5
Figurc 3.
Service quality modcl o f Parasuram an.................................................................8
Figure 4.
Research m o d e l.......................................................................................... 14
Pigure 5.
Research p ro c e d u re ................................................................................... 16
Figure 6.
Means scores o f Service quality pertbrmance and customer satisíầction
Figure 7.
Mean scores o f customer satisíaction c o m p o n en ts........................... 43
42
I. INT R O D U C T IO N
1.1 Background
1.1.1
Introduction about establishmcnt process o f the Procedure Reception and
Result Return for Business Registration Section
The Division o f Reception and Return o f Business Registration is one o f
proĩessional divisions o f thc Department o f Planning and Investmcnt o f Yenbai,
under the direction and inanagement o f thc organi/.ation, staffing and work o f the
Director o f Planning and Investments; responsible for coordinating all rooms and
units bclonging to thc Department, as vvcll as rclcvant local agcncics, working to
meet the requirements o f the Room, the Department and administrative refonn. The
Division oi' Reception and Retum o f Business Rcgistration vvhich was 1'ormed,
constructed and operated since 2006 came from the actual demand for reform o f
administrative procedures concerning entcrprises’ Processing o f
cntcring the
market.
1.1.2
Functions, tasks o f the Division o f Reception and Retum o f Business
Registration
Direcl instruction, receiving the rccords o f business rcgistration; considering
the validity o f business registration records and provide or dcny a certitìcate o f
business registration to cntcrpriscs
Construction, management and opcration o f information systems for busincss
rcgistration within the City; provide iníbrmation on busincss registration to the city
People's Committee, thc Department o f Taxation, thc Department o f Statistics and
the relevant agencies regularly, as wc!l as to organizations, individuals having
requirements.
Requiring cnterprises to report business status under the provisions o f
specitìcd in scntence c, clause 1 o f the article 163 business law; supervising thc
implementation o f thc annual rcport o f the entcrprises.
I
Direct inspection or request the competent State agcncy to inspect enterprises
according to the contents o f business registration rccords; instruct enterprises and
who wants to run a busincss on the order and procedures for husiness registration.
Require enterprises to pause business operation whcn detecting that the
enterprises do not qualify following the law.
Rcvocation o f thc ccrtifícate o f busincss registration in the cascs spccitìed in
Clause 2, Article 165 o f the Business lavv.
Registration for business for other business forms following the law.
Handling cascs, which brcak the law about rcgulations for business
registration under the law; Revocation oi'the certificate o f business rcgistration and
rcquiring busincss to wind up its opcrations undcr thc la\v; Taking rcsponsibility for
violations o f business registration.
-
To collect, analyze, and give periodic reports on the situation o f períbrming
assigncd tasks in accordancc with thc rcgulations; to rcport thc ditĩiculties and
problems in the work o f business registration to the compctent authorities.
Managing records and documents relating to the duties and assets to ensure
the satety and compliance with regulations.
Coordinate with spociali/cd departmcnts, rcsearch units to suggestions for
lcadcrs o f departmcnts about thcir assigncd areas.
In addition to the above tasks, the Department o f Reccption and Return for
Business Registration have to be rcsponsible for otlier duties assigned by the
Dircctor o ĩ t h e Department.
Regarding to the tasks o f instructions, reccptiơn, P rocessin g and return o f
busincss registration rcsults, thc Department o f Planning and ỉnvestment has
establishcd procedures and received the certiíìcate o f quality management system
following ISO 9001:2000 standards from 2011 and re-ccrtiíìod in 2014, the detail
proccdure as follows:
Kigure 1. Procedure to direct, receive, process and rcturn results for
business registration
3
1.1.3
Results at the Reception and Rcturning Rosult loi Business Registration
Section o f Yenbai Department o f Planning and lnvestmcnt froni 2008 to
2013
Tho division o f Reception and Return busincss registration has successíully
completed its assigned tasks during the period 2008 - 2013. Registration business
has made improvements towards transparent and simple. The lavvs and guidelines
ơn business registration arc published transparently. Inữastructures are investcd
with modern equipment, now are facilitated with intormation tcchnology systems
supporting business registration, storage and Processing procedures. Most o f the
processes and procedures are pertbrmeđ on software to ensure the accuracy, safety
and fast. Staffs that perform the Processing operations are regularly traincd to
improve proíessional skills.
As a result, the P rocessing time and the providirm registration certiíìcate have
now becn shortened eonsidcrably compared to regulations in the Business Law. The
rcgistration for ncw cstablishmcnt is 3-4 days; rcgistration for changing is 1-2 days.
The number o f enterprises, branches, representative otììces that are solved
procedures in Reception and Retum business registration accounts for an average o f
5000-7000 per ycar.
In thc pcriod o f 2008 - 2013, Department o f Rcception and Return results
business rcgistration has períbrmed ovcr 10,000 activitics on examination and
rcvicw ol business activitics in the city, in vvhiclì the number ơt violations ot' thc
husincss lavv, and he revocated rcgistration ccrtificatc is ovcr 4,000 busincsses.
Table 1. Results at the Reception and Rcturning Result for Business
Registration Section of Yenbai Department of Planning and Investment
2009
2011
2012
2013
C rite ria
2010
Number o f new entorpriscs
1,610
1,355
1,040
965
-7.52%
-22.17%
-40.26%
-44.57%
6,012,472
4,059,802
3,182,738
2,952,533
31.99%
-10.88%
-30.13%
-35.19%
1 38
128
108
96
1,741
Growth ratc comparcd to
the prcvious year (%)
Registered
Capital
4,555,365
(10f’VND)
Growth rate compared to
the previous ycar (%)
Number o f new branches,
142
representative olĩiees
4
C ritc ria
2009
Growth rate compared to
20 ĩ 0
201 í
2012
2013
-2.82%
-9.86%
-23.94%
-32.39%
2,716
1,697
1,596
1,505
36.14%
-14.94%
-20.00%
-24.56%
41
31
33
45
5.13%
-20.51%
-15.38%
15.38%
29
35
39
31
20.83%
45.83%
62.50%
29.17%
the prcvious year (%)
Number
of
customers
changing the contents o f
1,995
business rcgistration
Growth rate compared to
the previous year (%)
Number
of
enterprises
39
rcgistering to vvind up
Growth rate compared to
the previous year (%)
Number
of
branches,
representative
ottìces
24
stopping operations
Growth rate coniparcd to
the previous year (%)
(Source: Yenbai Department o f Planning and Investmem)
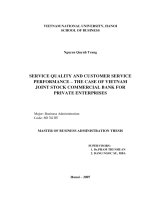
3.000
2.500
2.000
ỊM
1.500
1,000
500
0
■ Nevv eriterprises
> Nevv branrhps. Rpp ottirps
c hanging the contents of business Reg
im
Hm
um
I
I
2009
2010
2011
/»012
2013
1,741
1,610
13S5
1,040
965
142
138
128
108
96
1,995
;./Uj
1,f>97
l,s%
l , r>0S
Figure 2. Results at the Reception and Returning Result for Business
Registration Section of Yenbai Department «f Planninị> and Investment
1.2 Research question
How
is
the
relationship
bctwcen
public
satistaction?
5
Service
quality
and
custom er
What íactors have impact on customer satisíaction level about public Service
quality at Yenbai Department o f Planning and Invcslmcnt?
What are suggestions for improving public Service quality and increasing
customer satisíầction at Ycnbai Department o f Planning and Investment?
1.3
Research purpose and specific objectives
Purpose
The purposes o f this study arc to assess the public Service quality based OI1
opinions o f customers making transactions at Yenbai Department o f Planning and
Investment; to study on the relationship and factors affecting customer satisfaction;
to give suggestions and recom mendations to improve public Service quality at
Yenbai Department o f Planning and Investment.
Speciíic objectives
Examine fundamentally theoretical issues oí' Service, public Service, and
quality managem ent, quality management in public Service, customer and customer
satisfaction to have an overview on this issuc.
Collect and analyze survey data from customers using public services at
Ycnbai Department o f Planning and Investment.
(ìive somc suggestions to improve quality and efficicncy in public Service
performance tovvard higher customer satisfaction.
1.4Subjccts and scope o f the study
Subjects of the study
Public Service quality, customer satislaction vvhen using puhlic Services at
Yenbai Department o f Planning and Investment, and íactors aíìccting customer
satisfaction about public services performed hy Yenbai Department o f Planning and
Investment.
Scope o f the study
In terms o f space: The thesis focuses on studying public services períbrmed
by Yenbai Department o f Planning and Investment at Reception of receiving and
rcturning results for Business Rcgistration Section.
In te r m s o f time: s u rv e y time from July 2 0 1 4 to A u u u s t 2 0 1 4
6
Participants o f thc survey: custom ers who COI11C to make transactions at the
Rcccption o f rcceiving and retuming results ibr Business Rcgistration Section.
II. FRAM E OF R E FE R EN C E
2.1 Five gaps Service quality model
Parasuraman et al. (1985) arc the pioneers o f making specitìc and detail studies
on Service quality in marketing. These researchers proposed a five GAP model o f
Service quality.
G ap
1: is the difference betvveen consum ers’ expectation and managem ent’s
perceptions o f those expectations. For example, when customers do not know about
the Service, they may have strange expectations w hich may cause sigm ficant
diffcrent from m anagem ent’s pcrceptions.
C ap
2: is the difference between nianagement’s perceptions o f consum er’s
expectations and Service quality specifications. This gap results from constraints
and obstacles Service providers have to face when they try to convert their
perceptions
o f custom ers’ expectations
into
quality
speciíìcations
to
meet
customers’ expectations. These specifìcations will become marketing iníbrmation to
customcrs.
G a p 3: is the differcnce between Service quality spcciíìcations and Service actually
dclivercd; i.c. the Service perlbrmancc gap. This gap refers to the case vvhen
cm ployees deliver Service for custom ers but it is not m cct the defined criteria. The
rolc o f front linc staff is vcry important in creating quality services.
G a p 4: is the differcncc bctween Service delivery and thc information customer
reccived
about
Service
delivcry.
This
iníòrmation
may
make
increase
in
expectations hut also make decrcase in perceived quality when customcrs do not
received vvhat Service providers comm itted.
( ỉa p 5: is thc difference between consum er’s expectation and perceived Service.
Parasuraman et al. (19X5) stated that Service quality is Gap 5. This gap depends on
the above 4 Gaps.
7
Figure 3. Service qualitv model of Parasuraman
Parasuraman statcd thai Service qualily is a íunction o f Gap 5. (ìap 5depends
on the four previous gaps, namely Gap 1. Gap
2, Gap 3, and Gap 4.Thereíore, in
order to increase Service quality, Service managers should attcmpt to shorten this
gap.
Service quality model, in this study. can bc illustratcd as follows:
SỌ = F {G_5 = f(G J , G 2, G 3, Cì 4)Ị
Wherc: s ọ is Service quality;
G _1. Ci 2. G_3, and G_4 are Gap !, Gap 2, Gap 3, and Gap 4, respectively
8
2.2 Measuring Service (Ịuality: SER V Q U A L scalc
Service quality model o f Parasuraman ct al. (19sX) can bc considered as a
co m prehcn sive picture o f Service quality. Hovvever, tliis m odcl is conceptual and
needs a series o f studies to test this measuring scale. One o f the most important
studies is m easuring c u s to m e rs ’ perceivcd Service quality.
Parasuraman et al. (1988) have developed and tested the scale including 5
components o f Service quality. Finally, SERVỌUAL scale consists o f 21 observed
variables to nieasure 5 com ponents o f Service quality, namely:
1. Reliability: refers to ability to períorm Service dependably and accurately
righl at the íìrst time.
2. Responsiveness: refers to willingness and ready to provide services to
customers.
3. Competence: refers knoxvledge and skills o f cm ployces to períorm Service.
Thcsc mentioncd knovvledge and skills arc vcry important for cmployecs
w ho directly com m unicate with custom ers, provide Service, and affcct the
ability to capture relevant information needed for serving customers.
4. Empathy: refers to caring and attention towards each individual customer.
5. Tangiblcs: rcicrs to appcarance o f pcrsonnel and o ther physical faci 1Ìtics and
cquipmcnt for providing scrvices.
The tìvc Gap Service quality modcl and SHRVỌUAL scalc cover almost spcciíìc
attributes o f Service quality. Parasuraman ct ai. (1991,
1993) confm ned that
SKRVQUAL is a comprchensivc scalc measuring Service quality, with reasonable
reliability and validity, and can be applied in dilTerent Service types. However, each
diffcrent
Service
type
has
its ow n
characteristics,
so
there
may
be
som e
modiíìcations for the scale depending on specitìc type and market.
2.3 The studies applying SER V Q U A L and SER V PER F
Aíter many previous studies, S1ÌRVỌUAL has becn accepted as a valid scale in
theory
and
practice.
Hovvever, there
is
still
many
dcbated,
criticized
and
questionable issues about this scale especially in tcrms o f thc gencrality and the
accuracy. One more thing is that thc SHRVỌUAL mcasurcmcnt procedure is quite
9
complicated. Theretore, there is a modiíìcation o f SHRVỌUAL is SERVPERF
scalc.
This scale was introduced by Cronin & Taylor (1992, citeđ in Thongssamak, 2001),
dctìning Service quality by measuring only perccived quality o f Service (instead o f
measuring
both perccption and expectations as SERVQUAL).
This mcans,
according to SFRVPFRF:
Service Quality = Level of perceived quality
The authors stated that Service quality is the bcst reílected by perceived quality,
ncithcr including quality expectations nor asscssing thc wcight o f each compơncnts.
Ít is notice that to original from SERVỌUAL scale, components and observed
variablcs o f this SERVPERP scalc arc the same as in SHRVQUAL. This
measurement modcl is called Perception Model.
SERV PERF m odel o f Cronin & Taylor is used to evaluate the quality o f Service,
including 5 speciíìc íactors:
Table 2. SE R V PE R P scale
Keliability
1. When company X has promised to do something on a speciíic timc pcriod, the
com pany will perform.
2 VVhcn you has prohlem s, com p any X expressed sincere intcrest in solving
prohlcms.
3 Company X performeđ services right at the first timc.
4 Company X proviđes scrviccs cxactly as their promised timc.
5 Companỵ X notiíỵ to customers when thcir Service will bc done.
Responsiveness
6 Employees o f company X serves you 0 11 time.
7 Eniployces o f company X inform you exactly when services will he implementcd
X Employees o f company X are always willing to hclp you.
9 E tnployees o f co m p an y X is never too busy to responsc to your rcquirem cnts___
Assurancc
10 Employees o f company X can create trust towards the company for you.
11 You feel safe when making transactions with company X
12 Employees o f company X are alvvays polite and courteous with you.
13 Em ployecs ot companỵ X havc knovvleđge to answer your q u e s t i o n s . _______
Kmpathv
14 Company X has expressed attentions and cares to cach individual customer.
10
15 Com pany X has employees who cxprcsscd attcntions and carcs to cach
individual customcr.
16 Com pany X expressed special care custom ers’ conccrns.
17 Hmployees o f company X can understand your special nceds.
18 Company X has a convenient working time to you.
Tangibles
_______
__________
____
______
19 Company X has modcrn facilities and cquipmcnts.
20 Pacilities o f the company X looks very appealing.
21 Employees o f company X have neat and beautiful appearance.
22 The physical facilities supporting serving services in company X looks very
appealing.
(Source: Measuring Service Quality with SERVPERF)
2.4 Factors affectinị» public Service qualitv
Through synthesis o f previous research on Service quality and customer
satisfaction, this study examines several traditional scales as above. Hovvever, the
diiTerences in fíelds, regions, political - economic -
cullural characteristics,
perceptions ơ f c ili/e n s lead to the đifference in way to assess Service quality and
customer satisíầction.
This research aimeđ towards respondents who are using public scrvices
applied ISO standards at thc Department o f Planning and Investment o f Yenbai. As
an economic and political center o f Vietnam, with rclatively high literacy levels,
Ycnbai’s citi/.ens obcy to the law, State regulations as wcll as aware o f values and
tactors atTccting cu stom cr satisfaction. The study suggests that public Service
quality can hc aíTected hy following components:
1.
Rcliability
is customer expectations
about
implcmentation
com m itm ents made by State administrative agcncies for them in the process o f
pcrform ing public services. Based on previous studies, co m bining thc principles o f
applicd ISO standards, the authors used qualitative methods to dcvelop the tầctor
"Reliahility" includes the following criteria:
- The transparency o f administrativc procedurcs.
- Records vvith no eiTơrs or loss.
- Records do not miss deadlines.
11
o f the
- Being reliable place for customers when tlicy contact to resolve thc
administrative procedures.
2. Inírastructures supporting services includcs factors such as providing
Service area, equipm ent, tools and other technical íầcilities
especially equipment
in the reception area - vvhere people com e to contact vvith íro n t staff that represents
Ibr the administrative agcncics. Bascd on prcvious rcscarch combining vvith thc
principles o f ISO standards, the authors used qualitative methods to build factor
"Inữastructures" including the following criteria:
- Airy, clcan and spacious rooms.
- Comĩortable íacilities such as air conditioning, desk, chair...
-
Equipment
supporting
services
are
rclativcly
modcrn (automatic
Iiumbering, computers, and computers for records lookup ...)
- The layout o f thc area for receiving, Processing and returning results.
- The publishing o f administrativc procedures and tbrms.
3. Staffs’ competency, including the skills and proíessional knowledge to
accomplish the assigned tasks. This is a very important element which reflects the
quality o f thc public services. Based on previous research combining vvith the
principles o f ISO standards, the authors used qualitative methods to build factor
"Competency o f staíTs" including the following criteria:
- Communication skills.
- K n o w lc d g e and skills in handling works.
- Proficicncy in protessional tasks.
- T o reasonably solve the problem s o f custom crs.
- Resolving complaints o f customers quickly and rcasonably.
4. Regarding to attitude o f serving a Service, it is imporìant for public
servants to listen, be patient, speak clearly, have friendly attitude, and handle work
on timc. Bascd on prcvious rcscarch combining with thc principlcs o f ISO
standards, the authors used qualitative mcthods to build tactor "Attitude o f staffs"
including the following criteria:
- The attitudc whcn rccciving, Processing and retuming thc rcsults.
- Attitude when answering people's qucstions.
12
- T h e in c o n v e n ie n c e for p eo p le vvlien Processing records.
- The fair treatmcnt in all administrativc scrviccs transactions.
- Being high responsible for custom ers’ records.
5. E m pathy rcfers em p lo y ees’ attcntion to customers. This is the fundamental
rcquirem ent o f thc org an i/atio n which expresses commitment to dedicatedly serve
the pcople through íìnding thc right solution for cvcry situations to solvc custom crs’
rcquirements. Based on previous research combining with the principles o f ISO
standards, the authors used qualitative methods to builđ factor "Empathy" including
the following criteria:
- C ustom er can contact with staffs who are Processing their records.
- Handling rccords ílexibility and promptly.
- The attention o f the otTiccrs to rcasonablc requcsts o f the people.
- Staffs easily to understand the custom ers’ requirements.
6. Administrative proccdurcs, including rccords rcquircd when submittcd,
Processing the records, the period o f contact directly between staffs and customers.
This is m andatory principles o f ISO standards in which procedures must be
improved in the process o f applying. It is also an objective demand from the fact
that administrative procedures arc cumbersome under ovcrlapping rcgulations, so
im p ro v in g p ro c c d u rc s is an im portant requirem ent with thc purposc to improvc
Service quality. U sin g qu alitativ e m cthods, the autlior builds factor "proceđures"
mcluding thc following criteria:
- Rcqucst for rcasonable list o f documents.
- Tim e to handling docum ents following publishcd procedures is suitablc.
- Procedures, Processing steps reasonably records.
- The law on administrative procedures is rcasonable.
III. R E S E A R C H M E T H O D O L O G Y
3.1
R esearch niodcl
Bascd on
qualitative research,
studying on customcr satisfaction model,
invcstigating thc rclationships bctwccn scrvicc quality and customcr satisfaction
through research models o f Parasuraman and Spreng - Mackoy, the components o f
13
S ervice
quality proposed by Parasuraman and SOI1 K' other authors, this study
proposed theoretical model with following hypotheses.
T ran sp arenc y (TR )
Attitude o f staffs (A T)
A dm inistrativc p roccdures (PR)
C o m p c te n c y o f s t a f f s (CO)
Hmpathy o t staíTs (E M )
In ữ astru c tu res (IN F R )
Figure 4. Research model
Hypotheses:
III:
Procedures
have
signiíìcantly
positivc impact
on
custoiner
satisfaction
H2: Attilude oi' staíls has signiíìcantly positive impact on customer
satisíaction
H3: Competcncy o f staíĩs has significantly positive impact on customer
satisfaction
114: Empathy has signitlcantly positive impact on customer satisfaction
115
Inữaslructurcs havc significantly positive impact on
customcr
satisíaction
H6:
Transparency
has
signiíìcantly
positivc impact
on
customer
satisfaction
3.2 D iscu ss r ele v a n c e o f research m od el in p u b lic secto r
From experts’ ideas in Service quality and customcr satisfaction rescarching
íìelds, we develop corc ideas vvith basic survcv to implement into public sector,
for some explanations:
Public sector providcs public services so that the relationship in this case
is still betvveen Service provider and customer.
14
In a n o th cr h ands, the relationship betvvcen thc civil servant w ho \vorking
for public organization and customcrs vvho arc citi/.ens or reprcsentativc
o f another organization, in generally, is relatiơnship o f human to human.
Kinally, from the ữ a m e o f references wc have interview somc leadcrs,
civil servants and some people involve into the topic research, in
Appcndix 2 and Appcndix 3 The rcsults rctlcctcd the suitahle of tactors
(d im en sion s) to investigate the relationship betvveen public Service
quality and custom er satisfaction.
In con clu sion , troni thesc reasons the rescarch modcl is relevant for \vorking on
our m aster thesis.
3.3 M ethodology
3.3.1
Research m ethodology
Preliminary research was conducted using qualitativc methods through lcgal
documents, direct interviews with experts in the field o f puhlic administration
managem ent (A ppendix 2, 3). This stage o f study aims to explore íactors atTecting
satisíầction, as well as the ohserved variables used to measure these factors. Then,
we design a research modcl which is suitablc tbr Yenbai city context and a
questionnaire
for quantitative research. The qucstionnairc designing will hc
consulted by expcrts in
cỊuality
m anagcmcnt and quality rcprcscnlatives o f Yenbai
Department of' Planning and Investment before conducting a formal survey.
The forrnal rescarch uses quantitative approach through qucstionnairc survcy. Time
to collect data is from July 15lh 2015 to August 15th 2014 at the receiving and
retum ing docum ents section o f Yenbai Department o f Planning and ỉnvestment.
The purposes o f this study are to valid the scale. to determine the importance of
each Service quality factors, to m e a su re cu stom er satisfaction as vvcll as to test the
hypothesis stated in the previous section.
3.3.2
Research proccss
The study will be conducted in two phases including preliminary research and
formal research, as followed:
15