Bioaccumulation and risk assessment of per and polyfluoroalkyl substances in wild freshwater fish from rivers in the pearl river delta region, south china (1)
Bạn đang xem bản rút gọn của tài liệu. Xem và tải ngay bản đầy đủ của tài liệu tại đây (640.79 KB, 8 trang )
Ecotoxicology and Environmental Safety 107 (2014) 192–199
Contents lists available at ScienceDirect
Ecotoxicology and Environmental Safety
journal homepage: www.elsevier.com/locate/ecoenv
Bioaccumulation and risk assessment of per- and polyfluoroalkyl
substances in wild freshwater fish from rivers
in the Pearl River Delta region, South China
Chang-Gui Pan, Jian-Liang Zhao, You-Sheng Liu, Qian-Qian Zhang, Zhi-Feng Chen,
Hua-Jie Lai, Feng-Jiao Peng, Shuang-Shuang Liu, Guang-Guo Ying n
State Key Laboratory of Organic Geochemistry, Guangzhou Institute of Geochemistry, Chinese Academy of Sciences, Guangzhou 510640, China
art ic l e i nf o
a b s t r a c t
Article history:
Received 20 March 2014
Received in revised form
29 May 2014
Accepted 29 May 2014
Per- and polyfluoroalkyl substances (PFASs) are used in various industries, which results in their
ubiquitous occurrence in the environment. This study determined the concentrations of eighteen PFASs
in muscle and liver of nine wild freshwater fish species collected from rivers in the Pearl River Delta
(PRD) region, South China, and assessed their bioaccumulation and potential health risks to local people.
The results showed that eight and twelve PFASs were detected in the fish muscle and liver samples,
respectively. Perfluorooctane sulfonate (PFOS) was found to be the predominant PFAS both in muscle
and liver with its highest concentrations of 79 ng/g wet weight (ww) in muscle and 1500 ng/g ww in
liver, followed by Perfluoroundecanoic acid (PFUnDA) and Perfluorotridecanoic acid (PFTrDA) with trace
concentrations. The mean PFOS concentrations in fish muscle and liver tissues of the nine collected
species ranged from 0.40 ng/g in mud carp to 25 ng/g in snakehead, and from 5.6 ng/g in mud carp to
1100 ng/g in snakehead, respectively. Significant positive correlations were found among PFASs both in
water and fish, indicating a similar pollution source for these PFASs. In tilapia samples, PFOS
concentrations showed an increasing trend with increasing length and weight, but no significant
difference between genders. Bioaccumulation factors (log BAF) in fish for the PFASs were in the range
from 2.1 to 5.0. The calculated hazard ratios (HR) of PFOS for all fishes were in the range of 0.05–2.8, with
four out of nine species (tilapia, chub, leather catfish and snakehead) having their HR values more than
1.0. The results suggest that frequent consumption of these four fish species may pose health risks to
local population.
& 2014 Elsevier Inc. All rights reserved.
Keywords:
PFASs
PFOS
Fish
Bioaccumulation
Risk assessment
1. Introduction
Per- and polyfluoroalkyl substances (PFASs), including perfluorinated carboxylates (PFCAs) and sulfonates (PFSAs), are a
class of man-made organic chemicals widely used in industrial
applications, such as carpet, metal plating, fire-fighting foams,
semiconductor and food packaging, paper and other areas since
the mid-20th century (Key et al., 1997; Giesy and Kannan, 2001;
Moody and Field, 2000; Lewandowski et al., 2006). After almost a
half century use, Giesy and Kannan (2001) first reported the
occurrence of PFASs in wildlife, and this raised great concern over
scientific community. Subsequently, high bioaccumulation was
observed in biota for this group of chemicals; for example, a
n
Corresponding author. Fax: þ86 20 8529 0200.
E-mail addresses: ,
(G.-G. Ying).
/>0147-6513/& 2014 Elsevier Inc. All rights reserved.
bioaccumulation factors (BAF) of 23,000 was found for perfluoron-tridecanoic acid (PFTrDA) in rainbow trout under laboratory
exposure conditons (Martin et al., 2003). Meanwhile, adverse
effects including hepatotoxicity, developmental toxicity, immunotoxicity and hormonal effects in animals have been proven
because of exposure to PFASs (Lau et al., 2007; Peters and
Gonzalez, 2011). As of their unique physicochemical properties
and persistence, bioaccumulation (biomagnification) and toxic
properties (PBT), ever since then, large amount of studies on
PFASs especially PFOS and PFOA have been performed worldwide
mainly on their occurrence and toxicity. Because of the properties
of high solubility of PFASs, most of this group of chemicals would
exist mainly in water phase, but some of PFASs could accumulate
in fish. It proved ubiquity of this group of chemicals with ng/L
levels in surface water (Hansen et al., 2002; Hong et al., 2013), ng/g
levels in biota (Giesy and Kannan, 2001; Tao et al., 2006; Bloom
et al., 2009), and ng/mL levels in human serum (Hansen et al., 2001).
As a result, PFOS and its related chemicals were phased out in the
C.-G. Pan et al. / Ecotoxicology and Environmental Safety 107 (2014) 192–199
United States in 2002, and listed to Annex B of Stockholm
Convention which restricted its production and use worldwide
UNEP (2009).
Previous studies have reported that air, drinking water, indoor
dust and food are the primary pathways for human exposure to
PFASs (Fromme et al., 2009;Vestergren and Cousins, 2009; Zhang
et al., 2011; Knobeloch et al., 2012). Food consumption is believed
to be the major pathway for human exposure to PFASs, contributing more than 60 percent of total lifetime exposure (Tittlemier
et al., 2007). In particular, fish has been suggested as the most
important source of PFASs exposed to humans through dietary
route (Haug et al., 2010).
China is the largest fish production country, with the production volume of 47.5 million tons in 2008, and wild fish (14.8
million tons) accounted for 31.2 percent of the total production
(Food and Agriculture Organization of the United Nations, 2010).
As a highly urbanized region of the Pearl River Delta (PRD), it
would consume more fish than other regions. Kannan et al. (1997)
reported that in the PRD, consumption of contaminated fish is one
of the major pathways for human exposure to organic pollutants.
However, no large-scale study focusing on PFASs in wild freshwater fish samples has been performed in China until now.
Moreover, there is scarce information on the risks of PFASs
exposure via wild fish consumption in China, especially in the
PRD region.
The objectives of this study were: (1) to investigate the contamination levels and profiles of eighteen PFASs (11 PFCAs, 5 PFSAs, 1
perfluoro-1-octansulfonamide (PFOSA) and 1N-ethylperfluoro-1octanesulfonamido acetic acid (N-EtFOSAA)) in different fish species
collected from rivers of the PRD region; (2) to evaluate the gender-,
body weight- and length-related PFASs bioaccumulation in a model
fish species (tilapia); and (3) to assess the potential risks of local
people exposure to PFASs through fish consumption. The results
from this study can help better understand the contamination of
PFASs in the rivers of the PRD region and assist local governments to
better manage the exposure risks.
2. Materials and methods
2.1. Chemical and reagents
Eighteen PFASs were examined in this investigation, with their full names,
abbreviations and formula being given in Table S1. Purities of all the analytical
standards were more than 95 percent. PFBA, PFPeA and PFHXA were purchased
from J&K Company (Guangzhou, China), Acros Organics (Geel, Belgium) and Tokyo
Chemical Industries (Portland, OR, USA), respectively. PFOA and PFOS were
obtained from Accustandard (New Haven, USA). PFHpA, PFNA, PFDA, PFDODA and
PFTeDA were acquired from Alfa Aesar (Ward Hill, MA, USA), while PFUnDA,
PFTrDA, PFBS and PFHXS were obtained from Sigma-Aldrich (St. Louis, USA). PFHpS,
PFDS, N-EtFOSAA and internal standards (MPFHXA (13C2-PFHXA), MPFOA (13C4PFOA), MPFNA (13C5-PFNA), MPFDA (13C2-PFDA), MPFHXS (18O2-PFHXS), and MPFOS
(13C4-PFOS)) were bought from Wellington laboratories (Guelph, ON, Canada). LC–
MS grade ammonium acetate ( 4 99 percent) was purchased from CNW (Dusseldorf, Germany). Potassium hydroxide was obtained from Sigma-Aldrich (St. Louis,
MO, USA). Ammonium hydroxide (10 percent) and acetic acid were bought from
Fluka (Germany). HPLC grade methanol (MeOH) was purchased from Merck
Corporation (Darmstadt, Germany). The cartridges used for purification were Oasis
WAX cartridges (150 mg sorbent, 6 mL size) from Waters (Milford, MA, USA).
Ultrapure water was supplied by a Milli-Q system from Millipore (Watford, UK).
Individual stock solutions of the target analytes and internal standards were
prepared in methanol and stored in polypropylene (PP) bottles at À 18 1C.
2.2. Sample collection and sample pretreatment
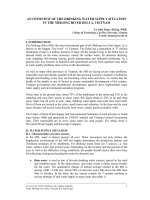
The study area is shown in Fig. 1, which lists the location of sampling sites in
the rivers of the PRD, South China. Fish samples were collected by electroshocking
and netting from 11 monitoring sites in the year of 2011–2012. Surface water
samples were also collected for two seasons at the same time. Three replicate water
samples were collected from each site in each season using a clean stainless steel
bucket or polypropylene containers and stored in polypropylene containers with
193
narrow mouths and screw tops. Detailed information about the sampling sites and
collected fish species are given in Table 1. The collected fish species in this study
included tilapia (Tilapia aurea), crucian carp (Carassius auratus), common carp
(Cyprinus carpio), leather catfish (Clarias fuscus), snakehead (Ophicephalus argus),
grass carp (Ctenopharynodon idellus), chub (Hypophthalmichthys molitrix), mud carp
(Cirrhinus molitorella), and bream (Parabramis pekinensis). All the collected fish
samples were kept alive in cold water with oxygen supply and immediately
transported to the laboratory after collection. Once arrived in the laboratory, those
fish were anaesthetized and skins were removed, and the muscle samples were cut
into small pieces. And only muscle and liver samples were used for this study. Each
fish sample was individually wrapped in aluminum foil and then put in polyethylene bags. Then the muscle tissues were freeze-dried, ground to fine powder,
wrapped in aluminum foil and stored at À 18 1C until extraction. Liver samples
were wrapped in aluminum foil directly and stored at À 18 1C until extraction.
2.3. Sample extraction
The collected water samples were filtered using glass fiber filters (GFF, Whatman, O.D. 47 mm, 0.7 μm), stored in a cold room at 4 1C in darkness and extracted
within five days. The water samples (500 mL each) were extracted by solid phase
extraction (SPE) using Waters Oasis WAX Cartridges, which is adopted from a
previous reported method (Taniyasu et al., 2005), with addition of the internal
standards mixture (5 ng each) prior to extraction. Two different extraction methods
(alkaline digestion and ion-pairing methods) were used for the extraction of
muscle and liver samples in this study, respectively. For the muscle samples, a
previous reported alkaline digestion method was used in the extraction (Taniyasu
et al., 2005). In brief, 0.2 g of each dried muscle sample (approximately 1.0 g wet
sample) was weighed into a 50 mL PP centrifuge tube, followed by addition of 5 ng
of each internal standard. Then 10 mL of 10 mM KOH in methanol was added to the
tube, which was shaken at 250 rpm for 16 h. After digestion and centrifugation, the
supernatant was transferred to a 250 mL PP bottle and diluted to 200 mL with
Milli-Q water, which was used for purification with an Oasis WAX cartridge. The
cartridge was pre-conditioned with 4 mL 0.1 percent NH4OH in MeOH, 4 mL MeOH
and 4 mL Milli-Q water. After loading, the target compounds were eluted from the
cartridge with 4 mL MeOH and 4 mL 0.1 percent NH4OH in MeOH. Then the eluate
was brought to dryness under a gentle stream of nitrogen, and then reconstituted
in 500 μL methanol. The final extract was filtered through a 0.22 μm nylon filter
into a 1 mL PP snap top vial with a polyethylene (PE) cap and stored in À 18 1C until
analysis.
For the liver samples, the ion-pairing liquid extraction method was applied in
this study for PFASs as described elsewhere (Yeung et al., 2006). Briefly, 0.2 to 0.5 g
of each wet liver sample was weighed into a 50 mL PP tube and homogenized by
IKA T10 basic ULTRA-TUTTAX homogenizer (Germany) at 30,000 rpm with 2 mL
Milli-Q water, 2 mL of 0.25 M sodium carbonate buffer and 1 mL of 0.5 M
tetrabutylammonium hydrogen sulfate (TBAHS) solution. After completely homogenized, the PP tube was vigorously shaken for 5 min for extraction. After thorough
mixing, 5 mL of methyl-tert-butyl ether (MTBE) was added into the tube, and the
mixture was shaken again for 20 min. The organic and aqueous layers were
separated by centrifugation at 3500g for 20 min, and an exact volume of 4 mL of
MTBE was transferred into a 10 mL PP tube. Another 5 mL of MTBE was added into
the remnant aqueous mixture again, followed by shaking and centrifuging with the
above conditions, the supernatant was combined with the first one in the 10 mL PP
tube. The MTBE extract was allowed to evaporate to dry under nitrogen and
reconstituted in 500 μL of methanol. The final extract was filtered through a
0.22 μm nylon filter into a 1 mL PP snap top vial with a PE cap and stored in À 18 1C
until analysis.
2.4. Chemical analysis
High performance liquid chromatography–tandem mass spectrometry (LC–MS/
MS) was used to determine the concentrations of the target PFASs in the extracts.
The instrument used in the analysis was an Agilent 1200 HPLC system interfaced to
an Agilent 6460 Triple Quadrupole mass spectrometer that was operated under
electrospray negative ionization (ESI-) mode. A 5 μL aliquot of each sample extract
was injected into the instrument. The target compounds were separated on a
Betasil C18 column (2.1 mm i.d. Â 50 mm length, 5 μm; Thermo Hypersil-Keystone,
Bellefonte, PA, USA) with a pre-column (2.1 mm, 0.2 μm; Agilent Technologies). The
mobile phase used consisted of 2 mM ammonium acetate aqueous solution
(solvent A) and methanol (solvent B) at a flow rate of 250 μL/min. The gradient
program of the mobile phase was given as follows: 10 percent B at 0 min,
increasing linearly to 35 percent B at 0.1 min, 55 percent B at 7 min, and finally
to 95 percent B at 17 min and kept for 1 min, then reversing to 10 percent B at
20 min. The capillary voltage was held at 3500 V. Dry and sheath gas flows were
maintained at 6 and 12 L/min, respectively. Dry and sheath temperatures were kept
at 325 and 350 1C, respectively. The mass spectrometer was operated under
multiple reaction monitoring (MRM) mode. The MS/MS mass transition, fragmentor and collision energy of each compound are listed in Table S1.
194
C.-G. Pan et al. / Ecotoxicology and Environmental Safety 107 (2014) 192–199
E114°00’
E114°30 ’
E115°00’
N
S11
S10
S6
S7
S5
S4
Xizhijiang river
Huizhou city
Dongguan city
N23°24’
S8
N23°00’
S3
S9
Sampling site
Water flow
City
S2
S1
WWTP
25KM
N22°43’
Shenzhen city
Fig. 1. Location map of the sampling sites in the rivers of the Pearl River Delta (PRD) region, South China.
2.5. Quality control and method performance
Quantitative analysis was performed under MRM mode with the internal standard
method Quality assurance/quality control (QA/QC) procedures were followed during
the sampling, extraction and analysis. Teflon coated labware and glassware were
avoided during the whole process of sampling, pretreatment and analysis to minimize
contamination of the samples. PFASs standards, extracts and samples should avoid
contacting with any glass containers as these analytes can potentially adsorb to glass
surfaces. To reduce instrumental background contamination arising from HPLC or
solvents, a ZORBAX SB-Aq trap column (Agilent technologies, 50 Â 4.6 mm, 3.5 μm
particle size) was inserted in the water-eluent line, immediately above the solventmixing cell. Blanks and control samples were run every 7 samples to check for any
carryover, background contamination, precision and accuracy of the recovery. The limit
of detection (LOD) and limit of quantification (LOQ) of each target compound were
defined as 3 and 10 times the signal to noise ratio (S/N), which was calculated by
Agilent Masshunter qualitative software. The LOD and LOQ and recoveries of each PFAS
in fish tissue and water are given in Table S2.
2.6. Statistical analysis
The concentrations below LOQ were assigned as zero during the calculations.
The difference of PFOS concentrations in nine fish species was performed by
Kruskal–Wallis H test. A Pearson's correlation analysis was used to examine
possible correlations among various PFASs in fish samples. A one-way ANOVA
was used to investigate the relationships of PFASs between different fish genders,
lengths and weights. All statistical analyses were performed by using the SPSS
software (Version 18.0 for windows, SPSS Incorporate, Chicago, IL). Statistical
significance was accepted at p o 0.05.
3. Results and discussion
3.1. Concentrations of PFASs in water and fish
Surface water and fish samples from 11 sites were analyzed for
the PFASs, and the concentrations of the PFASs are presented in
Table S3 and Fig. 2, respectively. PFOS was the predominant PFAS
compound measured in water with the mean concentrations
ranging from 0.17 ng/L at the site S8 to 290 ng/L at the site S1.
PFOA was the second predominant PFAS compound with the mean
concentrations ranging from 0.21 ng/L at S8 to 22 ng/L at S3. The
PFASs with short carbon chains (C4–C9) had much higher detection frequencies and concentrations than those of long carbon
chains (C10–C14) (Table S3). Similar contamination patterns for
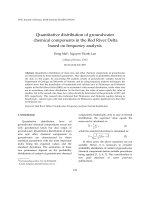
total PFASs in fish were observed for both muscle and liver
samples in the eleven sites (Fig. 2). The concentrations for the
eighteen PFASs in fish samples at each site are summarized in
Tables S4 and S5. For all the muscle samples (n ¼141) and liver
samples (n¼ 125), the eight long chain PFASs (C Z8) (PFOS, PFNA,
PFDA, PFUnDA, PFOSA, PFDoDA, PFTrDA, and PFTeDA) were
detected with their detection frequencies mostly exceeding 80
percent, whereas the five short chain PFASs (C o8) (PFBA, PFPeA,
PFBS, PFHxA, and PFHxS) were not detected.
PFOS was the predominant compound in both fish muscle and
liver, followed by PFUnDA, PFTrDA and PFDA. PFOS contributed 90
percent to the total PFASs in muscle and 92 percent in liver (Fig.
S1). The concentrations of PFOS in fish muscle and liver were
significantly correlated with its aqueous concentrations (Fig. S2).
The highest mean concentration of PFOS in muscle (40 ng/g ww)
was observed at S2 (an urban site of Danshui River), which also
showed the highest PFOS concentration in surface water. The
lowest PFOS mean concentrations (0.26 ng/g ww) in fish muscle
was found at S8, which is located in the upstream of the Xizhijiang
River. A similar PFOS concentration pattern was also observed for
the liver samples, with the highest concentration site at S3 (Fig. 2),
which is also located in the Danshui River.
Among the collected nine fish species, the highest PFOS
concentrations in muscle and in liver were found in snakehead
at 25 ng/g and 1100 ng/g ww. The lowest mean concentrations
were found in mud carp at 0.43 ng/g in muscle and 5.6 ng/g in
liver, which were nearly 60-fold and 200-fold lower than those in
snakehead (Table S4 and S5). Significant differences in PFOS
concentrations were observed for most fish species (p o0.05)
(Table S4 and S6). In the nine fish species, the mean concentrations
(ng/g) of PFOS in muscle and liver had the following increasing
trend: mud carp ograss carp obream ocrucian carpo common
C.-G. Pan et al. / Ecotoxicology and Environmental Safety 107 (2014) 192–199
195
Table 1
Basic information of the sampling sites and collected fish.
Sites
Geographic location (N, E)
No. of samples
Species
Length (cm)
Weight (g)
S1
S2
S3
1141260 24″ 221440 42″
1141270 13″ 221470 59″
1141290 28″ 221560 38″
S4
1141640 68″ 221970 73″
S5
1141270 48″ 231030 10″
S6
1141210 42″ 231080 53″
S7
1141270 19″ 231100 51″
S8
1141940 39″ 231030 41″
S9
S10
S11
1141070 34″ 221910 28″
1141080 26″ 231060 19″
1141090 16″ 231070 72″
4
20
19
4
3
7
5
2
4
5
2
1
3
2
7
2
9
3
1
4
3
6
3
3
12
1
1
1
4
Tilapia
Tilapia
Tilapia
Snakehead
Leather catfish
Grass carp
Crucian carp
Common carp
Tilapia
Chub
Crucian carp
Common carp
Tilapia
Chub
Crucian carp
Common carp
Tilapia
Grass carp
Chub
Crucian carp
Tilapia
Common carp
Mud carp
Tilapia
Tilapia
Tilapia
Chub
Common carp
Bream
11.9–15.3
11.5–27
16–27
26–28
31.6–34.8
19–33
12–20.6
21–30.3
14–21
26–40
19.6–23.5
36
14.4–18.7
33–38
12.6–21.5
35–39.5
11.5–22
25.4–27.0
31
17.5–21.1
13–20
23.4–30
21.7–27.7
12.5–14.7
11.3–21.5
23
41.5
34
24.5–30
75.2–150.5
70–640
150–580
192–268.8
249.9–350.8
100–625
90–270
270–1020
80–260
270–1240
300–400
1350
120–250
660–740
90–410
1350–2700
125–280
320–340
580
230–290
90–300
380–620
175–516
80–145
65–300
490
1550
720
300–550
45
Concentration (ng/g ww)
40
Muscle
35
30
25
20
15
10
5
0
S1
Concentration (ng/g ww)
500
S2
S3
S4
S5
S6
S7
S8
S9
S10 S11
PFTeDA
PFTrDA
PFDoDA
PFOSA
PFUnDA
PFDS
N-EtFOSAA
PFDA
PFOS
PFNA
PFHpS
PFOA
PFHxS
PFHpA
PFHxA
PFBS
PFPeA
PFBA
Liver
400
300
200
100
0
S1
S2
S3
S4
S5
S6
S7
S8
S9
S10 S11
Sampling sites
Fig. 2. The PFASs concentrations in muscle and liver of fish from the sampling sites
of the PRD rivers.
carpo tilapia ochub oleather catfishosnakehead in muscle, and
mud carpobreamocrucian carp ograss carpocommon carp ochub otilapia oleather catfisho snakehead in liver.
PFUnDA was the second dominant PFAS, with its concentrations ranging from o0.03 to 2.4 ng/g and a mean concentration of
0.38 ng/g in muscle, and from o0.12 to 57 ng/g with a mean
concentration of 6.3 ng/g in liver. PFUnDA contributed 3 percent to
the total PFASs in both muscle and liver. PFTrDA is the third largest
contributor in both muscle and liver, with concentrations ranging
from o0.03–1.1 ng/g to 0.27–22 ng/g, and contributed only 2
percent and 1 percent to the total PFASs, respectively (Table S4).
The relative higher concentrations of these two long chain PFCAs
in fish could be due to their relatively higher bioaccumultive
ability, higher concentrations in water and site-specific or fish
species-specific bioaccumulation properties (Table S3).
Some previous studies have also reported the occurrence of
PFOS in fish globally with the concentrations ranging from a few
ng/g to thousands ng/g level (Senthilkumar et al., 2007; Delinsky
et al., 2010; Berger et al., 2009; Quinete et al., 2009; Becker et al.,
2010; Schuetze et al., 2010; Labadie and Chevreuil, 2011; Malinsky
et al., 2011; Murakami et al., 2011; Zhang et al., 2011; Shi et al.,
2012; Hloušková et al., 2013), and a comparison of PFOS concentrations in fish is presented in Table S7. In general, the concentrations of PFOS in fish muscle of this region ( o0.03–79 ng/g) are
higher than those reported in fish from most Asian countries, such
as Vietnam, Malaysia and Beijing of north China, where its
concentrations ranged from 0.20 to 2.3 ng/g, and were almost at
the same level with those in most European countries, such as
Sweden, Czech and Germany (0.97–23 ng/g). But the PFOS concentrations from the present study were much lower than the fish
from the Mississippi River (28.5–382 ng/g) and Minnesota Rivers
near 3 M Company (Former biggest fluorochemical plant), where
the maximum concentration in muscle was as high as 2000 ng/g.
In fish liver, the PFOS concentrations (0.95–1500 ng/g) in the
present study were higher than in those in Japan, Vietnam
Malaysia and Germany with the concentrations ranging from
2.35 to 123 ng/g ww (Becker et al., 2010; Murakami et al., 2011).
The varied concentrations of PFASs measured in fish species at
different sites in the present study can be explained by various
factors such as the different PFASs concentrations in water,
196
C.-G. Pan et al. / Ecotoxicology and Environmental Safety 107 (2014) 192–199
different chemical properties, species-specific bioaccumulation
characteristics and different dietary habitat.
3.2. Tissue distribution
The present study clearly showed higher PFASs concentrations
in liver than in muscle of fish (Fig. 2). This is in good agreement
with previous studies performed on various fish species such as
rainbow trout, grass carp, common carp, snakehead, and tilapia
(Martin et al., 2003; Becker et al., 2010; Shi et al., 2012). This
phenomenon might be explained by the high binding affinity of
PFASs for liver fatty acid-binding protein (Luebker et al., 2002).
The ratios of PFASs in liver to muscle of fish can be calculated to
assess the accumulation of PFASs. The liver/muscle concentration
ratios for PFOS were found to range from 6.9 in crucian carp to 42
in snakehead, which are lower than the value of 61.5 in Chinese
sturgeon (Peng et al., 2010) and basically at a similar level to the
value of 10 in fish from Mediterranean Sea (Nania et al., 2009) and
9.5 for chub from Roter Main River in Bayreuth, Germany (Becker
et al., 2010). The mean liver/muscle ratios for PFDA, PFUnDA,
PFDoDA, PFTrDA and PFTeDA in the present study were 3.0–23,
5.0–30, 3.7–32, 2.8–25 and 2.0–34, respectively. These values are
found lower than those for PFOS, which is consistent with a
previous report by Shi et al. (2012), indicating that PFOS has a
stronger accumulation potential in liver when compared with the
PFCAs. A significant positive correlation was found for PFOS
concentrations between liver and muscle of all fish (r ¼0.759,
p o0.001), so did the other detected PFASs. The liver/muscle
concentration ratios of PFOS followed the order: crucian carp obreamo mud carpo chubotilapia ocommon carpo leather catfishograss carp osnakehead.
Pearson's correlation analysis showed significant correlations
among most PFASs found both in muscle and liver (Table S8). For
example, PFOS was positively correlated with some other compounds (PFHpS, PFDA, PFDS, PFDoDA, PFUnDA, PFTrDA and
PFTeDA), thus PFOS could be used as an indicator compound for
other PFASs. This relationship was also found in previous studies
(Yeung et al., 2006; Powley et al., 2008;). This may also indicate
similar pollution sources for these compounds (So et al., 2007).
3.3. Gender-, length- and weight-related PFASs bioaccumulation
in tilapia
Tilapia was the most abundant fish investigated in this study
(n ¼78). Thus a detailed analysis was performed for possible
gender-, length- and weight-related accumulation of PFASs in
tilapia. The PFASs concentrations in muscle were grouped by
gender (31 female and 31 male), length (o 15 cm, 15–20 cm,
420 cm), and weight (o 150 g, 150–260 g, 4 260 g). Since some
tilapia's gender was not identified, the total gender samples were
less than the total number of tilapia. One-way ANOVA analysis was
applied for gender, length and weight-related PFASs bioaccumulation data. The relationships of individual PFAS concentrations in
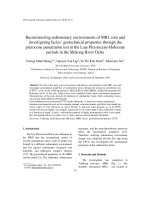
tilapia by gender, length and weight are shown in Fig. 3.
In muscle, male tilapia had significantly higher PFTeDA concentrations than females (p ¼0.015), but no significant differences
were observed for other PFASs P. In liver, PFNA and PFDS had
significantly higher concentrations in males than females, and no
significant differences were observed for the other PFASs. This is
consistent with some previous studies on PFOS concentrations
between genders with no significant correlations being identified
between males and females of harbor seals and harbor porpoises,
respectively (Kannan et al., 2002; Keller et al., 2005; Van de Vijver
et al., 2007; Ahrens et al., 2009). However, Kannan et al. (2005)
found that PFOS concentrations in male snapping turtles were
higher than females, but Van de Vijver et al. (2003) found higher
PFOS concentrations in female harbor porpoises.
As shown in Fig. 3, the concentrations of PFOS, PFUnDA and
PFOSA in muscle gradually increased with length (p o0.05). In
liver, the concentrations of PFOS, PFOSA and PFTeDA gradually
increased with length (po 0.05).
The weight related PFASs bioaccumulation patterns were found
for two PFASs in muscle and 5 PFASs liver. The concentrations of
PFOS and PFUnDA in muscle significantly increased with the
weight (p o0.05), and PFOS, PFUnDA, PFDoDA, PFTrDA and PFTeDA
in liver significantly increased with weight (p o0.05). PFOS concentrations increased dramatically from o150 g group to 150–
260 g group (Fig. 3). The length- and weight-related PFASs
bioaccumulation in fish could be due to ingestion of more food
by the larger body fish or different diets for larger individuals.
3.4. Bioaccumulation factors (BAFs) of PFASs
Bioaccumulation factors were calculated based on the concentrations of PFASs in tissue and water (Table S9). According to the
current data, the BAF values were calculated for individual PFASs if
available. Since only PFASAs with more than nine perfluoroalky
carbons, and only one sulfonate PFOS were detected in muscle, the
BAFs for the other short chain PFASs were not calculated and these
compounds are considered to have no bioaccumulation ability.
Log BAFmuscle for the collected fish ranged from 1.8 of PFNA
(snakehead) to 3.5 of PFUnDA (snakehead). The mean log BAFmuscle
of PFOS in the nine fish species was in the range of 2.7–3.4,
whereas the log BAF of PFOA with eight carbons was not calculated
as it was not detected in the muscle samples. For all fish species,
the log BAF increased with increasing carbon-chain length (Fig. 4).
For longer-chain PFASAs, their log BAFliver values were equal to
or greater than that of PFOS (Fig. 4). This is consistent with the
trend observed in wild aquatic organisms in the Great Lakes and
chub from Orge River (Kannan et al., 2005; Labadie and Chevreuil,
2011). The log BAFmuscle values for PFOS (2.7–3.4) were lower than
those observed for European chub (3.7) (Becker et al., 2010),
European eel (3.5) (Kwadijk et al., 2010) and Lake trout (3.8–4.4)
(Furdui et al., 2007). This could be explained by site or speciesspecific behaviors or different dietary habits.
In the liver samples, only those PFASAs with more than eight
perfluoroalkyl carbons, and PFSAs with more than seven perfluoroalky carbons were detected. Log BAFliver ranged from 2.2 for PFOA
(leather fish) to 5.0 for PFUnDA (snakehead). The mean log BAFliver
of PFOS in nine fish species was in the range of 3.5–4.6, which are
approximately one log unit higher than in muscle. The log BAFliver
of PFOS is at the same level as that found by Labadie and
Chevreuil. (2011) for European chub with log BAFliver of 4.3 and
slightly higher than that for rainbow trout (log BAFliver ¼ 3.7)
(Martin et al., 2003).
The positive correlations between the log BAF values of PFASs
and the length of the perfluoroalkyl chain (p o0.05, r2 40.93)
found in the present study (Fig. 4) are consistent with some
previous studies (Martin et al., 2003; Hart et al., 2008; Kelly et al.,
2009; Kwadijk et al., 2010; Labadie and Chevreuil, 2011). PFASs
with longer carbon chain exhibit higher protein water partition
coefficients (Kpw), thus resulting in higher bioaccumulative ability
for the long-chain PFASs (Kelly et al., 2009).
3.5. Risk assessment through fish consumption
As demonstrated previously, food consumption, especially fish
consumption is a major pathway for human exposure to PFASs
(Falandysz et al., 2006; Ericson et al., 2008; Fromme et al., 2009;
Berger et al., 2009; Haug et al., 2010; Schuetze et al., 2010; Zhang
et al., 2011). To assess the potential health risks to human,
C.-G. Pan et al. / Ecotoxicology and Environmental Safety 107 (2014) 192–199
30
Muscle
600
Female (n=31)
Male (n=31)
400
20
15
10
2
1
0
15
0
PF
< 15cm (n=27)
15-20 cm (n=25)
> 20 cm (n=26)
Concentration (ng/g ww)
Concentration (ng/g ww)
Muscle
2
1
0
600
400
200
120
25
10
Liver
< 15 cm (n=18)
15-20 cm (n=17)
>20 cm (n=21)
0
Muscle
PF
600
< 150 g (n=26)
150-260 g (n=25)
> 260 g (n=27)
400
Concentration (ng/g ww)
Concentration (ng/g ww)
20
S S S
A A A
A
A
Hp PFO PFD FOAPFN PFD OSAUnDAFOSDoDATrDATeD
P
P PF PF PF
EtF PF
N-
15
SA
DA
DA
DA eDA
OS FDA
T
Do PFTr
Un PFO
P
PF
PF
PF
PF
30
Female (n=30)
Male (n=29)
30
SA
DA
DA
DA eDA
OS FDA
T
Do PFTr
Un PFO
P
PF
PF
PF
PF
30
25
20
15
10
Liver
200
Concentration (ng/g ww)
Concentration (ng/g ww)
25
197
2
1
0
S S S
A A A
A
A
Hp PFO PFD FOAPFN PFD OSAUnDAFOSDoDATrDATeD
P
P PF PF PF
EtF PF
N-
Liver
200
120
25
< 150 g (n=20)
150-260 g (n=17)
> 260g (n=19)
15
0
SA
DA
DA
DA eDA
OS FDA
T
Do PFTr
Un PFO
P
PF
PF
PF
PF
PF
S S S
A A A
A
A
Hp PFO PFD FOAPFN PFD OSAUnDAFOSDoDATrDATeD
P
P PF PF PF
EtF PF
N-
Fig. 3. The PFASs concentrations in tilapia with different genders, lengths and weights (mean 7 standard deviation).
Fig. 4. Correlation between the log BAF and the perfluoroalkyl chain length of
PFASs in liver of tilapia. The error bars represent the standard deviations.
exposure concentrations were compared to benchmark dose of a
chemical via fish consumption. Hazard ratio (HR) was calculated
by dividing the average daily intake (ADI) against Reference Dose
(RfD). A HR value greater than 1 suggests that the average
exposure level exceeds the benchmark concentration. Average
daily intake (ADI) of the chemical was calculated based on the
following equation:
ADI¼ PFAS concentration  fish consumption [g/kg body
weight/d]
Assuming an average human body weight of 60 kg and muscle
being the only consumed tissue, the amount of fish consumption is
about 60 kg per person per year in Hong Kong (Dickman and
Leung, 1998). Taking geographical location and eating habits of life
into account, the same fish consumption rate was used for the
calculation in this region. Since PFOS was the predominant PFAS in
the fish collected from the PRD region, risk assessment was only
performed for this compound. The RfD for PFOS is 0.025 μg/g/d,
which was established on the basis of the rat chronic carcinogenicity studies (Thayer, 2002). The ADI of PFOS of all nine fish species
198
C.-G. Pan et al. / Ecotoxicology and Environmental Safety 107 (2014) 192–199
Table 2
Average daily intake (ADI) and hazard ratio value (HR) for local residents with PFOS
exposure via fish consumption.
Fish name
Concentration (ng/g ww)
ADI (ng/kd/d)
HR
Bream
Crucian carp
Common carp
Chub
Mud carp
Tilapia
Snakehead
Leather catfish
Grass carp
3.6
5.3
8.7
15
0.43
14
25
17
1.7
9.8
15
24
40
1.2
38
69
47
4.7
0.39
0.58
0.95
1.6
0.05
1.5
2.8
1.9
0.19
Remark: HR was calculated based on PFOS concentrations in muscle by assuming
that muscle is the only consumption tissue.
was calculated to be 31 ng/kg/d for the PRD people. This value is
much greater than those reported in Sweden (0.62 ng/kg/d)
(Berger et al., 2009), Guangzhou (2.8 ng/kg/d), Zhoushan (1.7 ng/
kg/d) (Gulkowska et al., 2006), Hong Kong (2.4 72.9 ng/kg/d),
Xiamen (5.1 74.7 ng/kg/d) (Zhao et al., 2011) and Norway
(0.78 ng/kg/d) (Haug et al., 2010). This reflects the combination
of both high (but not exceptionally high) PFOS levels and relatively
high fish consumption rates in this region.
The ADI and HR values of the nine fish species are summarized
in Table 2. The HR values for PFOS in chub, tilapia, snakehead and
leather catfish were 1.6, 1.5, 2.8 and 1.9, respectively. This indicates
that consumption of the four fish species in the region could pose
high risks to the local population. However, the HR values for the
other five fish species were all less than 1, ranging from 0.05 to
0.95, indicating minimal risks to the local population.
4. Conclusion
The present study showed detection of eighteen PFASs at various
concentrations in nine fish species collected from the rivers in the PRD
region. The PFOS, PFOSA and PFUnDA concentrations in fish showed
an increasing trend with increasing fish length and weight. PFOS was
the predominant PFAS compound found both in muscle and liver,
followed by PFUnDA and PFTrDA. The PFOS concentrations in fish
were strongly correlated to the concentrations in water. Among the
nine species, snakehead showed the highest PFOS concentrations,
followed by leather catfish, with mud carp having the lowest
concentrations. PFASs are more bioaccumulative in liver than in
muscle for all the studied fish. The BAF values for PFASs were
positively correlated with the perfluoroalkyl carbon numbers. Meanwhile, based on hazard ratios for PFOS, frequent consumption of some
contaminated fish such as wild chub, tilapia, snakehead and leather
catfish collected from this region could pose potential health risks to
local population.
Acknowledgments
The authors would like to acknowledge the financial support
from National Natural Science Foundation of China (U1133005,
and 41121063) and National Water Pollution Control Program
(2014ZX07206-005). This is a Contribution No. 1918 from GIG CAS.
Appendix A. Supporting information
Supplementary data associated with this article can be found in
the online version at />
References
Ahrens, L., Siebert, U., Ebinghaus, R., 2009. Temporal trends of polyfluoroalkyl
compounds in harbor seals (Phoca vitulina) from the German Bight, 1999–2008.
Chemosphere 76, 151–158.
Becker, A.M., Gerstmann, S., Frank, H., 2010. Perfluorooctanoic acid and perfluorooctane sulfonate in two fish species collected from the Roter Main River,
Bayreuth, Germany. Bull. Environ. Contam. Toxicol. 84, 132–135.
Berger, U., Glynn, A., Holmström, K.E., Berglund, M., Ankarberg, E.H., Törnkvist, A.,
2009. Fish consumption as a source of human exposure to perfluorinated alkyl
substances in Sweden—analysis of edible fish from Lake Vättern and the Baltic
Sea. Chemosphere 76, 799–804.
Bloom, M.S., Kannan, K., Spliethoff, H.M., Tao, L., Aldous, K.M., Vena, J.E., 2009. A
preliminary study of temporal differences in serum concentrations of perfluoroalkyl acids, among New York anglers, in the absence of known changes in
manufacturing practices. Toxicol. Environ. Chem. 91, 1387–1397.
Delinsky, A.D., Strynar, M.J., McCann, P.J., Varns, J.L., McMillan, L., Nakayama, S.F.,
Lindstrom, A.B., 2010. Geographical distribution of perfluorinated compounds
in fish from Minnesota lakes and rivers. Environ. Sci. Technol. 44, 2549–2554.
Dickman, M., Leung, K., 1998. Mercury and organochlorine exposure from fish
consumption in Hong Kong. Chemosphere 37, 991–1015.
Ericson, I., Martí-Cid, R., Nadal, M., Van Bavel, B., Lindström, G., Domingo, J.L., 2008.
Human exposure to perfluorinated chemicals through the diet: intake of
perfluorinated compounds in foods from the Catalan (Spain) market. J. Agric.
Food Chem. 56, 1787–1794.
Falandysz, J., Taniyasu, S., Gulkowska, A., Yamashita, N., Schulte-Oehlmann, U.,
2006. Is fish a major source of fluorinated surfactants and repellents in humans
living on the Baltic Coast? Environ. Sci. Technol 40, 748–751.
Food and Agriculture Organization of the United Nations. 2010. The State of World
Fisheries and Aquaculture. Rome, Italy. Available online 〈 />docrep/013/i1820e/i1820e00.htm〉 (accessed Nov. 2013).
Fromme, H., Tittlemier, S.A., Völkel, W., Wilhelm, M., Twardella, D., 2009. Perfluorinated compounds–exposure assessment for the general population in
Western countries. Int. J. Hyg. Environ. Health 212, 239–270.
Furdui, V.I., Stock, N.L., Ellis, D.A., Butt, C.M., Whittle, D.M., Crozier, P.W., Reiner, E.J.,
Muir, D.C., Mabury, S.A., 2007. Spatial distribution of perfluoroalkyl contaminants in lake trout from the Great Lakes. Environ. Sci. Technol. 41, 1554–1559.
Giesy, J.P., Kannan, K., 2001. Global distribution of perfluorooctane sulfonate in
wildlife. Environ. Sci. Technol. 35, 1339–1342.
Gulkowska, A., Jiang, Q., So, M.K., Taniyasu, S., Lam, P.K., Yamashita, N., 2006.
Persistent perfluorinated acids in seafood collected from two cities of China.
Environ. Sci. Technol. 40, 3736–3741.
Hansen, K., Johnson, H., Eldridge, J., Butenhoff, J., Dick, L., 2002. Quantitative
characterization of trace levels of PFOS and PFOA in the Tennessee River.
Environ. Sci. Technol. 36, 1681–1685.
Hansen, K.J., Clemen, L.A., Ellefson, M.E., Johnson, H.O., 2001. Compound–specific,
quantitative characterization of organic fluorochemicals in biological matrices.
Environ. Sci. Technol. 35, 766–770.
Hart, K., Kannan, K., Tao, L., Takahashi, S., Tanabe, S., 2008. Skipjack tuna as a
bioindicator of contamination by perfluorinated compounds in the oceans. Sci.
Total Environ. 403, 215–221.
Haug, L.S., Thomsen, C., Brantsæter, A.L., Kvalem, H.E., Haugen, M., Becher, G.,
Alexander, J., Meltzer, H.M., Knutsen, H.K., 2010. Diet and particularly seafood
are major sources of perfluorinated compounds in humans. Environ. Int. 36,
772–778.
Hloušková, V., Lanková, D., Kalachová, K., Hrádková, P., Poustka, J., Hajšlová, J.,
Pulkrabová, J., 2013. Occurrence of brominated flame retardants and perfluoroalkyl substances in fish from the Czech aquatic ecosystem. Sci. Total Environ.
461, 88–98.
Hong, S., Khim, J.S., Park, J., Kim, M., Kim, W.-K., Jung, J., Hyun, S., Kim, J.-G., Lee, H.,
Choi, H.J., 2013. In situ fate and partitioning of waterborne perfluoroalkyl acids
(PFAAs) in the Youngsan and Nakdong River Estuaries of South Korea. Sci. Total
Environ. 445, 136–145.
Kannan, K., Newsted, J., Halbrook, R.S., Giesy, J.P., 2002. Perfluorooctanesulfonate
and related fluorinated hydrocarbons in mink and river otters from the United
States. Environ. Sci. Technol. 36, 2566–2571.
Kannan, K., Tanabe, S., Giesy, J.P., Tatsukawa, R., 1997. Organochlorine pesticides
and polychlorinated biphenyls in foodstuffs from Asian and Oceanic countries.
Rev. Environ. Contam. Toxicol. 152, 1–55.
Kannan, K., Tao, L., Sinclair, E., Pastva, S.D., Jude, D.J., Giesy, J.P., 2005. Perfluorinated
compounds in aquatic organisms at various trophic levels in a Great Lakes food
chain. Arch. Environ. Contam. Toxicol. 48, 559–566.
Keller, J.M., Kannan, K., Taniyasu, S., Yamashita, N., Day, R.D., Arendt, M.D., Segars, A.
L., Kucklick, J.R., 2005. Perfluorinated compounds in the plasma of loggerhead
and Kemp's ridley sea turtles from the southeastern coast of the United States.
Environ. Sci. Technol. 39, 9101–9108.
Kelly, B.C., Ikonomou, M.G., Blair, J.D., Surridge, B., Hoover, D., Grace, R., Gobas, F.A.,
2009. Perfluoroalkyl contaminants in an arctic marine food web: trophic
magnification and wildlife exposure. Environ. Sci. Technol. 43, 4037–4043.
Key, B.D., Howell, R.D., Criddle, C.S., 1997. Fluorinated organics in the biosphere.
Environ. Sci. Technol. 31, 2445–2454.
Knobeloch, L., Imm, P., Anderson, H., 2012. Perfluoroalkyl chemicals in vacuum
cleaner dust from 39 Wisconsin homes. Chemosphere 88, 779–783.
C.-G. Pan et al. / Ecotoxicology and Environmental Safety 107 (2014) 192–199
Kwadijk, C., Korytar, P., Koelmans, A., 2010. Distribution of perfluorinated compounds in aquatic systems in The Netherlands. Environ. Sci. Technol. 44,
3746–3751.
Labadie, P., Chevreuil, M., 2011. Partitioning behaviour of perfluorinated alkyl
contaminants between water, sediment and fish in the Orge River (nearby
Paris, France). Environ. Pollut. 159, 391–397.
Lau, C., Anitole, K., Hodes, C., Lai, D., Pfahles-Hutchens, A., Seed, J., 2007.
Perfluoroalkyl acids: a review of monitoring and toxicological findings. Toxicol.
Sci. 99, 366–394.
Lewandowski, G., Meissner, E., Milchert, E., 2006. Special applications of fluorinated
organic compounds. J. Hazard. Mater. 136, 385–391.
Luebker, D.J., Hansen, K.J., Bass, N.M., Butenhoff, J.L., Seacat, A.M., 2002. Interactions
of flurochemicals with rat liver fatty acid-binding protein. Toxicology 176,
175–185.
Malinsky, M.D., Jacoby, C.B., Reagen, W.K., 2011. Determination of perfluorinated
compounds in fish fillet homogenates: method validation and application to
fillet homogenates from the Mississippi River. Anal. Chim. Acta 683, 248–257.
Martin, J.W., Mabury, S.A., Solomon, K.R., Muir, D.C., 2003. Bioconcentration and
tissue distribution of perfluorinated acids in rainbow trout (Oncorhynchus
mykiss). Environ. Toxicol. Chem. 22, 196–204.
Moody, C.A., Field, J.A., 2000. Perfluorinated surfactants and the environmental
implications of their use in fire-fighting foams. Environ. Sci. Technol. 34,
3864–3870.
Murakami, M., Adachi, N., Saha, M., Morita, C., Takada, H., 2011. Levels, temporal
trends, and tissue distribution of perfluorinated surfactants in freshwater fish
from Asian countries. Arch. Environ. Contam. Toxicol. 61, 631–641.
Nania, V., Pellegrini, G.E., Fabrizi, L., Sesta, G., Sanctis, P.D., Lucchetti, D., Pasquale, M.
D., Coni, E., 2009. Monitoring of perfluorinated compounds in edible fish from
the Mediterranean Sea. Food Chem. 115, 951–957.
Peng, H., Wei, Q., Wan, Y., Giesy, J.P., Li, L., Hu, J., 2010. Tissue distribution and
maternal transfer of poly-and perfluorinated compounds in Chinese sturgeon
(Acipenser sinensis): implications for reproductive risk. Environ. Sci. Technol. 44,
1868–1874.
Peters, J.M., Gonzalez, F.J., 2011. Why toxic equivalency factors are not suitable for
perfluoroalkyl chemicals. Chem. Res. Toxicol. 24, 1601–1609.
Powley, C.R., George, S.W., Russell, M.H., Hoke, R.A., Buck, R.C., 2008. Polyfluorinated chemicals in a spatially and temporally integrated food web in the
Western Arctic. Chemosphere 70, 664–672.
Quinete, N., Wu, Q., Zhang, T., Yun, S.H., Moreira, I., Kannan, K., 2009. Specific
profiles of perfluorinated compounds in surface and drinking waters and
accumulation in mussels, fish, and dolphins from southeastern Brazil. Chemosphere 77, 863–869.
Schuetze, A., Heberer, T., Effkemann, S., Juergensen, S., 2010. Occurrence and
assessment of perfluorinated chemicals in wild fish from Northern Germany.
Chemosphere 78, 647–652.
Senthilkumar, K., Ohi, E., Sajwan, K., Takasuga, T., Kannan, K., 2007. Perfluorinated
compounds in river water, river sediment, market fish, and wildlife samples
from Japan. Bull. Environ. Contam. Toxicol. 79, 427–431.
199
Shi, Y., Wang, J., Pan, Y., Cai, Y., 2012. Tissue distribution of perfluorinated
compounds in farmed freshwater fish and human exposure by consumption.
Environ. Toxicol. Chem. 31, 717–723.
So, M., Miyake, Y., Yeung, W., Ho, Y., Taniyasu, S., Rostkowski, P., Yamashita, N., Zhou,
B., Shi, X., Wang, J., 2007. Perfluorinated compounds in the Pearl River and
Yangtze River of China. Chemosphere 68, 2085–2095.
Taniyasu, S., Kannan, K., So, M.K., Gulkowska, A., Sinclair, E., Okazawa, T., Yamashita,
N., 2005. Analysis of fluorotelomer alcohols, fluorotelomer acids, and short-and
long-chain perfluorinated acids in water and biota. J. Chromatogr. A. 1093,
89–97.
Tao, L., Kannan, K., Kajiwara, N., Costa, M.M., Fillmann, G., Takahashi, S., Tanabe, S.,
2006. Perfluorooctanesulfonate and related fluorochemicals in albatrosses,
elephant seals, penguins, and polar skuas from the Southern Ocean. Environ.
Sci. Technol. 40, 7642–7648.
Thayer, K., 2002. Perfluorinated Chemicals: Justification for Inclusion of this
Chemical Class in the National Report on Human Exposure to Environmental
Chemicals. Environmental Working Group, Washington, DC.
Tittlemier, S.A., Pepper, K., Seymour, C., Moisey, J., Bronson, R., Cao, X.-L., Dabeka, R.
W., 2007. Dietary exposure of Canadians to perfluorinated carboxylates and
perfluorooctane sulfonate via consumption of meat, fish, fast foods, and food
items prepared in their packaging. J. Agric. Food Chem. 55, 3203–3210.
UNEP, 2009. The nine new POPs. In: An Introduction to the Nine Chemicals Added
to the Stockholm Convention by the Conference of the Parties at its Fourth
Meeting. Available online 〈 />NewPOPs /tabid/672/Default.aspx〉 (accessed Nov. 2013).
Van de Vijver, K.I., Hoff, P.T., Das, K., Van Dongen, W., Esmans, E.L., Jauniaux, T.,
Bouquegneau, J.-M., Blust, R., De Coen, W., 2003. Perfluorinated chemicals
infiltrate ocean waters: link between exposure levels and stable isotope ratios
in marine mammals. Environ. Sci. Technol. 37, 5545–5550.
Van de Vijver, K.I., Holsbeek, L., Das, K., Blust, R., Joiris, C., De Coen, W., 2007.
Occurrence of perfluorooctane sulfonate and other perfluorinated alkylated
substances in harbor porpoises from the Black Sea. Environ. Sci. Technol. 41,
315–320.
Vestergren, R., Cousins, I.T., 2009. Tracking the pathways of human exposure to
perfluorocarboxylates. Environ. Sci. Technol. 43, 5565–5575.
Yeung, L.W., So, M., Jiang, G., Taniyasu, S., Yamashita, N., Song, M., Wu, Y., Li, J., Giesy,
J., Guruge, K., 2006. Perfluorooctanesulfonate and related fluorochemicals in
human blood samples from China. Environ. Sci. Technol. 40, 715–720.
Zhang, T., Sun, H., Lin, Y., Wang, L., Zhang, X., Liu, Y., Geng, X., Zhao, L., Li, F., Kannan,
K., 2011. Perfluorinated compounds in human blood, water, edible freshwater
fish, and seafood in China: daily intake and regional differences in human
exposures. J. Agric. Food Chem. 59, 11168–11176.
Zhao, Y.G., Wan, H.T., Law, A., Wei, X., Huang, Y.Q., Giesy, J.P., Wong, M.H., Wong, C.
K., 2011. Risk assessment for human consumption of perfluorinated compoundcontaminated freshwater and marine fish from Hong Kong and Xiamen.
Chemosphere 85, 277–283.