Ultrafast IR and raman spectroscopy 2001 fayer
Bạn đang xem bản rút gọn của tài liệu. Xem và tải ngay bản đầy đủ của tài liệu tại đây (14.06 MB, 702 trang )
Ultrafast Infrared
and Raman
Spectroscopy
edited by
M. D. Fayer
Stanford University
Stanford, California
Marcel Dekker, Inc.
TM
Copyright © 2001 by Taylor & Francis Group, LLC
New York • Basel
ISBN: 0-8247-0451-7
This book is printed on acid-free paper.
Headquarters
Marcel Dekker, Inc.
270 Madison Avenue, New York, NY 10016
tel: 212-696-9000; fax: 212-685-4540
Eastern Hemisphere Distribution
Marcel Dekker AG
Hutgasse 4, Postfach 812, CH-4001 Basel, Switzerland
tel: 41-61-261-8482; fax: 41-61-261-8896
World Wide Web
The publisher offers discounts on this book when ordered in bulk quantities. For
more information, write to Special Sales/Professional Marketing at the headquarters
address above.
Copyright 2001 by Marcel Dekker, Inc. All Rights Reserved.
Neither this book nor any part may be reproduced or transmitted in any form or
by any means, electronic or mechanical, including photocopying, microfilming, and
recording, or by any information storage and retrieval system, without permission
in writing from the publisher.
Current printing (last digit):
10 9 8 7 6 5 4 3 2 1
PRINTED IN THE UNITED STATES OF AMERICA
Copyright © 2001 by Taylor & Francis Group, LLC
PRACTICAL SPECTROSCOPY
A SERIES
1. Infrared and Raman Spectroscopy (in three parts), edited by Edward G.
Brame, Jr., and Jeanette G. Grasselli
2. X-Ray Spectrometry, edited by H. K. Herglotz and L. S. Birks
3. Mass Spectrometry (in two parts), edited by Charles Merritt, Jr., and Charles
N. McEwen
4. Infrared and Raman Spectroscopy of Polymers, H. W. Siesler and K.
Holland-Moritz
5. NMR Spectroscopy Techniques, edited by Cecil Dybowski and Robert L.
Lichter
6. Infrared Microspectroscopy: Theory and Applications, edited by Robert G.
Messerschmidt and Matthew A. Harthcock
7. Flow Injection Atomic Spectroscopy, edited by Jose Luis Burguera
8. Mass Spectrometry of Biological Materials, edited by Charles N. McEwen
and Barbara S. Larsen
9. Field Desorption Mass Spectrometry, László Prókai
10. Chromatography/Fourier Transform Infrared Spectroscopy and Its Applications, Robert White
11. Modern NMR Techniques and Their Application in Chemistry, edited by
Alexander I. Popov and Klaas Hallenga
12. Luminescence Techniques in Chemical and Biochemical Analysis, edited by
Willy R. G. Baeyens, Denis De Keukeleire, and Katherine Korkidis
13. Handbook of Near-Infrared Analysis, edited by Donald A. Burns and Emil W.
Ciurczak
14. Handbook of X-Ray Spectrometry: Methods and Techniques, edited by René
E. Van Grieken and Andrzej A. Markowicz
15. Internal Reflection Spectroscopy: Theory and Applications, edited by Francis
M. Mirabella, Jr.
16. Microscopic and Spectroscopic Imaging of the Chemical State, edited by
Michael D. Morris
17. Mathematical Analysis of Spectral Orthogonality, John H. Kalivas and Patrick
M. Lang
18. Laser Spectroscopy: Techniques and Applications, E. Roland Menzel
19. Practical Guide to Infrared Microspectroscopy, edited by Howard J. Humecki
20. Quantitative X-ray Spectrometry: Second Edition, Ron Jenkins, R. W. Gould,
and Dale Gedcke
21. NMR Spectroscopy Techniques: Second Edition, Revised and Expanded,
edited by Martha D. Bruch
22. Spectrophotometric Reactions, Irena Nemcova, Ludmila Cermakova, and Jiri
Gasparic
23. Inorganic Mass Spectrometry: Fundamentals and Applications, edited by
Christopher M. Barshick, Douglas C. Duckworth, and David H. Smith
24. Infrared and Raman Spectroscopy of Biological Materials, edited by HansUlrich Gremlich and Bing Yan
25. Near-Infrared Applications in Biotechnology, edited by Ramesh Raghavachari
26. Ultrafast Infrared and Raman Spectroscopy, edited by M. D. Fayer
27. Handbook of Near-Infrared Analysis: Second Edition, Revised and Expanded, edited by Donald A. Burns and Emil W. Ciurczak
28. Handbook of Raman Spectroscopy: From the Research Laboratory to the
Process Line, edited by Ian R. Lewis and Howell G. M. Edwards
29. Handbook of X-Ray Spectrometry: Second Edition, Revised and Expanded,
edited by René E. Van Grieken and Andrzej A. Markowicz
30. Ultraviolet Spectroscopy and UV Lasers, edited by Prabhakar Misra and
Mark A. Dubinskii
31. Pharmaceutical and Medical Applications of Near-Infrared Spectroscopy,
Emil W. Ciurczak and James K. Drennen III
32. Applied Electrospray Mass Spectrometry, edited by Birendra N. Pramanik, A.
K. Ganguly, and Michael L. Gross
ADDITIONAL VOLUMES IN PREPARATION
Preface
The field of ultrafast infrared and Raman spectroscopy is advancing at a
remarkable rate. New techniques and laser sources are making it possible
to investigate a wide range of problems in chemistry, physics, and biology,
using ultrafast time domain vibrational spectroscopy. Although the first
infrared measurements were made by Isaac Newton in the early 1700s, it is
only recently that an explosion of activity using ultrafast pulsed techniques
has moved vibrational spectroscopy along the path that magnetic resonance
spectroscopy followed almost from its inception.
Vibrational spectroscopy examines the internal mechanical degrees
of freedom of molecules and the external mechanical degrees of freedom
of condensed matter systems. It is the direct connection among vibrational spectra, molecular structure, and intermolecular interactions that has
made vibrational spectroscopy an indispensable tool in the study of molecular matter. In addition, most chemical, physical, and biological processes
are thermal. Such processes involve the time evolution of the mechanical
degrees of freedom of molecules on their ground electronic state potential
surfaces. This is the purview of vibrational spectroscopy. The advent of
ultrafast pulsed vibrational spectroscopy, using both resonant infrared and
Raman methods, is fundamentally changing the nature of the information
that can be obtained about condensed matter molecular materials. It is now
possible to examine the structural evolution of systems on the time scales
on which the important events are occurring.
All the powerful methods of magnetic resonance, from solid-state
nuclear magnetic resonance (NMR) to medical magnetic resonance imaging,
depend on measuring the time evolution of a spin system following the
application of one or more radio frequency pulses. In the visible and ultraviolet, ultrafast optical pulse sequences have been used for many years
to measure both population dynamics and coherence phenomena. At low
Copyright © 2001 by Taylor & Francis Group, LLC
temperatures, electronic transitions of complex molecules can have narrow,
homogeneous line widths even if the absorption spectra display broad, inhomogeneous lines. In low-temperature crystals and glasses, optical coherence
methods, such as photon echoes and stimulated photon echoes, have been
highly successful at extracting a great deal of information about dynamics
and intermolecular interactions. As visible pulse durations became increasingly short, photon echoes and related sequences have been applied to
molecules in room-temperature liquids. Many elegant experiments have
begun to extract some information from such systems. However, there is
an intrinsic problem: Because of the exceedingly short electronic dephasing
times of complex molecules at high temperatures, ultrashort pulses (tens
of femtoseconds or less) are required to perform the experiments. Ultrashort pulses have very large bandwidths, resulting in the excitation of a
vast number of vibronic transitions in complex molecules. Experiments of
this type cannot be described properly in terms of two states coupled to
a medium. The complex multistate superposition that is initially prepared
by the broad bandwidth radiation field has a time evolution that depends
on the nature and magnitude of the many states that comprise the superposition as well as the system’s interactions with the medium. It is difficult
to develop a detailed understanding of such experiments except when they
are performed on simple molecules (e.g., diatomics).
The electronic absorption spectra of complex molecules at elevated
temperatures in condensed matter are generally very broad and virtually
featureless. In contrast, vibrational spectra of complex molecules, even in
room-temperature liquids, can display sharp, well-defined peaks, many of
which can be assigned to specific vibrational modes. The inverse of the
line width sets a time scale for the dynamics associated with a transition.
The relatively narrow line widths associated with many vibrational transitions make it possible to use pulse durations with correspondingly narrow
bandwidths to extract information. For a vibration with sufficiently large
anharmonicity or a sufficiently narrow absorption line, the system behaves
as a two-level transition coupled to its environment. In this respect, time
domain vibrational spectroscopy of internal molecular modes is more akin
to NMR than to electronic spectroscopy. The potential has already been
demonstrated, as described in some of the chapters in this book, to perform
pulse sequences that are, in many respects, analogous to those used in
NMR. Commercial equipment is available that can produce the necessary
infrared (IR) pulses for such experiments, and the equipment is rapidly
becoming less expensive, more compact, and more reliable. It is possible,
even likely, that coherent IR pulse-sequence vibrational spectrometers will
Copyright © 2001 by Taylor & Francis Group, LLC
become available for general use, much as NMR spectrometers have gone
from home-built, specialized machines to instruments widely used in many
areas of science.
While the internal vibrational modes of molecules can display sharp
spectral features, the vibrational spectra of modes of bulk matter are broad
and relatively featureless. Nonetheless, Raman and infrared methods can be
used to study the bulk, the intermolecular degrees of freedom of condensed
matter systems. A great deal of information on bulk degrees of freedom has
been extracted from electronic spectroscopy, particularly at low temperatures. Such experiments, however, rely on the influence of the medium
on an electronic transition. Using ultrafast Raman techniques, including
multidimensional methods, and emerging far-IR methods, it is possible to
examine the bulk properties of matter directly.
A remarkable collection of individuals has been assembled to
contribute to the book — experimentalists and theorists who are at the
forefront of the advances in ultrafast infrared and Raman spectroscopy.
They discuss a diverse set of important chemical, physical, and biological
problems and a broad range of experimental and theoretical methods.
While the experimentalists all use theory to understand their results, the
inclusion of top theorists adds to the comprehensive nature of the book. The
theorists are developing descriptions of the new techniques and methods
for interpreting the results. The wealth of data that has emerged from the
application of new methods has spawned a great deal of theoretical effort.
In turn, new theoretical methods drive the experiments by placing them in
proper context and indicating lines for new experimental endeavors.
The experiments discussed in this book are diverse, but they break
down into two broad categories: (1) resonant infrared methods in which
ultrafast IR pulses are tuned to the wavelength of the vibrational transition
and (2) Raman methods (in some instances referred to as impulsive stimulated scattering), in which two visible wavelengths have a difference in
frequency equal to the vibrational frequency. In some experiments, infrared
and Raman techniques are combined in a single measurement.
There is another manner in which the experiments can be separated
into two broad categories. In some of the experiments, the time evolution
of vibrational populations are studied. For example, a particular vibration
may be excited with an infrared pulse of light, and then the time evolution of the population is followed with either infrared or Raman probe
techniques. In other experiments, a chemical reaction is begun with an
ultrafast visible pulse, and the time evolution of the chemical reaction is
followed with ultrafast infrared pulses that monitor the time dependence
Copyright © 2001 by Taylor & Francis Group, LLC
of the vibrational spectrum. In another class of experiments, vibrational
coherence experiments are performed. Experiments such as the infrared
vibrational echo or Raman vibrational echo are closely analogous to NMR
spin echo. Such experiments, in one- and two-dimensional incarnations,
examine the time evolution of the phase relationship among vibrations.
Both population and coherence experiments provide information on
the dynamics and interactions of condensed matter systems. In addition,
time domain vibrational experiments can extract spectroscopic information
that is hidden in a conventional measurement of the infrared or Raman
spectra. This book will provide the reader with a picture of the state of
the art and a perspective on future developments in the field of ultrafast
infrared and Raman spectroscopy.
M. D. Fayer
Copyright © 2001 by Taylor & Francis Group, LLC
Contents
Preface
Contributor
1 Ultrafast Coherent Raman and Infrared Spectroscopy of
Liquid Systems
Alfred Laubereau and Robert Laenen
2 Probing Bond Activation Reactions with Femtosecond
Infrared
Haw Yang and Charles Bonner Harris
3 Applications of Broadband Transient Infrared Spectroscopy
Edwin J. Heilweil
4 The Molecular Mechanisms Behind the Vibrational
Population Relaxation of Small Molecules in Liquids
Richard M. Stratt
5 Time-Resolved Infrared Studies of Ligand Dynamics in
Heme Proteins
Manho Lim, Timothy A. Jackson, and Philip A. Anfinrud
6 Infrared Vibrational Echo Experiments
Kirk D. Rector and M. D. Fayer
7 Structure and Dynamics of Proteins and Peptides:
Femtosecond Two-Dimensional Infrared Spectroscopy
Peter Hamm and Robin M. Hochstrasser
Copyright © 2001 by Taylor & Francis Group, LLC
8 Two-Dimensional Coherent Infrared Spectroscopy of
Vibrational Excitons in Peptides
Andrei Piryatinski, Vladimir Chernyak, and Shaul Mukamel
9 Vibrational Dephasing in Liquids: Raman Echo and Raman
Free-Induction Decay Studies
Mark A. Berg
10 Fifth-Order Two-Dimensional Raman Spectroscopy of the
Intermolecular and Vibrational Dynamics in Liquids
David A. Blank, Graham R. Fleming, Minhaeng Cho, and
Andrei Tokmakoff
11 Nonresonant Intermolecular Spectroscopy of Liquids
John T. Fourkas
12 Lattice Vibrations that Move at the Speed of Light: How to
Excite Them, How to Monitor Them, and How to Image
Them Before They Get Away
Richard M. Koehl, Timothy F. Crimmins, and Keith
A. Nelson
13 Vibrational Energy Redistribution in Polyatomic Liquids:
Ultrafast IR-Raman Spectroscopy
Lawrence K. Iwaki, John C. De`ak, Stuart T. Rhea, and
Dana D. Dlott
14 Coulomb Force and Intramolecular Energy Flow Effects
for Vibrational Energy Transfer for Small Molecules in
Polar Solvents
James T. Hynes and Rossend Rey
15 Vibrational Relaxation of Polyatomic Molecules in
Supercritical Fluids and the Gas Phase
D. J. Myers, Motoyuki Shigeiwa, M. D. Fayer, and Binny
J. Cherayil
16 Vibrational Energy Relaxation in Liquids and Supercritical
Fluids
James L. Skinner, Sergei A. Egorov, and Karl F. Everitt
Copyright © 2001 by Taylor & Francis Group, LLC
Contributors
Philip A. Anfinrud, Ph.D. Laboratory of Chemical Physics, National
Institute of Diabetes and Digestive and Kidney Diseases National Institutes
of Health, Bethesda, Maryland
Mark A. Berg, Ph.D. Department of Chemistry and Biochemistry,
University of South Carolina, Columbia, South Carolina
David A. Blank, Ph.D.∗ Department of Chemistry, University of California at Berkeley, and Lawrence Berkeley National Laboratory, Berkeley,
California
Binny J. Cherayil, Ph.D. Department of Inorganic and Physical Chemistry, Indian Institute of Science, Bangalore, India
Vladimir Chernyak, Ph.D. Department of Chemistry, University of
Rochester, Rochester, New York
Minhaeng Cho, Ph.D. Department of Chemistry, Korea University,
Seoul, South Korea
Timothy F. Crimmins, Ph.D. Department of Chemistry, Massachusetts
Institute of Technology, Cambridge, Massachusetts
John C. De`ak, Ph.D.† Department of Chemistry, University of Illinois
at Urbana-Champaign, Urbana, Illinois
Ł
†
Current affiliation: University of Minnesota, Minneapolis, Minnesota
Current affiliation: Procter & Gamble Company, Ross, Ohio
Copyright © 2001 by Taylor & Francis Group, LLC
Dana D. Dlott, Ph.D. Department of Chemistry, University of Illinois at
Urbana-Champaign, Urbana, Illinois
Sergei A. Egorov, Ph.D. Department of Chemistry, University of
Virginia, Charlottesville, Virginia
Karl F. Everitt, B.S. Department of Chemistry, University of Wisconsin–
Madison, Madison, Wisconsin
M. D. Fayer, Ph.D. Department of Chemistry, Stanford University,
Stanford, California
Graham R. Fleming, Ph.D. Department of Chemistry, University of
California at Berkeley, and Physical Sciences Biosciences Division,
Lawrence Berkeley National Laboratory, Berkeley, California
John T. Fourkas, Ph.D. Department of Chemistry, Eugene F. Merkert
Chemistry Center, Boston College, Chestnut Hill, Massachusetts
Peter Hamm, Ph.D. Department of Chemistry, Max-Born Institut, Berlin,
Germany
Charles Bonner Harris, Ph.D. Department of Chemistry, University of
California at Berkeley, Berkeley, California
Edwin J. Heilweil, Ph.D. Optical Technology Division, Physics Laboratory, National Institute of Standards and Technology, Gaithersburg, Maryland
Robin M. Hochstrasser, Ph.D. Department of Chemistry, University of
Pennsylvania, Philadelphia, Pennsylvania
James T. Hynes, Ph.D. Department of Chemistry and Biochemistry,
University of Colorado, Boulder, Colorado, and D´epartement de Chimie,
Ecole Normale Sup´erieure, Paris, France
Lawrence K. Iwaki, Ph.D.∗ Department of Chemistry, University of
Illinois at Urbana-Champaign, Urbana, Illinois
Ł
Current affiliation: National Institute of Standards and Technology, Gaithersburg, Maryland
Copyright © 2001 by Taylor & Francis Group, LLC
Timothy A. Jackson, Ph.D. Division of Health Sciences and Technology, Harvard University and Massachusetts Institute of Technology,
Boston, Massachusetts
Richard M. Koehl Department of Chemistry, Massachusetts Institute of
Technology, Cambridge, Massachusetts
Robert Laenen, Ph.D. Physik Department II, Technische Universit¨at
M¨unchen, Garching, Germany
Alfred Laubereau, Dr.rer.nat., Dr.rer.nat.habil., Dr.h.c. Physik Department II, Technische Universit¨at M¨unchen, Garching, Germany
Manho Lim, Ph.D. Department of Chemistry, Pusan National University,
Pusan, South Korea
Shaul Mukamel, Ph.D. Department of Chemistry, University of
Rochester, Rochester, New York
D. J. Myers, Ph.D. Department of Chemistry, Stanford University,
Stanford, California
Keith A. Nelson, Ph.D. Department of Chemistry, Massachusetts Institute of Technology, Cambridge, Massachusetts
Andrei Piryatinski, Ph.D. Department of Chemistry, University of
Rochester, Rochester, New York
Kirk D. Rector, Ph.D.∗
Stanford, California
Department of Chemistry, Stanford University,
Rossend Rey, Ph.D. D´epartement de F´ısica I Enginyeria Nuclear, Universitat Polit`ecnica de Catalunya, Barcelona, Spain
Stuart T. Rhea,† Ph.D. Department of Chemistry, University of Illinois
at Urbana-Champaign, Urbana, Illinois
Motoyuki Shigeiwa, B.S. Department of Chemistry, Stanford University,
Stanford, California
Ł
†
Current affiliation: Bioscience Division, Los Alamos National Laboratory, Los
Alamos, New Mexico
Current affiliation: CMI, Inc., Owensboro, Kentucky
Copyright © 2001 by Taylor & Francis Group, LLC
James L. Skinner, Ph.D. Department of Chemistry, University of
Wisconsin–Madison, Madison, Wisconsin
Richard M. Stratt, Ph.D. Department of Chemistry, Brown University,
Providence, Rhode Island
Andrei Tokmakoff, Ph.D. Department of Chemistry, Massachusetts
Institute of Technology, Cambridge, Massachusetts
Haw Yang, Ph.D.∗ Department of Chemistry, University of California at
Berkeley, Berkeley, California
Ł
Current affiliation: Harvard University, Cambridge, Massachusetts
Copyright © 2001 by Taylor & Francis Group, LLC
1
Ultrafast Coherent Raman and
Infrared Spectroscopy of Liquid
Systems
Alfred Laubereau and Robert Laenen
Technische Universit¨at Munchen
¨
, Garching, Germany
Vibrational and structural dynamics in condensed molecular systems are of
special interest because they provide a basis for the understanding and
manipulation of important material properties and processes in various
fields in material science, chemistry, and biology. Simple examples include
heat transport, shear viscosity, and ultrasonic absorption, which originate
from complex intermolecular interactions. A special role is played here by
hydrogen bonding, which is abundant in nature and has profound effects
on microscopic structures. While there is a wealth of information on the
structure and certain dynamical properties of H-bonded systems obtained
using various techniques such as neutron/x-ray scattering, nuclear magnetic
resonance (NMR), or dielectric relaxation, (1,2) direct time-resolved observations of structural relaxation are still missing. Some first steps in this
direction involve time-resolved spectral holburning observations. These
studies benefit from novel laser sources emitting pulses in the infrared (IR)
spectral region with picosecond to femtosecond duration and exploit the OH
stretching vibration as a local probe for the hydrogen-bonding environment.
The first time-resolved investigations on vibrational dephasing and
vibrational lifetimes of molecules in the liquid phase were reported in
1971 and 1972 by Kaiser et al. utilizing nonlinear Raman scattering (3,4).
A combination of infrared excitation with spontaneous Raman probing
Copyright © 2001 by Taylor & Francis Group, LLC
was applied a few years later by the same group (5). Infrared pump and
probe measurements were first conducted by Chesnoy and Ricard (6) and
Heilweil and coworkers (7), the latter one in liquids, but with only one
tunable IR pulse. The more elaborate two-color versions of such experiments representing time-resolved infrared spectroscopy were demonstrated
by Laubereau and coworkers (8). With the help of this powerful spectroscopic method, detailed information on intra- and intermolecular energy
relaxation processes of molecules was obtained. The technique was first
applied to smaller polyatomic molecules like CHBr3 in different solvents
(9,10). Implementing polarization resolution for the measured probe absorption, molecular reorientation times were also measured (11).
While the first experiments of time-resolved IR spectroscopy were
conducted with pulse durations exceeding 10 ps, the improved performance
of laser systems now offers subpicosecond (12) to femtosecond (13–15)
pulses in the infrared spectral region. In addition, the pump-probe techniques have been supplemented by applications of higher-order methods,
e.g., IR photon echo observations (16).
In this chapter we will first discuss coherent anti-Stokes Raman scattering (CARS) of simple liquids and binary mixtures for the determination
of vibrational dephasing and correlation times. The time constants represent detailed information on the intermolecular interactions in the liquid
phase. In the second section we consider strongly associated liquids and
summarize the results of time-resolved IR spectroscopy (see, e.g., Ref. 17)
on the dynamics of monomeric and associated alcohols as well as isotopic
water mixtures.
I. COHERENT ANTI-STOKES RAMAN SPECTROSCOPY OF
SIMPLE LIQUIDS
A. Introduction
Understanding the mechanism governing the shape and width of
spectroscopic lines has challenged a great number of spectroscopists
(18–20). For molecular vibrations in condensed matter, the role of
dephasing processes in addition to energy relaxation and molecular
reorientation was recognized more than 30 years ago, providing a qualitative
description. From the observed linewidth in liquids at room temperature
with values of the order of magnitude of a few cm 1 , the time scale of
10 12 s was readily estimated (20). With the advent of ultrashort laser
pulses, direct time-resolved techniques became experimentally accessible
Copyright © 2001 by Taylor & Francis Group, LLC
in addition to conventional infrared and Raman spectroscopy. To study
the dephasing properties of vibrational transitions, nonlinear Raman
spectroscopies have been developed, representing special versions of the
pump-probe technique, e.g., coherent anti-Stokes Raman scattering (CARS)
and coherent Stokes Raman scattering (CSRS) (21). The first liquid
examples were stretching vibrations of carbon tetrachloride, ethanol at room
temperature (3), and the fundamental mode of liquid nitrogen (22), while
phonon modes of calcite (23,24) and diamond (25) were addressed in the
early solid-state investigations. Over the past decades a variety of gases and
liquid and solid state systems have been studied using time-domain CARS
(26–28). Higher-order Raman techniques were also demonstrated (29,30).
B. General Considerations
The CARS and CSRS processes are generally described as four-wave
mixing (31,32); in the time domain spectroscopy with delayed pump and
probe fields the elementary scattering mechanism is split into a two-step
two-wave interaction (21). For excitation two laser pulses are applied, i.e.,
two coherent electromagnetic waves with appropriate frequency difference
interact with the molecular ensemble and drive a specific vibrational mode
with transition frequency ω0 resonantly (or close to resonance); “Raman”
is used here as a synonym for “frequency difference resonance.” The
same interaction is involved in the stimulated Raman effect, so that the
latter process was applied in early measurements for the excitation process.
The probing process is coherent scattering of the additional interrogation
pulse off the phase-correlated vibrational excitation, i.e., classical scattering
involving the induced polarization of the molecular ensemble and producing
side bands ωP š ω0 (Stokes and anti-Stokes) of the probe frequency ωP . The
process is the optical phonon analog for light scattering of coherent acoustic
phonons in ultrasonics (e.g., Debye-Sears effect). The two-step interaction
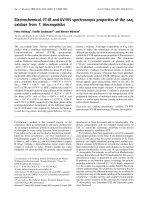
is illustrated in Fig. 1. The pumping process is represented by the simple
energy level scheme of Fig. 1a with the ground and the first excited levels
of the considered vibration; the vertical arrows represent the involved pump
photons with frequencies ωL (“laser”) and ωS (“Stokes”), respectively. The
wave vector diagram is also depicted in Fig. 1a; an off-axis beam geometry
is assumed for the input fields represented by wave vectors kL and kS . The
resulting vector kv represents the spatial phase relation of the vibrational
excitation imposed on the molecular ensemble.
The coherent anti-Stokes scattering of a probing pulse generating
radiation with frequency ωA D ωP C ω0 and wave vector kA is depicted in
Copyright © 2001 by Taylor & Francis Group, LLC
Figure 1 Schematic representation of a time-resolved coherent Raman
experiment. (a) The excitation of the vibrational level is accomplished by a
two-photon process; the laser (L) and Stokes (S) photons are represented by vertical
arrows. The wave vectors of the two pump fields determine the wave vector of the
coherent excitation, kV . (b) At a later time the coherent probing process involving
again two photons takes place; the probe pulse and the anti-Stokes scattering are
denoted by subscripts P and A, respectively. The scattering signal emitted under
phase-matching conditions is a measure of the coherent excitation at the probing
time. (c) Four-photon interaction scheme for the generation of coherent anti-Stokes
Raman scattering of the vibrational transition.
Copyright © 2001 by Taylor & Francis Group, LLC
Fig. 1b. Obviously ωP may be equal to or differ from ωL . The latter case is
termed three-color CARS and avoids undesirable frequency coincidences
with the secondary processes of the excitation step (22,33). Repeating the
measurement with different time delays between pump and probing pulses,
the loss of coherent vibrational excitation may be observed from the decay
of the scattering signal. The generated anti-Stokes emission is highly collimated and occurs in the direction of wave vector kA as shown by the wave
vector diagram in the figure. In general, the physical situation is more
complex, since the mentioned four-wave mixing also provides a nonresonant component for temporal overlap of pump and probing pulses. A
corresponding level scheme is indicated in Fig. 1c.
In the electric dipole approximation, one may write for the induced
polarization of the medium the following:
P D N[∂˛/∂q]iso hqiE C N[∂˛/∂q]aniso hqiE C
3
nr
EEE
(1)
The vector character of P and E is omitted here for simplicity. N denotes the
number density of molecules. Equation (1) shows that the coherent Raman
scattering consists of three components: two resonant terms, which are
proportional to the coherent vibrational amplitude hqi and to the change of
the molecular polarizability with nuclear coordinate, ∂˛/∂q (21). hqi is the
ensemble-averaged quantum mechanical expectation value of the normal
mode operator. The coupling ∂˛/∂q is split into an isotropic (iso) and an
anisotropic (aniso) part. We recall that ∂˛/∂q is a tensor generally defined
in the molecular frame and that the isotropic and anisotropic contributions have to be transformed into the laboratory frame. The third term in
Equation (1) represents the nonresonant nonlinear contribution, which may
be quite strong in liquid mixtures and solutions and exists only for temporal
overlap of the excitation and probing pulses (34). The following expressions can be derived for the three scattering components in the resonant
case, ωL ωS D ω0 (35):
Piso t D Fiso EP t
Paniso t D Faniso EP t
Pnr t D Fnr EP t
t
tD
tD
1
t
vib t
1
vib t
tD EL t ES t
Ł
t0 EL t0 ES t0
t0 or t
Ł
dt0
t0 EL t0 ES t0
2
Ł
dt0
3
4
EP , EL , and ES denote the electric field amplitudes of the three input
pulses (probe, laser, and Stokes). tD is the delay time of the probe field
Copyright © 2001 by Taylor & Francis Group, LLC
relative to the coincident excitation components. It is important to note
that the relative contributions of P depend on the orientations of the electric field vectors, i.e., chosen polarization geometry. The latter effect is
described in Equations (2)–(4) by the time-independent prefactors F that
are explicitly known (see below). The F’s also contain the different coupling
elements of ∂˛/∂q and nr [Equation (1)]. vib and or , respectively, represent the vibrational and orientational autocorrelation functions of individual
molecules and enter Equations (2)–(4) in various ways; the resulting differences in temporal behavior of the scattering parts are significant. The
equations above refer to moderate pulse intensities so that stimulated amplification of the Stokes pulse and depletion of the laser pulse can be ignored.
The measured CARS signal Scoh is proportional to the time integral
over the absolute value squared of the total third-order polarization, P D
Piso C Paniso C Pnr , because of the slow intensity response of the detector:
Scoh tD D const ð
1
1
jP t, tD j2 dt
(5)
The signal Scoh represents a convolution integral of the intensity of the
probing pulse / jEP t tD j2 with the molecular response; the latter is
governed by the autocorrelation functions vib and or . Numerical solutions
of Equations (2)–(5) are readily computed and will be discussed in the
context of experimental results.
vib and or also show up in the theory of spontaneous Raman spectroscopy describing fluctuations of the molecular system. The functions
enter the CARS interaction involving vibrational excitation with subsequent
dissipation as a consequence of the dissipation-fluctuation theorem and
further approximations (21). Equations (2)–(5) refer to a simplified picture;
a collective, delocalized character of the vibrational mode is not included
in the theoretical treatment. It is also assumed that vibrational and reorientational relaxation are statistically independent. On the other hand, any
specific assumption as to the time evolution of vib (or or ), e.g., if exponential or nonexponential, is made unnecessary by the present approach.
Homogeneous or inhomogeneous dephasing are included as special cases. It
is the primary goal of time-domain CARS to determine the autocorrelation
functions directly from experimental data.
Regarding the relationship between CARS and conventional Raman
spectroscopy, as is evident from the equations above, the scattered antiStokes field amplitude (proportional to P) depends linearly on the autocorrelation functions. With respect to molecular dynamics and disregarding the
minor point that the field amplitude is not directly measured, CARS is a
Copyright © 2001 by Taylor & Francis Group, LLC
linear spectroscopy and cannot provide more information than is available
from conventional Raman spectroscopy. On the level of present theoretical
approaches, both methods are simply related by Fourier transformation and
deliver the same information. This is of course only true in principle, not in
practice for real measurements, because of the different role of experimental
accuracy in the two techniques. For example, the asymptotic exponential
decay of vib was observed over more than three orders of magnitude, while
the Raman bandshape could not be measured with similar precision because
of the contributions of neighboring lines, especially in congested parts of
the spectrum. In short, coherent experiments can provide dephasing data
of superior accuracy. On the other hand, conventional Raman spectroscopy
is well suited for measuring frequency positions or shifts. The time- and
frequency-domain versions of vibrational spectroscopy are complementary,
and the combination of the respective results is particularly rewarding.
As far as CARS distinguishing between homogeneous and inhomogeneous broadening mechanisms, some investigators supported the idea that
CARS as a linear technique with respect to molecular response does not
do this (36). The present authors question that opinion; in fact, examples
will be discussed below in which dephasing in the homogeneous, intermediate, or inhomogeneous case was distinguished on the basis of femtosecond
CARS data. On the other hand, it is generally accept that higher-order techniques like infrared echo or Raman echo measurements can more directly
differentiate between homogeneous and inhomogeneous dephasing mechanisms (37).
Two important improvements in time-domain CARS spectroscopy
have been made in recent years and will be briefly discussed in the following
areas:
High-precision CARS (38)
CARS with magic polarization geometry (35,39)
C. Experimental Aspects
In the early days of time-resolved CARS it was often convenient to use
laser and probing pulses at the same frequency position, leading to twocolor CARS ωP D ωL . The approach has the disadvantage that secondary
interaction processes of the excitation pulses also generate emission at the
anti-Stokes frequency position ωL C ω0 , representing an undesirable background (not depending on delay time) for the detection of the coherent
probe scattering at ωP C ω0 . In more advanced approaches, therefore, the
frequency coincidence is avoided (22,38). The latter version, three-color
Copyright © 2001 by Taylor & Francis Group, LLC
CARS, can provide more accurate data because of its higher sensitivity
and lower intensity level of the excitation pulses. The preferred frequency
position of the probing pulse, in general, is between the laser and Stokes
components, ωL > ωP > ωS . We mention here that phase matching arguments for anti-Stokes scattering (21) would suggest a frequency position
close to the Stokes frequency, but the finite bandwidth of ultrashort pulses
makes a significant frequency shift necessary between the (intense) laser
pump and (weak) anti-Stokes scattering at ωP C ω0 .
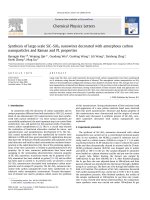
As an example the experimental apparatus used by the authors’ group
is briefly discussed. The system is based on femtosecond dye laser technology and depicted schematically in Fig. 2b (38,40). Using an amplified and frequency-doubled, modelocked Nd-YLF laser with repetition rate
50 Hz for synchronous pumping, a hybrid modelocked dye-laser oscillator
is operated. After multipass dye amplification of a single pulse, part of the
laser radiation is directed to a quartz plate for continuum generation. Out of
the produced spectral broadening, two frequency bands are selected by pairs
of interference filters and amplified in two additional dye amplifiers for the
generation of the Stokes and probe pulses. Together with the second part
of the laser pulse that also passes narrow-band filters, three different input
pulses of approximately 250 fs duration and 50–70 cm 1 width are accomplished. For a given set of three pairs of interference filters and amplifier
dyes, tuning ranges of the three pulses are accomplished by angle variation
of the filters (565–571 nm, 675–689 nm, and 605–619 nm for L, S, and P,
respectively). A nonlinear absorber cell (NA) in the probe beam in front of
the sample improves the pulse contrast and helps to increase the dynamical
range of the CARS scattering signal.
Applying /2 plates and a Glan polarizer (Pol1), parallel linear
polarization of the input laser and Stokes pulses is adjusted. For reasons
discussed below the polarization plane of the probe pulse (Pol2) is inclined
by an angle ÂP D 60° with respect to the pump polarization, while in earlier
work an angle of 90° was used. High-quality polarization optics including a
2 mm sample cell practically free of stress birefringence are used. An offaxis beam geometry is adopted providing phasematching for the anti-Stokes
scattering of the probe pulse, as calculated from refractive index data.
The coherent Raman scattering is measured behind an analyzing
polarizer (Pol3) transmitting radiation with the polarization plane oriented
at angle ÂA relative to the vertical pump polarization. A small aperture (AP)
defines the solid angle of acceptance (³10 5 sr) along the phasematching
direction. The scattering is detected at the proper anti-Stokes frequency
position, using dielectric filters (IF) with a bandwidth of 80 cm 1 , variable
Copyright © 2001 by Taylor & Francis Group, LLC
Figure 2 (a) Polarization geometries for the suppression of the nonresonant (˛), resonant-isotropic (ˇ),
and resonant-anisotropic ( ) CARS components. Constant polarization of the input fields EL , ES , and EP ;
magic angles ÂA for the orientation of the detected anti-Stokes field EA . (b) Schematic diagram of the
experimental system for three-color CARS with magic polarization conditions. NA, nonlinear absorber;
VD, variable delay; Pol1-Pol3, polarizers; A, aperture; F, calibrated neutral filters; IF, interference filters;
PM, photomultiplier.
Copyright © 2001 by Taylor & Francis Group, LLC
neutral filters (F), and a photomultiplier (PM). The input pulse energies
are also monitored and used to correct the signal amplitude for the single
shot fluctuations <20% of the input pulses. The instrumental response
function, determined by a measurement of the nonresonant CARS signal
of carbon tetrachloride [compare Equation (4)] decays exponentially over
an accessible dynamical range of 106 , suggesting exponential wings of the
input pulses. From the decay of the curve with a slope of 1/60 fs 1 , the
available experimental time resolution is deduced. In earlier applications
of the experimental setup a slightly different time resolution of 80 fs was
achieved. An example is shown in Fig. 3a (open circles, dashed curve). For
the adjusted frequency difference in wavenumber units of ωL ωS /2 c D
2925 cm 1 in CCl4 , off-resonance CARS via the nonresonant part nr of
the third-order nonlinear susceptibility is measured and plotted in the figure
on a logarithmic scale. The signal maximum is normalized to 1, while its
abscissa position defines zero delay. The observed steep signal decay by a
factor of 106 within 1 ps is noteworthy.
1. High Precision fs-CARS
For a demonstration of the performance of the instrumental system, some
results for neat acetone at room temperature are depicted in Fig. 3a (38).
The symmetrical CH3 stretching mode at 2925 cm 1 is resonantly excited.
The anti-Stokes scattering signal of the probing pulse with perpendicular
polarization plane relative to the pump beams is plotted versus delay time
(full points, logarithmic scale). The maximum scattering signal (exceeding
the off-resonance scattering of CCl4 by two orders of magnitude) is normalized to unity and displays a small delay relative to the instrumental response
function. For tD > 0.5 ps the signal transient decreases exponentially over
a factor >106 corresponding to a linear dependence in the semi-log plot.
From the slope of the decay curve the time constant T2 /2 D 304 š 3 fs is
directly deduced. For long delays a weak background signal shows up. The
solid curve in Fig. 3a is calculated from Equations (2)–(4). The relevant
fitting parameter for the resonant CARS signal is the dephasing time T2 .
The accuracy of the data is illustrated by Fig. 3b. The ratio of the
signal amplitudes of the experimental points to that of the calculated signal
curve of Fig. 3a is plotted. It is interesting to see the minor scatter of the
data with approximately constant experimental error (Ä10%) in spite of the
signal variation over many orders of magnitude. Each experimental point
represents the average of approximately 400 individual measurements. The
reproducibility of the slope of the signal decay is better than š3 ð 10 3 .
Copyright © 2001 by Taylor & Francis Group, LLC
Figure 3 Femtosecond nondegenerate CARS in liquids: (a) Coherent probe scattering signal versus delay time; open circles, dashed curve: nonresonant scattering
of CCl4 yielding the instrumental response function and the experimental time resolution of 80 fs; full points, solid line: resonant CARS signal from the CH3 -mode of
acetone at 2925 cm 1 , obtaining T2 /2 D 304 š 3 fs. (b) Ratio of experimental and
calculated scattered data of (a) for acetone versus delay time; the small experimental
error of the data points extending over 6 orders of magnitude is noteworthy.
Copyright © 2001 by Taylor & Francis Group, LLC