S and c
Bạn đang xem bản rút gọn của tài liệu. Xem và tải ngay bản đầy đủ của tài liệu tại đây (11.94 MB, 675 trang )
Back
Home
Search
VOLUME 5 S&C on CD
Ch
In This Issue ..........................................................................
by John Sweeney, Editor
9
1
Back Trak/High Tech ............................................................
10
Product Review: Direc-Tree Plus ........................................
14
Product Review: MetaStock Downloader ...........................
15
Product Review: Master Chartist.........................................
by John Buchowski
19
Historical Data .......................................................................
24
Computer Investment Software ...........................................
28
In This Issue ..........................................................................
by John Sweeney, Editor
Ch
49
2
In Search of the Perfect System ..........................................
50
Are There Patterns in Financial Ratios? ............................
by Clifford J. Sherry, Ph.D.
56
Profitability of Selected Technical Indicators: U.S. T-Bond
by Steven L. Kille and Thomas P. Drinka
59
Generalship for Consistent Profits .....................................
by Vincent Cosentino
62
Trend of the Trend ................................................................
by Gregory L. Morris
64
Applying Statistical Pattern Recognition to Commodity ..
by Scott Brill
67
Product Review: Ganntrader I .............................................
by Hans Hannula, Ph.D.
72
Product Review: C3KANSYS................................................
by John Sweeney
77
Ch In This Issue ..........................................................................
81
3
Copyright (c) Technical Analysis Inc.
Back
Home
Search
VOLUME 5 S&C on CD
by John Sweeney, Editor
Ch Letters to S&C ......................................................................
82
DJIA/NYSE Auto/Cross-Correlations ..................................
by Frank Tarkany
85
Profitability of Selected Technical Indicators: Silver ........
by Thomas P. Drinka and Steven L. Kille
86
Sweeney Agonistes .............................................................
88
Changing Tides in the Investment Software Market .........
by Thomas A. Rorro
89
In Search of the Cause of Cycles ........................................
by Hans Hannula, Ph.D.
93
Wyckoff in Action, Part 2 ....................................................
by David Weis
99
A Complete Computer Trading Program , Part 1 ...............
by John F. Ehlers
102
Product Review: Market Manager Plus .............................
105
Product Review: Personal Options Advisor ......................
by Hans Hannula
108
Assessing Risk on Wall Street ............................................
by Robert W. Hull
112
In This Issue ..........................................................................
by John Sweeney, Associate Editor
115
Interview: Van K. Tharp, Ph.D.: Trader’s Psychologist .....
by John Sweeney
116
Letters to S&C ......................................................................
120
An After-Christmas Story......................................................
by Ron Jaenisch
121
Floor Talk ...............................................................................
126
3
Ch
4
Copyright (c) Technical Analysis Inc.
Back
Home
Search
VOLUME 5 S&C on CD
by William Eng
Ch Weekly Price Cycles: Evidence of Auto-Correlation..........
127
Profitability of Selected Technical Indicators: ..................
by Steven L. Kille and Thomas P. Drinka
128
Calculating Retracements.....................................................
by Hal Swanson
132
Wyckoff Method, Part 9: Selecting the Best Individual
by Jack K. Hutson
136
Hardcard Offspring ...............................................................
by Howard Falk
140
A Helping Hand from the Arms Index .................................
by James Alphier and Bill Kuhn
142
A Complete Computer Trading Program, Part 2 ................
by John F. Ehlers
144
Using Maximum Adverse Excursions for Stops ................
by John Sweeney
149
Ch
In This Issue ..........................................................................
by John Sweeney, Associate Editor
153
5
Tools for Thinking Traders: MicroVest’s Steven Kille........
154
Letters to S&C ......................................................................
157
Wyckoff Method, Part 10: Refining Chart Analysis ...........
by Jack K. Hutson
158
Relative Strength Index Profitability With Money ..............
by Thomas P. Drinka and Steven L. Kille
162
How to Spot Takeover Candidates ......................................
by Norman S. Wei
165
Cycles and Chart Patterns ...................................................
by Anthony F. Herbst
171
4
Copyright (c) Technical Analysis Inc.
Back
Home
Search
VOLUME 5 S&C on CD
Book Review: The Big Hitters..............................................
by Dr. Alexander Elder
173
Book Review: Technical Analysis of the Futures Markets
by John Sweeney
174
A Complete Computer Trading Program, Part 3 ................
by John F. Ehlers
175
Enhanced Williams’ %R........................................................
by Robert J. Kinder, Jr.
180
Product Review: Market Analyzer Plus ...............................
183
In This Issue .........................................................................
by John Sweeney, Associate Editor
Ch
187
Ch
5
6
Interview: Larry Williams: Where Will He Go Next?...........
188
Letters to S&C ......................................................................
191
Wyckoff, Part 11: Maximizing Profits With Stop Orders ...
by Jack K. Hutson
192
Artificial Intelligence .............................................................
by Neil Gordon, Ph.D.
195
Modern Portfolio Theory: A Powerful Tool for Futures ....
by Gary S. Antonacci
200
A Complete Computer Trading Program, Part 4 ................
by John F. Ehlers
203
Winning Under Stress: The Fight-Flight Reaction .............
by Van K. Tharp, Ph.D.
207
How to Be Wrong and Still Profit .........................................
by David L. Caplan
211
Eurodollar Futures Using Entry/Exit Methods Combined
by Steven L. Kille and Thomas P. Drinka
214
Quick Scans ..........................................................................
217
Copyright (c) Technical Analysis Inc.
Back
Ch
Home
Search
VOLUME 5 S&C on CD
by John Sweeney
Product Review: Telescan Stock Evaluation Service ........
by John Sweeney
218
Product Review: Speculator, The Futures Market Game ..
222
Ch
In This Issue ..........................................................................
by John Sweeney, Associate Editor
225
7
Stop Worrying Yourself Out of Profits.................................
226
Letters to S&C
.................................................................
229
Forecasting the Market with theOverbought/Oversold ....
by Steven B. Achelis
231
The Algebra of Inequalities ..................................................
by Donald D. Bump, Ph.D.
233
Intraday Swings with Wave Charts......................................
by Jack K. Hutson
236
Modern Portfolio Theory in Managed Futures, Part 2 .......
by Gary S. Antonacci
239
Using Stochastics.................................................................
by Cynthia Keel and Heidi Schmidt
242
Product Review: The Kelly Hotline .....................................
by Bob Bukowski
245
Mutual Fund Timing
................................................................
by Fay H. Dworkin, Ph.D.
247
Product Review: Using ProfitTaker.....................................
by Terry Apple
251
Book Review: The Professional Option Trader’s Manual
by John Sweeney
254
6
Ch In This Issue ..........................................................................
8
by John Sweeney, Associate Editor
Copyright (c) Technical Analysis Inc.
257
Back
Home
Search
VOLUME 5 S&C on CD
Ch
Estimating the Market Profile Value Area for Intraday ......
by Donald L. Jones
258
8
Letters to S&C ......................................................................
260
The TEM Trading Systems and How It All Began .............
by William Cruz
262
War Stories from Commodex ..............................................
by Philip Gotthelf
264
Introduction to Spread Investing, Part 1............................
by Frank Taucher
269
Product Review: Economic Investor II ...............................
by Bob Lang
272
Product Review: Essex Eurotrader.....................................
by John Sweeney
275
Building a Trading System ...................................................
by Frank Alfonso
281
Gap Watching .......................................................................
by Joe Van Nice
284
In This Issue ..........................................................................
by John Sweeney, Associate Editor
Ch
287
9
Profitability of Selected Technical Indicators: ..................
by Thomas P. Drinka and Steven L. Kille
288
Point/Counterpoint (Markov Analysis) ...............................
292
Wyckoff Part 13: Serving a Trading Apprenticeship .........
by Jack K. Hutson
294
Spread Investing
Tools of the Trade, Part 2 ................
by Frank Taucher
297
Want to Try Something HOT!? ............................................
by John Sweeney
301
Copyright (c) Technical Analysis Inc.
Back
Home
Search
VOLUME 5 S&C on CD
Money supply (M2): A Leading Economic Indicator ..........
by Clifford J. Sherry, Ph.D.
In This Issue.......................................................................
by John Sweeney, Editor
Ch
10
304
311
Quick-Scans .........................................................................
312
Letters to S&C .......................................................................
314
Wyckoff, Part 14: Developing a Personal Trading Style ...
by Jack K. Hutson
316
Cyclical Analysis of Stock Prices with Astrology .............
by Robert S. Kimball
319
Spread Investing
Advanced Concepts, Part 3 ..............
by Frank Taucher
326
The Loss Trap .......................................................................
by Van K. Tharp, Ph.D.
331
Book Review: Understanding Randomness ......................
by Clifford J. Sherry, Ph.D.
325
How to Use Maximum Entropy ............................................
by John F. Ehlers
334
Product Review: Options-80A..............................................
by Hans Hannula, Ph.D.
340
Ch
In This Issue ..........................................................................
by John Sweeney, Editor
347
11
Letters to S&C .......................................................................
348
Cycles Without Tears ............................................................
by Hans Hannula, Ph.D.
350
Market Profile and Market Logic, Part 1 .............................
by Thomas P. Drinka and Robert L. McNutt
352
Flaws in the Roulette Wheel ................................................
356
Copyright (c) Technical Analysis Inc.
Back
Home
Search
VOLUME 5 S&C on CD
by Curtis McKallip, Jr.
Ch Spread Investing, Part 4 .......................................................
11
361
by Frank Taucher
Market Strategy (Wyckoff Method, Part 15) ........................
by Jack K. Hutson
364
On Tips and Tipsters ............................................................
by Vincent Cosentino
369
The Danger in Profits............................................................
by Van K. Tharp, Ph.D.
371
Price/Volume Cross-Correlations in the DJIA ....................
by Frank Tarkany
374
Product Review: Volatility Breakout System......................
by John Sweeney
377
Product Review: Macro*World Investor..............................
380
Copyright (c) Technical Analysis Inc.
Stocks & Commodities V. 5:1 (10-13): Back Trak High Tech
Back Trak High Tech
MicroVest
P.O. Box 272
Macomb, IL 61455
(309) 837-4512
Instruments: Stocks, Futures
Computer: IBM PC, XT, AT with 512K; 2 floppies or 1 floppy and 1 hard disk - drive; DOS 2.0 or
higher; IBM graphics card and/or color monitor supported; 80-or 132-column IBM/EPSON
compatible printer.
Databases Supported: Commodity Systems, Inc., 200 W. Palmetto Pk. Rd., Suite 200, Boca Raton,
FL 33432, (305) 392-8663; Nite Line, 175 West Jackson, Suite A 1038, Chicago, IL 60604, (312)
427-5125.
Prices: Back Trak and High Tech (IBM only) $695; High Tech $295.
T
his is a slick package and probably a "Best Buy." It will store data for you, extract it for study, apply
up to 51 different technical studies to it, graph the results (on High Tech only) for your visual inspection,
run simulations of trading strategies using the studies and techniques of money management that you
select, and, finally, optimize the parameters of those studies to produce a trading system. The only thing
left to do is phone in the orders!
Back Trak/High Tech is competitive with packages such as CompuTrac ($ 1,500) and, to some extent,
Profit Taker ($995), Swing Trader ($ 1,595), and SPECTRUM ($2,500). All except CompuTrac
generally hand you a set of tools (i.e.: technical analysis indicators) which may or may not be disclosed,
and let you test your own range of parameters on whatever time series of prices you select to find the
"best" parameter set for your own personal trading system.
So popular has this approach become that one vendor has a total black box on the market with a contest
to find the mysterious best parameters! Here we are reducing trading to a game show, an approach which
I must protest. The good folks who did this probably wanted to showcase the data/software in a friendly
manner and have some fun at the same time, but it still irks me. I must be turning into a prude in my old
age.
Fortunately, there is a serious alternative. Back Trak/High Tech is cheaper than its competitors and it has,
by far, the most technical indicators to compute and test. They are all disclosed and explained. The flip
side is that it is more of a toolbox than a way of thinking, as some of the others are. You will have to
supply some thought and conceptualization to the selection of the indicators you want. From my point of
view, that's ideal. It's the right way to go about trading.
So--how does it work? First of all, I tested it on a 64OK IBM-like ghost (the name had been etched off by
Article Text
Copyright (c) Technical Analysis Inc.
1
Stocks & Commodities V. 5:1 (10-13): Back Trak High Tech
the liquidator) with a 10 megabyte hard drive, a mystery monitor (ditto), and a Panasonic KX-P1093
printer programmed to look like an Epson FX-185. On this rig, which has run everything ever sent No
me, everything about Back Trak/High Tech worked, no questions asked, with the exception of the output
to the printer which worked sporadically! Dumping to files worked without a hitch and is probably the
better idea.
The High Tech module is the place to start. Do not skip the setup choices on the menu. Take the time to
tell the program in which directory it may find its data and try to adjust the color schemes to your eyes.
About the only complaint I have about the programming is that someone put lines through the menu bars,
making them practically illegible on color screens with lower resolution.
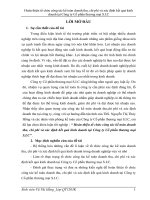
The homework being done, go directly to the meat: TECHNICAL INDICATORS. Figure 1 is a screen
dump of your choices. You just highlight the one you want, specify your parameters (or take proprietor
Steve Kille's defaults) and tell the machine where you want it on the screen and how big you want it. A
typical result is Figure 2. This takes less than a minute.
To add additional indicators, either on the graph you have or on another section of the screen, hit Return
to go back to the TOOLS menu and Return again to select the TECHNICAL INDICATORS. Page the
cursor to the one you want, set parameters and position on the screen--there it is. Not only is this fast, it's
simple. Most prompts can be answered with Return so the process really flies.
You can set up the screen many different ways. See Figures 3 and 4 as alternatives. In color, they can be
spectacular. Not as good as my kids' space wars games on the Commodore but close! Printed out, as they
are here, they lose punch but I don't suggest printing them out anyway. You'll quickly bum up a lot of
paper to which you'll seldom refer. Leave it in the machine where it can be regurgitated at lightning speed
and save your filing space.
Let's talk about hitches in High Tech. Really, I can think of only one. You don't get to select the
beginning and ending dates of the prices graphed. It seems to me an obvious improvement. As to quality,
point-and-figure charts are missing! These really are a staple. I've expounded on their value before so
there's no point in beating the drums again. They'd be very nice to have.
Assuming you've done your homework with the indicators and graphics, you'll next want to see if your
insights can make money. Step out of High Tech and call up Back Trak (let's call it BT). You're going to
love this: it feeds the trader's maniacal search for just the right set of numbers to produce money. What
Kille has done to you here is give you just about every conceivable way of trading just about every
conceivable indicator. Ninety-eight percent of the time BT will do what you want. For the other 2
percent, a formula builder is under development and may be available by the time you read this.
Let me show you what I mean with illustrations right off the screen. I could never discuss all the
possibilities in an article of this length.
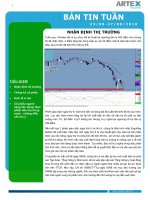
The first screen you'll run across is the Simulation Setup menu (Figure 5). The sequence of items is
important. In order to run a simulation, you cycle through each item which you wish to specify. It serves
as a very fast checklist to select the indicators you want (Figure 6) and their parameter ranges; the data
files (manual or automated updating, CSI format, Figure 7); your stop strategy (Figure 8) and its
parameters; your entry and exit method (Figure 9) and the optimization criterion (Figure 10). The prudent
trader will also use the output option to limit the printing which could be truly voluminous!
Those are just the items I used routinely. You may very well use the others, of which a unique one is the
Article Text
Copyright (c) Technical Analysis Inc.
2
Stocks & Commodities V. 5:1 (10-13): Back Trak High Tech
ability to trade using fundamental data as a filter. The forecast option is also intriguing--you stick in your
adviser's best shots and the program will trade off it. Imagine what this could do to the advisory business!
What you get back from all this is something like Figure 11, the minimum for which you can ask. You
could get a summary for every possible combination of parameters. You could get a listing of every trade
taken. You COULD get a listing of every single day's action or inaction. Save a forest: it's best to put this
on disk for review with your word processor. From the various outputs, you winnow out the parameters
whose broad range isn't profitable. At least, that's the idea of optimizing. A better approach is to come up
with your own characterization of the market and use this toolbox to check it out objectively.
Provided in the program is an option called real-time testing. Here you take parameters you've developed
from, say, three years' data and apply them to the next year's contracts to see if they continue produce
profits. This is a prudent practice, to say the least, and speeds up the paper trading stage immensely.
To MicroVest's credit, they thoroughly air the pluses and minuses of optimization. Since optimization
became an enthusiasm, its value has been questioned. The markets reflect a lot of random input from the
rest of the world and the resultant time-series of prices sometimes have larger components of randomness
than order. If I had to summarize the discussion, I'd say that all the number-grinding has produced fairly
stable sets of values with relatively short time horizons. However, even knowing there is a steady 6-day
cycle in DMarks doesn't produce infallible trading rules. Continuous monitoring of the series for
untoward behavior, disciplined executions, and prudent loss management are still essential.
One quick word about the nuts and bolts. Both High Tech and Back Trak come with dense, 200-page
manuals which are an education in themselves, especially the discussion of the various indicators. At
first, I thought that Back Trak didn't contain a tutorial, but it's tucked in the back of the manual and
omitted from the table of contents. Use it. The program itself is thoroughly menuized and it is easy to
look up (in the manual) the stage where you are lost. I got installed and running immediately, but got lost
off and on for about the first two hours before I figured out the menu sequence. After that, things are a
breeze.
Well, none of us can afford to buy everything. Where does High Tech/Back Trak stand in the
marketplace? I'd say it's right at the top, especially in terms of value. Only CompuTrac has more material
and it's more costly, tougher to use, and has a lot of outdated, mysterious routines in it. High Tech/Back
Trak is so smooth, I'd hand it to new traders, confident they'd get both their money's worth and a tool with
which they can grow almost indefinitely.
Winning on Wall Street, my former pick for novices (until MetaStock came along), does have accounting
and adaptive filtering modules not found here. But after that, it's no contest except that it's cheaper ($195)
because it's canned and has no optimization. Since Summa Software apparently had serious financial
difficulties, its support is also questionable. MetaStock, my current introductory favorite is cheaper than
High Tech/Back Trak at $195, but has nothing like Back Trak--it's really only competitive with High
Tech.
CSl's Quickstudy list of programs is thinner, though more innovative and proprietary. Quickstudy has no
optimization and there's no explanation of the way some of the newer studies work. Besides, you should
get CSI's basic analytical tools in Quicktrieve if you get your data via CSI.
Conclusion? High Tech/Back Trak is the one to get for the technical trader.
• CompuTrac, 1021 Ninth St., New Orleans, LA 70115, (800) 535-7990.
Article Text
Copyright (c) Technical Analysis Inc.
3
Stocks & Commodities V. 5:1 (10-13): Back Trak High Tech
• MetaStock, Computer Asset Management, P.O Box 26743, Salt Lake City, UT 84126, (801) 964-0391.
• ProfitTaker, 1430 W. Busch Blvd., Suite 4, Tampa, FL 33612, (813) 933-1164.
• Spectrum, Technicom, Inc., 736 NE 20th Ave., Ft. Lauderdale, FL 33304, (305) 523-5394
• Swing Trader, The Pardo Corp., 1615 Orrington Ave., Suite C202, Evanston, IL 60201, (312)
866-9342.
• Winning on Wall Street, available through SCIX Corp., (800) 228-6655.
FIGURE 1
Figures
Copyright (c) Technical Analysis Inc.
4
Stocks & Commodities V. 5:1 (10-13): Back Trak High Tech
FIGURE 2
FIGURE 3
Figures
Copyright (c) Technical Analysis Inc.
5
Stocks & Commodities V. 5:1 (10-13): Back Trak High Tech
FIGURE 4
FIGURE 5
Figures
Copyright (c) Technical Analysis Inc.
6
Stocks & Commodities V. 5:1 (10-13): Back Trak High Tech
FIGURE 6
FIGURE 7
Figures
Copyright (c) Technical Analysis Inc.
7
Stocks & Commodities V. 5:1 (10-13): Back Trak High Tech
FIGURE 8
FIGURE 9
Figures
Copyright (c) Technical Analysis Inc.
8
Stocks & Commodities V. 5:1 (10-13): Back Trak High Tech
FIGURE 10
FIGURE 11
Figures
Copyright (c) Technical Analysis Inc.
9
Stocks & Commodities V. 5:1 (28-47): Computer Investment Software
COMPUTER INVESTMENT SOFTWARE
A/R Graphics
REINHART INDUSTRIES
1250 OAKMEAD PKY STE 210
SUNNYVALE, CA 94088
408-738-2311
This is a program used by investors to determine their daily orders and to test out their trading methods. It
draws the following lines: Schiff, Andrews Median Lines, Trend & Parallel lines, Moving Average
Channel Lines, Angles, Gann Lines, Fibonacci Time Cycle lines, Action Reaction lines, and more. Adds
up to 30 days on the screen without redrawing lines or reloading data. Converts daily data to weekly or
monthly. Menu driven, and comes with CSI compatible data. For use on the IBM or Apple. Cost: $595.
Baron
BLUE CHIP SOFTWARE
6744 ETON AVENUE
CANOGA PARK, CA 91303
818-346-0730
Real Estate speculation is no longer a pastime reserved for the idle rich. Now, everyone can play the
game--rich or poor, daredevil or conservative, young or old--with Baron, the real estate simulation. Learn
the ins and outs of investing in commercial, residential, or undeveloped property. But don't count your
mortgages too soon. Just when you think it's safe to call yourself a millionaire, any number of world or
local events can come into play and send you to the poorhouse. That's Baron--exciting, realistic, and
practical. Cost: $59.95 (IBM), $49.95 (Apple), $29.95 (Commodore), $59.95 (Macintosh).
Bond Control System (BONDCO)
HARDAN GROUP INC
160 EAST 38TH ST
Article Text
Copyright (c) Technical Analysis Inc.
1
Stocks & Commodities V. 5:1 (28-47): Computer Investment Software
NEW YORK, NY 10016
212-697-2370
Bond Control System (BONDCO) is a user friendly computer system for fixed income securities
(including financial futures) that runs on an IBM PC. The system calculates, maintains and produces:
confirmations and delivery tickets; trade data blotters; sale and purchase settlement data blotters; historic
database; accounting positions; trading positions; profit/loss, interest earned, interest accrued,
amortization; margin call amounts for financial futures; customer statements; stock record; general
ledger; repos and reverse repos. Cost: $3,000 to $40,000.
BondWare
DAVIDGE DATA SYSTEMS CORP
12 WHITE ST
NEW YORK, NY 10013
212-226-3335
BondWare is a decision support tool for fixed-income security investors and accounting personnel.
BondWare integrates yield calculation, portfolio filing, portfolio analysis and swap analysis in one easy
to use package. Complete bond data includes after-tax information, duration and analysis of GNMAs and
mortgages. Special features include a link to Lotus spreadsheet products, amortization/accretion tables,
bond database access and strip yield charts. For IBM PC/XT/AT or compatibles Cost: $450.
Bonds & Interest Rates
PROGRAMMED PRESS
2301 BAYLIS AVE
ELMONT, NY 11003
516-775-0933
Interactive programs for forecasting and evaluation of price, risk, and return on fixed income securities:
bonds, T-bills, mortgages, and present value of annuities and lump sums. Also, 220-page Computer
Assisted Investment Handbook. Cost: $119.95 (Your cost: $107.95).
Bondware Bond Yield Calculation Screen
DAVIDGE DATA SYSTEMS CORP
12 WHITE ST
NEW YORK, NY 10013
Article Text
Copyright (c) Technical Analysis Inc.
2
Stocks & Commodities V. 5:1 (28-47): Computer Investment Software
212-226-3335
This hard disk installable program provides quick and accurate yield calculations on pre and after tax
bases, including TEFRA, for all types of fixed income securities. Special features include duration,
realized compound yield, call yields, odd first coupon dates, issues dates, current yield, variable service
charges and prepayment dates on mortgages and GNMAs, bond equivalent yield on CD's and T-bills, and
more. Cost: $69.95.
COMMX Micro Software
HAWKEYE GRAFIX
3415 HYDE PARK DR
CLEARWATER, FL 33519-1527
813-786-8161
Multi-terminal emulator and file transfer available for over 100 different computer configurations: 8 bit
and 16 bit, including the IBM PC/XT/AT and compatibles. Operating systems supported: CP/M 80, PC
DOS, MS DOS, and others. Cost: $99 per micro.
CONSOLX Micro Software
HAWKEYE GRAFIX
3415 HYDE PARK DR
CLEARWATER, FL 33519-1527
813-786-8161
Provides a software mechanism to access computers by phone and operate them remotely. Available for
most computers operating under CP/M 80, PC DOS, and MS DOS. Easy to install and use; access by
password; automatically run a selected program to a caller; disconnect on loss of carrier (even if another
program is currently running) so the next caller may access the system. Cost: $69 per micro.
CV Evaluator
BETA SYSTEMS
BOX 1189 GMF
BOSTON, MA 02205
617-861-1655
Article Text
Copyright (c) Technical Analysis Inc.
3
Stocks & Commodities V. 5:1 (28-47): Computer Investment Software
CV Evaluator is convertible securities software. The program has been designed to provide the user with
a large database of convertible bonds and preferred stocks and calculational tools to identify and analyze
securities of interest. The current database is about 600 CVs. CV Evaluator allows the user to freely edit
its database. Additional CVs may be added or the existing ones updated. A datafile can be screened,
sorted, or displayed in graphical form. Individual CVs may be more closely analyzed by use of "what-if'
analysis and historical plotting. The program is offered on a subscription basis. Each month the user
receives a diskette with updated database and program correlations that characterize the then current
interest rate and CV markets. A single full capability, limited database trial diskette issue is available for
$25. Cost for the Evaluator: $325/year.
Calendar Calculator
CTCR
1731 HOWE AVE STE 149
SACRAMENTO, CA 95825
916-929-5308
Those traders who use cycles and Fibonacci or Gann time projections know how tedious it is to count
days on the charts. Bruce Babcock has designed a computer program that will do it for you! Its basic
function is to count days or weeks, but it is very flexible. For cycle work, you enter the cycle bottom or
top dates and the program instantly tells you their distance apart. For projections, you enter the
significantly high or low dates and what kind of time projections you want. The Calendar Calculator
automatically gives you each projection from the date you entered, and it will even print out all
projections in chronological order so you can see where they "cluster." Requires IBM or compatible
computer with 64K, Apple II series or compatible with 48K, one or two disk drives, monochrome
display, supports any printer. Cost: $95.
Champion
INVESTORS MICRO SOFTWARE
P.O. BOX 319
HARVARD, MA 01451
617-772-5950
Champion is the improved Jesse Livermore system with Fibonacci harmonies. Trading system software
for the Apple and IBM-PC.
Commission Comparisons
NEWTEK INDUSTRIES
P.O. BOX 46116
HOLLYWOOD, CA 90046
213-874-6669
Article Text
Copyright (c) Technical Analysis Inc.
4
Stocks & Commodities V. 5:1 (28-47): Computer Investment Software
Commission Comparisons is a brokerage database designed to show the market trader how 11 selected
discount brokerages and one full-service brokerage compare in commission cost for any particular
transaction in stocks, options, or bonds. The user enters the number of shares, contracts, or bonds and
price accordingly. The trader can readily see how they compare, the exact differences, how the
comparison changes according to the transaction, and how a particular trade can be designed for
minimum commission. At the press of a number key, the vital statistics concerning the brokerage of
choice are displayed on the screen, including toll-free numbers, nationwide offices, and special trading
requirements where applicable. Cost: $39.95.
Commodities and Futures
PROGRAMMED PRESS
2301 BAYLIS AVE
ELMONT, NY 11003
516-775-0933
Interactive programs for forecasting and evaluation of price, risk and return on futures contracts including
soybean spreads and arbitrage. Handbook included. Cost: $119.95 (Your cost: $107.95).
Commodity Futures Charts
ENSIGN SOFTWARE
7337 NORTHVIEW
BOISE, ID 83704
208-378-8086
Plots real-time tic charts and historical charts on an IBM-PC computer from the Bonneville
Telecommunications Market Monitor data stream. Shows stochastics, parabolic stop, RSI, moving
averages, oscillator. Keltner channel, directional move index, Fibonacci, Volume, and open interest. Bar
variations: 1-120 minutes, daily and weekly. Free demonstration. Cost: $895.
Compu/Chart 1
NEWTEK INDUSTRIES
P.O. BOX 46116
Article Text
Copyright (c) Technical Analysis Inc.
5
Stocks & Commodities V. 5:1 (28-47): Computer Investment Software
HOLLYWOOD, CA 90046
213-874-6069
Compu/Chart 1 is a user-modifiable program that generates graphic displays of trend patterns and relative
strength in stock, bonds, commodities, and anything with a flow of values. It features 3 moving averages
(2 user selected), comparison charting, hardcopy printouts, and easy menus and prompts. Program issues
buy/sell targets and alerts, last trade status reports, Ex-dividend reminders, and more. 72 point data files
are maintained. Cost: $99.95.
Compu/Chart 2
NEWTEK INDUSTRIES
P.O. BOX 46116
HOLLYWOOD, CA 90046
213-874-6669
Compu/Chart 2 is a user modifiable program that generates graphic displays of trend patterns and relative
strength in stocks, bonds, and commodities employing a 144-point base period for its charts. In addition
to near and medium term moving averages and 3 different comparison charts including "window,"
overlay and spread ratio comparison charts, it also generates Point and Figure charts, Price/Volume, four
oscillators(relative strength, rate of change, moving average, and momentum), several printout options
including screen dump with volume and oscillators, on-screen chart interpretation principles for each of
the major charts drawn, Buy/Sell targets and alerts, user-determined trading targets, Last trade and
Ex-dividend reminders, and more. Graphics hardware is not required. Cost: $199.95.
Compu/Chart 3
NEWTEK INDUSTRIES
P.O. BOX 46116
HOLLYWOOD, CA 90046
213-874-6669
Compu/Chart 3 builds on the features of Compu/Chart 2 but adds a communications module for
downloading price information into the Compu/Chart format automatically. Automatic update routine
(prior to charting) reports the day's changes for each file. For most issues, the retrievable data includes
high/low/close pricing as well as volume and open interest. Market sentiment is displayed on the MA
chart with arrows indicating days on which higher highs or lower lows were made on increased
volume--a relationship that is often a leading indicator of trend direction. Other additions include the
Exponential Average Divergence chart (EXAD) and change to range oscillator. Stocks, commodities,
over 1300 mutual funds and a wide range of indices are available from the data source on an historical or
daily update basis. Download parameters are selected by the user off-line making on-line processing
accurate and efficient Cost $229.95
Article Text
Copyright (c) Technical Analysis Inc.
6
Stocks & Commodities V. 5:1 (28-47): Computer Investment Software
CompuTrac
COMPUTRAC
1021 9 ST
NEW ORLEANS, LA 70115
800-535-7990
CompuTrac is a technical analysis software program designed to assist professional traders using their
IBM PC, XT, AT, or compatibles. CompuTrac features over 40 resident studies and tools, and it has the
ability to be easily programmed by the trader to run private studies. CompuTrac will also evaluate the
profitability of your trading system by applying rules you specify to enter or exit a position, over
historical data. The program will even automatically alter the variables in your trading system to hunt for
the most profitable combination. CompuTrac can be automated to perform routine tasks such as
collecting data from quote vendors, applying studies, printing charts, etc., totally unattended. In effect,
CompuTrac offers the trader complete hands off automation. CompuTrac was rated editor's choice by pc
magazine in their April 1986 review of technical analysis software. The program is supported by a
full-time helpline staff and is updated with new studies and features at regular intervals. Cost: $1,900.
CyberWare
CYBERENGINEERING CORP
P O BOX 4143
HUNTSVILLE, AL 35815-4143
205-880-2250
CyberWare computer aided technical analysis (CATA) software for MS-DOS computers using Box &
Jenkins, Kalman filters, Fourier cycles, entropy analysis, state space modeling, ARMA methods and
Lyapunov special exponents. Principles of artificial intelligence are used to extract the maximum
information for chaotic data. Cost: depends on product selected.
Article Text
Copyright (c) Technical Analysis Inc.
7
Stocks & Commodities V. 5:1 (28-47): Computer Investment Software
DATAFLEX
DATA ACCESS CORP
8525 S.W. 129 TERRACE MIAMI, FL 33156
305-238-0012
DATAFLEX is a transportable applications development and relational database management system for
single multi-user and local area network (LAN) microcomputers. Versions are available for most micro
operating systems. UNIX V and VAX versions are also available. Cost: $995 single user, $1,250
multi-user.
Dow Jones Market Analyzer
DOW JONES & CO.
P.O. BOX 300
PRINCETON, NJ 08543-0300
609-452-2000
A cost-effective technical analysis tool for investment advisors, private investors and professional money
managers. You can collect historical market quotes and at a touch of a key create standard technical
analysis charts. Charting capabilities include: relative strength and comparison charts, individual price
and volume bar charts, moving averages (simple, weighted, exponential) for time periods of your
selection, straight line constructions, volume indicators, and oscillator charts. The Market Analyzer
features automatic updating of daily data on stocks, bonds, mutual funds, and options. With a modem,
you have easy access to all Dow Jones News/Retrieval databases. Available for Apple II series,
Macintosh, IBM PC, PC/XT and AT, and AT&T PC 6300. For more information call 800-257-5114 (In
NJ, Alaska and Foreign, call 609-452-1511) Cost: $349.
Essex Bondtrader
ESSEX TRADING COMPANY
25W137 JANE AVE
NAPERVILLE, IL 60540
312-416-3530
A day-trading system for T-bond futures. All signals generated automatically; trades every day; no
regular overnight positions or reversals. Limited edition available for IBM PC, Apple II, TRS-80. Cost:
$595.
Article Text
Copyright (c) Technical Analysis Inc.
8