Khảo sát tác động của bệnh mãn tính đến chất lượng sống và tính trạng neo đơn Survey on the Impact of Chronic Diseases on Quality of Life And the Loneliness Status Among EmptyNest Aged People
Bạn đang xem bản rút gọn của tài liệu. Xem và tải ngay bản đầy đủ của tài liệu tại đây (326.75 KB, 19 trang )
Survey on the Impact of Chronic
Diseases on Quality of Life And the
Loneliness Status Among Empty-Nest
Aged People
ZHANG JIANPING
Dengyang
Zhoujia
Liyao Zhaojinyie
1 Faculty of Public Health, Kunming Medicine University, China
2 Institute for Adult Education, Kunming Medicine University, China
3 The Second Affiliated Hospital, Kunming Medicine University, China
Background
• Along with rapid economic development, the aging
process in China is gradually accelerating. As a more
vulnerable group, empty-nest elderly are facing more
urgent health problems. This study explores the chronic
illness situation and health-related quality of life
(HRQOL) of empty-nest elderly in Yunnan province of
China
• And aims to arouse more social concern for their
HRQOL. to examine the prevalence of chronic disease
and quality of life, its related factors among people aged
60 years and over in Yunnan province
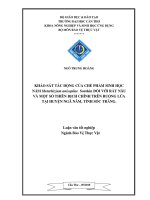
Methods
• Cross-sectional study
• A randomly selected sample of 402 people aged 60
years and over of empty-nest old men living in urban
area of Kunming, Dali and Pu-er, Yunnan province were
interviewed of the questionnaire survey.
• The SF-36 scale score and the structured- questionnaire
with UCLA loneliness scale was used as evaluation
tools. Multi-logistic regression was undertaken for
exploring associated factors of empty-nest old men.
•
•
•
•
Study consents
Demography : gender : age : minority : education level ect.
Chronic disease status;
Using the UCLA measured :
Using the SF-36 scale to menstruate the quality of life
Search target
Fit into standard
•
•
•
•
The people aged 60 years and
over
The permanent reside old people
of 1 year or over in community
limiting survey deadline
They freely participant under
Informed consent
Good cognitive ability
Exclusion standard
• Disease severity people
• Bad cognitive ability
• Refused to compliance
Sampling and sample estimated
• Using clustering sampling : we select 8 communities
as study sitting.
•
Chronic Diseases morbidity rate is 53.4% of old people in
urban of China.
total rate =53.4%;
• I error a=0.05 : S=5% :
• n=
2
=
•
The study
Z (1 )
382
2
Result (1)
• Total sample is 402
• Male is 176 : Female is 226
• Age group is 60-80 have 335 cases : Han 329 : minority
is 73 :
• Married is 281 : spouse is 110 :
• Education level is focus on primary school or junior
middle school respective is129 and108 ::
• 188 old people is major worker job before retire.
Statistical analysis
Gender is statistical significance among age 、
married 、 education level and occupation
before retire
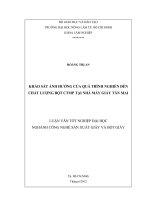
The Chronic Diseases status
1. Hypertension
2. Blood vessel of
brain diseases
3. Coronary disease
4. Diabetes mellitus
5. COPD
6. other
Result(2) Impact factor analysis of chronic disease suffer
from an illness status
Risk factor
Protect factor
Whether or not
ill
Self-assessment
status and age
health occupation before retire
、 support money and self-care
ability
Hypertension
Self-assessment health
status and age
self-care ability
Blood vessel of
brain diseases
Self-assessment health
status and age
self-care ability
Coronary
disease
Self-assessment health
status ,age and marital
occupation before retire
、 support money and if attend
endowment insurance
Diabetes
mellitus
Self-assessment health
status and age
COPD
Whether or not offspring
money and self-care
ability
Self-assessment health status
and age
Result(2)To Compare the loneliness scale in the difference
demographic
gender
age
Minority
Marital
characteristic
N
Mean
S.D
F
p
male
176
36.48
12.25
3.922
0.048*
female
226
34.21
10.69
60-69
192
34.68
11.14
2.830
0.038*
70-79
143
34.66
11.79
80-89
59
36.81
11.30
over
67
37.85
11.35
han
329
35.67
11.21
3.038
0.082
minority
73
33.10
12.27
Married
281
34.84
10.87
0.446
0.720
unmarried
6
38.83
8.86
divorce
5
36.60
12.48
spouse
110
35.87
12.91
Result(2)
Education status
occupation before
retire
illiteracy
70
36.00
11.93
Primary
129
34.18
10.89
Junior middle
school
108
34.07
11.26
High school
44
36.00
12.04
Junior college
28
37.89
10.43
University or over
23
39.00
13.23
worker
188
34.20
10.62
peasant
55
36.16
12.94
cadre
63
33.38
11.66
professional
50
39.20
12.49
other
46
36.52
10.72
Statistical analysis
the loneliness status relate to factor is
age 、 gender and occupation before retire
1.350
0.242
2.458
0.045*
Result(2)To Compare the loneliness scale in the
difference economic security
N
Mean
S.D
t
P
yes
265
35.03
11.26
0.166
0.684
no
137
35.53
11.82
yes
121
36.76
10.44
3.232
0.073
no
281
34.53
11.80
yes
138
34.14
9.73
1.821
0.178
no
264
35.76
12.22
yes
241
33.24
11.23
no
161
38.14
11.15
characteristic
Whether or not
economic security
Whether or not
deposit money
offspring money
Whether or not
Join endowment
insurance
18.450 0.000
Result(2)To Compare the loneliness scale in the
difference health status
characteristic
Health
status
Selfcare
ability
Illness
status
N
Mean
S.D
F/t
P
good
88
32.60
10.16
3.938
0.020
generalizati
on
200
35.25
10.88
mistake
114
37.12
12.95
All selfcare
57
34.28
10.82
16.460
0.000
Part-care
345
40.79
11.29
yes
367
42.57
11.22
16.530
0.000
no
35
34.49
11.30
Result(2) Impact factor analysis of loneliness status
variable
β
S.E
constant
18.699
3.506
Whether or not
Join endowment
insurance
-5.579
1.118
Self-care ability
-7.052
Health status
Gender
Sβ
T-value
P
5.334
0.000
-0.239
-4.992
0.000
2.014
-0.172
-3.501
0.001
2.243
0.804
0.138
2.789
0.006
2.285
1.103
0.099
2.071
0.039
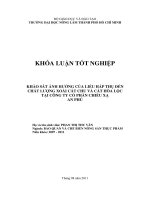
Result(3) to compare If have chronic disease QOL scale
Function
Chronic disease
GH
44.95±20.20
PF
un- Chronic
disease
T-value
P-value
62.67±19.25
-8.472
﹤0.000
76.17±20.40
84.96±19.60
-4.151
﹤0.000
RF
61.60±46.72
79.38±36.99
-3.870
﹤0.000
BF
69.60±20.90
78.71±14.06
-4.593
﹤0.000
VT
68.87±18.63
76.57±15.47
-4.153
﹤0.000
SF
84.39±23.76
93.70±20.68
-3.891
﹤0.000
RE
67.55±44.61
83.70±32.11
-3.763
﹤0.000
MH
65.52±14.71
65.28±11.69
0.166
0.868
Result(3) to compare QOL among difference
chronic disease
Section
GH
PF
RP
BP
…
Hypertension
46.48±20.67
76.91±19.81
61.91±45.57
70.44±20.39
…
Blood vessel
of brain
diseases
32.09±14.20
68.52±27.01
43.75±48.86
63.39±25.02
…
Coronary
disease
36.39±16.51
65.46±26.10
45.45±48.13
63.26±26.03
…
Diabetes
40.94±21.20
76.80±20.59
55.47±48.48
70.59±23.60
…
COPD
33.67±16.53
58.33±24.90
26.67±41.69
57.20±25.42
…
other
44.46±19.02
76.29±17.19
60.88±46.36
62.46±22.61
…
F-value 5.943
5.071
1.166
2.841
…
P-value
﹤0.000
0.008
0.015
…
﹤0.000
Result(3) Be related to the Loneliness total scale & QOL scale
SF-36 scale
QOL scale
Loneliness total scale &
QOL scale ﹤ R ﹤
p-value
GH
50.99±21.56
-0.215
﹤0.000
PF
79.17±20.53
-0.375
﹤0.000
RP
67.66±44.41
-0.177
﹤0.000
BP
72.70±19.32
-0.235
﹤0.000
VT
71.50±17.97
-0.392
﹤0.000
SF
87.56±23.16
-0.410
﹤0.000
RE
73.05±41.46
-0.191
﹤0.000
MH
65.44±13.74
-0.312
﹤0.000
Result(3) Difference groups QOL Test
Emptynesters
Un-emptynesters
T-value
P-value
GH
50.99±21.56
54.48±11.76
3.245
0.001
PF
79.17±20.54
83.15±17.23
3.889
﹤ 0.000
RP
67.66±44.41
72.09±35.78
1.999
0.046
BP
72.70±19.32
76.15±17.26
3.579
﹤ 0.000
VT
71.49±17.97
79.37±15.92
8.787
﹤ 0.000
SF
87.56±23.16
93.65±24.53
5.271
﹤ 0.000
RE
73.05±41.46
80.97±35.71
3.830
﹤ 0.000
MH
65.44±13.74
68.24±10.51
4.082
﹤ 0.000
Conclusion:
---Communities and families should take care of emptynesters both psychological and physical health
----The government should continue to improving the social
security system, to decrease the loneliness of urban
empty-nesters and improve their quality of life.