Introduction to business statistics (7th edition) by m weiers
Bạn đang xem bản rút gọn của tài liệu. Xem và tải ngay bản đầy đủ của tài liệu tại đây (40.7 MB, 569 trang )
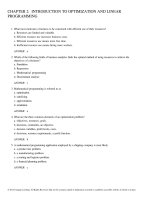
a = right-tail area. (e.g., for
a right-tail area of 0.025 and
d.f. = 15, the t value is 2.131.)
0
␣:
d.f. ϭ 1
2
3
4
5
6
7
8
9
10
11
12
13
14
15
16
17
18
19
20
21
22
23
24
25
26
27
28
29
30
31
32
33
34
35
36
37
38
39
40
41
42
43
44
45
The t-Distribution
t
0.10
0.05
0.025
0.01
3.078
1.886
1.638
1.533
1.476
1.440
1.415
1.397
1.383
1.372
1.363
1.356
1.350
1.345
1.341
1.337
1.333
1.330
1.328
1.325
1.323
1.321
1.319
1.318
1.316
1.315
1.314
1.313
1.311
1.310
1.309
1.309
1.308
1.307
1.306
1.306
1.305
1.304
1.304
1.303
1.303
1.302
1.302
1.301
1.301
6.314
2.920
2.353
2.132
2.015
1.943
1.895
1.860
1.833
1.812
1.796
1.782
1.771
1.761
1.753
1.746
1.740
1.734
1.729
1.725
1.721
1.717
1.714
1.711
1.708
1.706
1.703
1.701
1.699
1.697
1.696
1.694
1.692
1.691
1.690
1.688
1.687
1.686
1.685
1.684
1.683
1.682
1.681
1.680
1.679
12.706
4.303
3.182
2.776
2.571
2.447
2.365
2.306
2.262
2.228
2.201
2.179
2.160
2.145
2.131
2.120
2.110
2.101
2.093
2.086
2.080
2.074
2.069
2.064
2.060
2.056
2.052
2.048
2.045
2.042
2.040
2.037
2.035
2.032
2.030
2.028
2.026
2.024
2.023
2.021
2.020
2.018
2.017
2.015
2.014
31.821
6.965
4.541
3.747
3.365
3.143
2.998
2.896
2.821
2.764
2.718
2.681
2.650
2.624
2.602
2.583
2.567
2.552
2.539
2.528
2.518
2.508
2.500
2.492
2.485
2.479
2.473
2.467
2.462
2.457
2.453
2.449
2.445
2.441
2.438
2.435
2.431
2.429
2.426
2.423
2.421
2.418
2.416
2.414
2.412
0.005
63.657
9.925
5.841
4.604
4.032
3.707
3.499
3.355
3.250
3.169
3.106
3.055
3.012
2.977
2.947
2.921
2.898
2.878
2.861
2.845
2.831
2.819
2.807
2.797
2.787
2.779
2.771
2.763
2.756
2.750
2.744
2.738
2.733
2.728
2.724
2.719
2.715
2.712
2.708
2.704
2.701
2.698
2.695
2.692
2.690
␣:
0.10
0.05
0.025
0.01
0.005
d.f. ϭ 46
47
48
49
50
51
52
53
54
55
56
57
58
59
60
61
62
63
64
65
66
67
68
69
70
71
72
73
74
75
76
77
78
79
80
81
82
83
84
85
86
87
88
89
90
91
92
93
94
95
96
97
98
99
100
ϱ
1.300
1.300
1.299
1.299
1.299
1.298
1.298
1.298
1.297
1.297
1.297
1.297
1.296
1.296
1.296
1.296
1.295
1.295
1.295
1.295
1.295
1.294
1.294
1.294
1.294
1.294
1.293
1.293
1.293
1.293
1.293
1.293
1.292
1.292
1.292
1.292
1.292
1.292
1.292
1.292
1.291
1.291
1.291
1.291
1.291
1.291
1.291
1.291
1.291
1.291
1.290
1.290
1.290
1.290
1.290
1.282
1.679
1.678
1.677
1.677
1.676
1.675
1.675
1.674
1.674
1.673
1.673
1.672
1.672
1.671
1.671
1.670
1.670
1.669
1.669
1.669
1.668
1.668
1.668
1.667
1.667
1.667
1.666
1.666
1.666
1.665
1.665
1.665
1.665
1.664
1.664
1.664
1.664
1.663
1.663
1.663
1.663
1.663
1.662
1.662
1.662
1.662
1.662
1.661
1.661
1.661
1.661
1.661
1.661
1.660
1.660
1.645
2.013
2.012
2.011
2.010
2.009
2.008
2.007
2.006
2.005
2.004
2.003
2.002
2.002
2.001
2.000
2.000
1.999
1.998
1.998
1.997
1.997
1.996
1.995
1.995
1.994
1.994
1.993
1.993
1.993
1.992
1.992
1.991
1.991
1.990
1.990
1.990
1.989
1.989
1.989
1.988
1.988
1.988
1.987
1.987
1.987
1.986
1.986
1.986
1.986
1.985
1.985
1.985
1.984
1.984
1.984
1.960
2.410
2.408
2.407
2.405
2.403
2.402
2.400
2.399
2.397
2.396
2.395
2.394
2.392
2.391
2.390
2.389
2.388
2.387
2.386
2.385
2.384
2.383
2.382
2.382
2.381
2.380
2.379
2.379
2.378
2.377
2.376
2.376
2.375
2.375
2.374
2.373
2.373
2.372
2.372
2.371
2.371
2.370
2.369
2.369
2.369
2.368
2.368
2.367
2.367
2.366
2.366
2.365
2.365
2.365
2.364
2.326
2.687
2.685
2.682
2.680
2.678
2.676
2.674
2.672
2.670
2.668
2.667
2.665
2.663
2.662
2.660
2.659
2.658
2.656
2.655
2.654
2.652
2.651
2.650
2.649
2.648
2.647
2.646
2.645
2.644
2.643
2.642
2.641
2.640
2.640
2.639
2.638
2.637
2.636
2.636
2.635
2.634
2.634
2.633
2.632
2.632
2.631
2.630
2.630
2.629
2.629
2.628
2.627
2.627
2.626
2.626
2.576
Source: t-values generated by Minitab, then rounded to three decimal places.
Computer
Printouts and Instructions
Solutions
for Excel and Minitab
Visual Description
2.1 The Histogram
2.2 The Stem-And-Leaf Display*
2.3 The Dotplot
2.4 The Bar Chart
2.5 The Line Chart
2.6 The Pie Chart
2.7 The Scatter Diagram
2.8 The Cross-Tabulation
2.9 Cross-Tabulation with
Cell Summary Information
Statistical Description
3.1 Descriptive Statistics: Central
Tendency
3.2 Descriptive Statistics: Dispersion
3.3 The Box Plot*
3.4 Standardizing the Data
3.5 Coefficient of Correlation
Sampling
4.1 Simple Random Sampling
Discrete Probability Distributions
6.1 Binomial Probabilities
6.2 Hypergeometric Probabilities
6.3 Poisson Probabilities
6.4 Simulating Observations
From a Discrete Probability
Distribution
Continuous Probability Distributions
7.1 Normal Probabilities
7.2 Inverse Normal Probabilities
7.3 Exponential Probabilities
7.4 Inverse Exponential Probabilities
7.5 Simulating Observations From a
Continuous Probability Distribution
Sampling Distributions
8.1 Sampling Distributions and Computer
Simulation
Confidence Intervals
9.1 Confidence Interval For Population
Mean, Known*
9.2 Confidence Interval For Population
Mean, Unknown*
9.3 Confidence Interval For Population
Proportion*
9.4 Sample Size Determination
Hypothesis Tests: One Sample
10.1 Hypothesis Test For Population
Mean, Known*
10.2 Hypothesis Test For Population
Mean, Unknown*
Page
21
26
27
29
30
32
40
45
46
65
75
77
81
88
122
180
185
191
195
219
220
230
232
234
260
279
286
290
297
Computer
Printouts and Instructions
Solutions
for Excel and Minitab
Page
10.3 Hypothesis Test For Population
Proportion*
342
10.4 The Power Curve For A Hypothesis Test 352
Hypothesis Tests: Comparing Two Samples
11.1 Pooled-Variances t-Test for (1 Ϫ 2),
Population Variances Unknown but
Assumed Equal
11.2 Unequal-Variances t-Test for (1 Ϫ 2),
Population Variances Unknown and
Not Equal
11.3 The z-Test for (1 Ϫ 2)
11.4 Comparing the Means of Dependent
Samples
11.5 The z-Test for Comparing Two
Sample Proportions*
11.6 Testing for the Equality of
Population Variances
Analysis of Variance
12.1 One-Way Analysis of Variance
12.2 Randomized Block Analysis of Variance
12.3 Two-Way Analysis of Variance
Chi-Square Applications
13.1 Chi-Square Test for Goodness of Fit
13.2 Chi-Square Goodness-of-Fit Test
for Normality*
13.3 Chi-Square Test for Independence of
Variables*
13.4 Chi-Square Test Comparing Proportions
From Independent Samples*
13.5 Confidence Interval for a Population
Variance
13.6 Hypothesis Test for a Population
Variance
Nonparametric Methods
14.1 Wilcoxon Signed Rank Test for
One Sample*
14.2 Wilcoxon Signed Rank Test for
Comparing Paired Samples*
14.3 Wilcoxon Rank Sum Test for Two
Independent Samples*
14.4 Kruskal-Wallis Test for Comparing
More Than Two Independent Samples*
14.5 Friedman Test for the Randomized
Block Design*
14.6 Sign Test for Comparing Paired
Samples*
14.7 Runs Test for Randomness
14.8 Kolmogorov-Smirnov Test for Normality
14.9 Spearman Coefficient of Rank
Correlation*
371
377
383
388
393
399
424
438
453
475
477
483
488
494
495
512
515
520
524
529
534
538
541
543
326
335
Simple Linear Regression
15.1 Simple Linear Regression
558
Computer
Printouts and Instructions
Solutions
for Excel and Minitab
15.2 Interval Estimation in Simple Linear
Regression*
15.3 Coefficient of Correlation
15.4 Residual Analysis
Multiple Regression
16.1 Multiple Regression
16.2 Interval Estimation in Multiple
Regression*
16.3 Residual Analysis in Multiple
Regression
Model Building
17.1 Fitting a Polynomial Regression
Equation, One Predictor Variable
17.2 Fitting a Polynomial Regression
Equation, Two Predictor Variables
17.3 Multiple Regression With Qualitative
Predictor Variables
17.4 Transformation of the Multiplicative
Model
Page
565
570
580
606
613
627
649
656
661
665
Computer
Printouts and Instructions
Solutions
for Excel and Minitab
17.5 The Correlation Matrix
17.6 Stepwise Regression*
Page
668
671
Models for Time Series and Forecasting
18.1 Fitting a Linear or Quadratic Trend
Equation
18.2 Centered Moving Average For
Smoothing a Time Series
18.3 Excel Centered Moving Average Based
On Even Number of Periods
18.4 Exponentially Smoothing a Time Series
18.5 Determining Seasonal Indexes*
18.6 Forecasting With Exponential Smoothing
18.7 Durbin-Watson Test for Autocorrelation*
18.8 Autoregressive Forecasting
696
699
706
710
720
723
Statistical Process Control
20.1 Mean Chart*
20.2 Range Chart*
20.3 p-Chart*
20.4 c-Chart
780
781
789
792
691
694
* Data Analysis Plus™ 7.0 add-in
Seeing Statistics Applets
Applet
1
2
3
4
5
6
7
8
9
10
11
12
13
14
15
16
17
18
19
20
21
Key Item
Title
Influence of a Single Observation on the Median
Scatter Diagrams and Correlation
Sampling
Size and Shape of Normal Distribution
Normal Distribution Areas
Normal Approximation to Binomial Distribution
Distribution of Means—Fair Dice
Distribution of Means—Loaded Dice
Confidence Interval Size
Comparing the Normal and Student t Distributions
Student t Distribution Areas
z-Interval and Hypothesis Testing
Statistical Power of a Test
Distribution of Difference Between Sample Means
F Distribution
Interaction Graph in Two-Way ANOVA
Chi-Square Distribution
Regression: Point Estimate for y
Point-Insertion Scatter Diagram and Correlation
Regression Error Components
Mean Control Chart
Text Section
3.2
3.6
4.6
7.2
7.3
7.4
8.3
8.3
9.4
9.5
9.5
10.4
10.7
11.4
12.3
12.5
13.2
15.2
15.4
15.4
20.7
Applet Page
99
100
132
241
242
243
268
269
309
310
310
362
363
410
464
465
504
597
598
599
805
Location
Computer setup and notes
Follows preface
t-table
Precedes z-table
z-table
Inside rear cover
Other printed tables
Appendix A
Selected odd answers
Appendix B
Seeing Statistics applets, Thorndike video units, case and exercise data sets,
Excel worksheet templates, and Data Analysis PlusTM 7.0 Excel add-in software
with accompanying workbooks, including Test Statistics and Estimators,
Online Chapter 21, appendices, and additional support
/>
INTRODUCTION TO
ST
A
S
T
S
I
E
STIC
N
I
S
S
BU
7E
Ronald M. Weiers
Eberly College of Business and Information Technology
Indiana University of Pennsylvania
and
H. John Heinz III College
Carnegie Mellon University
WITH BUSINESS CASES BY
J. Brian Gray
University of Alabama
Lawrence H. Peters
Texas Christian University
Australia • Brazil • Japan • Korea • Mexico • Singapore • Spain • United Kingdom • United States
Introduction to Business Statistics, Seventh
Edition
Ronald M. Weiers
Vice President of Editorial, Business:
Jack W. Calhoun
Publisher: Joe Sabatino
Sr. Acquisitions Editor: Charles McCormick, Jr.
Developmental Editor: Elizabeth Lowry and
Suzanna Bainbridge
Editorial Assistant: Nora Heink
Sr. Marketing Communications Manager:
Jim Overly
Content Project Manager: Kelly Hillerich
© 2011, © 2008 South-Western, Cengage Learning
ALL RIGHTS RESERVED. No part of this work covered by the copyright
herein may be reproduced, transmitted, stored, or used in any form or by
any means graphic, electronic, or mechanical, including but not limited
to photocopying, recording, scanning, digitizing, taping, web distribution,
information networks, or information storage and retrieval systems, except
as permitted under Section 107 or 108 of the 1976 United States Copyright
Act, without the prior written permission of the publisher.
For product information and technology assistance, contact us at
Cengage Learning Customer & Sales Support, 1-800-354-9706
For permission to use material from this text or product,
submit all requests online at www.cengage.com/permissions
Further permissions questions can be emailed to
Media Editor: Chris Valentine
Frontlist Buyer, Manufacturing: Miranda Klapper
Compositor: MPS Limited, A Macmillan Company
Sr. Art Director: Stacy Shirley
Internal/Cover Designer: Craig Ramsdell
Cover Image: © Getty Images
Photo Acquisition Manager: Don Schlotman
ExamView® is a registered trademark of eInstruction Corp. Windows is
a registered trademark of the Microsoft Corporation used herein under
license. Macintosh and Power Macintosh are registered trademarks of
Apple Computer, Inc. used herein under license.
© 2008 Cengage Learning. All Rights Reserved.
Cengage Learning WebTutor™ is a trademark of Cengage Learning.
Library of Congress Control Number: 2009943073
ISBN-13: 978-0-538-45217-5
ISBN-10: 0-538-45217-X
South-Western Cengage Learning
5191 Natorp Boulevard
Mason, OH 45040
USA
Cengage Learning products are represented in Canada by
Nelson Education, Ltd.
For your course and learning solutions, visit www.cengage.com
Purchase any of our products at your local college store or at our preferred
online store www.CengageBrain.com
Printed in the United States of America
1 2 3 4 5 6 7 13 12 11 10
To Connor, Madeleine, Hugh, Christina, Aidan,
Mitchell, Owen, Emmett, Mr. Barney Jim,
and
With loving memories of our wonderful son, Bob,
who is swimming with the dolphins off Ocracoke Island
This page intentionally left blank
CONTENT
F
E
I
S
BR
Part 1: Business Statistics: Introduction and Background
1. A Preview of Business Statistics 1
2. Visual Description of Data 15
3. Statistical Description of Data 57
4. Data Collection and Sampling Methods 101
Part 2: Probability
5. Probability: Review of Basic Concepts 133
6. Discrete Probability Distributions 167
7. Continuous Probability Distributions 205
Part 3: Sampling Distributions and Estimation
8. Sampling Distributions 244
9. Estimation from Sample Data 270
Part 4: Hypothesis Testing
10. Hypothesis Tests Involving a Sample Mean or Proportion 311
11. Hypothesis Tests Involving Two Sample Means or Proportions 364
12. Analysis of Variance Tests 411
13. Chi-Square Applications 467
14. Nonparametric Methods 505
Part 5: Regression, Model Building, and Time Series
15. Simple Linear Regression and Correlation 551
16. Multiple Regression and Correlation 600
17. Model Building 644
18. Models for Time Series and Forecasting 687
Part 6: Special Topics
19. Decision Theory 737
20. Total Quality Management 758
21. Ethics in Statistical Analysis and Reporting (Online Chapter)
Appendices
A. Statistical Tables A-1
B. Selected Answers B-1
Index/Glossary I-1
v
TENTS
N
O
C
PART 1: BUSINESS STATISTICS: INTRODUCTION AND BACKGROUND
Chapter 1: A Preview of Business Statistics
1
1.1 Introduction
2
1.2 Statistics: Yesterday and Today
3
1.3 Descriptive Versus Inferential Statistics
5
1.4 Types of Variables and Scales of Measurement
8
1.5 Statistics in Business Decisions
11
1.6 Business Statistics: Tools Versus Tricks
11
1.7 Summary
12
Chapter 2: Visual Description of Data
2.1 Introduction
15
16
2.2 The Frequency Distribution and the Histogram
16
2.3 The Stem-and-Leaf Display and the Dotplot
24
2.4 Other Methods for Visual Representation of the Data
28
2.5 The Scatter Diagram
37
2.6 Tabulation, Contingency Tables, and the Excel PivotTable
42
2.7 Summary
48
Integrated Case: Thorndike Sports Equipment (Meet the Thorndikes:
See Video Unit One.)
53
Integrated Case: Springdale Shopping Survey
54
Chapter 3: Statistical Description of Data
3.1 Introduction
57
58
3.2 Statistical Description: Measures of Central Tendency
59
3.3 Statistical Description: Measures of Dispersion
67
3.4 Additional Dispersion Topics
77
3.5 Descriptive Statistics from Grouped Data
83
3.6 Statistical Measures of Association
86
3.7 Summary
90
Integrated Case: Thorndike Sports Equipment
96
Integrated Case: Springdale Shopping Survey
97
Business Case: Baldwin Computer Sales (A)
97
Seeing Statistics Applet 1: Influence of a Single Observation on the Median
99
Seeing Statistics Applet 2: Scatter Diagrams and Correlation
vi
100
Contents
vii
Chapter 4: Data Collection and Sampling Methods
4.1 Introduction
101
102
4.2 Research Basics
102
4.3 Survey Research
105
4.4 Experimentation and Observational Research
109
4.5 Secondary Data
112
4.6 The Basics of Sampling
117
4.7 Sampling Methods
119
4.8 Summary
127
Integrated Case: Thorndike Sports Equipment—Video Unit Two
131
Seeing Statistics Applet 3: Sampling
132
PART 2: PROBABILITY
Chapter 5: Probability: Review of Basic Concepts
133
5.1 Introduction
134
5.2 Probability: Terms and Approaches
135
5.3 Unions and Intersections of Events
140
5.4 Addition Rules for Probability
143
5.5 Multiplication Rules for Probability
146
5.6 Bayes’ Theorem and the Revision of Probabilities
150
5.7 Counting: Permutations and Combinations
156
5.8 Summary
160
Integrated Case: Thorndike Sports Equipment
165
Integrated Case: Springdale Shopping Survey
166
Business Case: Baldwin Computer Sales (B)
166
Chapter 6: Discrete Probability Distributions
6.1 Introduction
167
168
6.2 The Binomial Distribution
175
6.3 The Hypergeometric Distribution
183
6.4 The Poisson Distribution
187
6.5 Simulating Observations from a Discrete Probability Distribution
194
6.6 Summary
199
Integrated Case: Thorndike Sports Equipment
203
Chapter 7: Continuous Probability Distributions
7.1 Introduction
205
206
7.2 The Normal Distribution
208
7.3 The Standard Normal Distribution
212
7.4 The Normal Approximation to the Binomial Distribution
223
7.5 The Exponential Distribution
228
viii
Contents
7.6 Simulating Observations from a Continuous Probability Distribution
233
7.7 Summary
235
Integrated Case: Thorndike Sports Equipment
(Corresponds to Thorndike Video Unit Three)
240
Integrated Case: Thorndike Golf Products Division
240
Seeing Statistics Applet 4: Size and Shape of Normal Distribution
241
Seeing Statistics Applet 5: Normal Distribution Areas
242
Seeing Statistics Applet 6: Normal Approximation to Binomial Distribution
243
PART 3: SAMPLING DISTRIBUTIONS AND ESTIMATION
Chapter 8: Sampling Distributions
244
8.1 Introduction
245
8.2 A Preview of Sampling Distributions
245
8.3 The Sampling Distribution of the Mean
248
8.4 The Sampling Distribution of the Proportion
254
8.5 Sampling Distributions When the Population Is Finite
257
8.6 Computer Simulation of Sampling Distributions
259
8.7 Summary
262
Integrated Case: Thorndike Sports Equipment
266
Seeing Statistics Applet 7: Distribution of Means: Fair Dice
268
Seeing Statistics Applet 8: Distribution of Means: Loaded Dice
269
Chapter 9: Estimation from Sample Data
9.1 Introduction
270
271
9.2 Point Estimates
272
9.3 A Preview of Interval Estimates
273
9.4 Confidence Interval Estimates for the Mean: Known
276
9.5 Confidence Interval Estimates for the Mean: Unknown
281
9.6 Confidence Interval Estimates for the Population Proportion
288
9.7 Sample Size Determination
293
9.8 When the Population Is Finite
298
9.9 Summary
302
Integrated Case: Thorndike Sports Equipment (Thorndike Video Unit Four)
307
Integrated Case: Springdale Shopping Survey
308
Seeing Statistics Applet 9: Confidence Interval Size
309
Seeing Statistics Applet 10: Comparing the Normal and Student t Distributions
310
Seeing Statistics Applet 11: Student t Distribution Areas
310
PART 4: HYPOTHESIS TESTING
Chapter 10: Hypothesis Tests Involving a Sample Mean
or Proportion
311
10.1 Introduction
312
Contents
ix
10.2 Hypothesis Testing: Basic Procedures
317
10.3 Testing a Mean, Population Standard Deviation Known
320
10.4 Confidence Intervals and Hypothesis Testing
329
10.5 Testing a Mean, Population Standard Deviation Unknown
330
10.6 Testing a Proportion
338
10.7 The Power of a Hypothesis Test
346
10.8 Summary
354
Integrated Case: Thorndike Sports Equipment
359
Integrated Case: Springdale Shopping Survey
360
Business Case: Pronto Pizza (A)
361
Seeing Statistics Applet 12: z-Interval and Hypothesis Testing
362
Seeing Statistics Applet 13: Statistical Power of a Test
363
Chapter 11: Hypothesis Tests Involving Two Sample
Means or Proportions
11.1 Introduction
364
365
11.2 The Pooled-Variances t-Test for Comparing the
Means of Two Independent Samples
366
11.3 The Unequal-Variances t-Test for Comparing the
Means of Two Independent Samples
374
11.4 The z-Test for Comparing the Means of Two
Independent Samples
380
11.5 Comparing Two Means When the Samples Are Dependent
385
11.6 Comparing Two Sample Proportions
391
11.7 Comparing the Variances of Two Independent Samples
397
11.8 Summary
401
Integrated Case: Thorndike Sports Equipment
407
Integrated Case: Springdale Shopping Survey
407
Business Case: Circuit Systems, Inc. (A)
408
Seeing Statistics Applet 14: Distribution of Difference Between Sample Means
410
Chapter 12: Analysis of Variance Tests
12.1 Introduction
411
412
12.2 Analysis of Variance: Basic Concepts
412
12.3 One-Way Analysis of Variance
416
12.4 The Randomized Block Design
429
12.5 Two-Way Analysis of Variance
441
12.6 Summary
457
Integrated Case: Thorndike Sports Equipment (Video Unit Six)
462
Integrated Case: Springdale Shopping Survey
462
Business Case: Fastest Courier in the West
463
Seeing Statistics Applet 15: F Distribution and ANOVA
464
Seeing Statistics Applet 16: Interaction Graph in Two-Way ANOVA
465
x
Contents
Chapter 13: Chi-Square Applications
13.1 Introduction
467
468
13.2 Basic Concepts in Chi-Square Testing
468
13.3 Tests for Goodness of Fit and Normality
471
13.4 Testing the Independence of Two Variables
479
13.5 Comparing Proportions from k Independent Samples
486
13.6 Estimation and Tests Regarding the Population Variance
489
13.7 Summary
497
Integrated Case: Thorndike Sports Equipment
502
Integrated Case: Springdale Shopping Survey
503
Business Case: Baldwin Computer Sales (C)
503
Seeing Statistics Applet 17: Chi-Square Distribution
504
Chapter 14: Nonparametric Methods
505
14.1 Introduction
506
14.2 Wilcoxon Signed Rank Test for One Sample
508
14.3 Wilcoxon Signed Rank Test for Comparing Paired Samples
513
14.4 Wilcoxon Rank Sum Test for Comparing Two
Independent Samples
517
14.5 Kruskal-Wallis Test for Comparing More Than
Two Independent Samples
521
14.6 Friedman Test for the Randomized Block Design
525
14.7 Other Nonparametric Methods
530
14.8 Summary
545
Integrated Case: Thorndike Sports Equipment
549
Business Case: Circuit Systems, Inc. (B)
550
PART 5: REGRESSION, MODEL BUILDING, AND TIME SERIES
Chapter 15: Simple Linear Regression and Correlation
551
15.1 Introduction
552
15.2 The Simple Linear Regression Model
553
15.3 Interval Estimation Using the Sample Regression Line
561
15.4 Correlation Analysis
567
15.5 Estimation and Tests Regarding the Sample Regression Line
572
15.6 Additional Topics in Regression and Correlation Analysis
578
15.7 Summary
587
Integrated Case: Thorndike Sports Equipment
595
Integrated Case: Springdale Shopping Survey
596
Business Case: Pronto Pizza (B)
596
Seeing Statistics Applet 18: Regression: Point Estimate for y
597
Seeing Statistics Applet 19: Point Insertion Diagram and Correlation
598
Seeing Statistics Applet 20: Regression Error Components
599
Contents
xi
Chapter 16: Multiple Regression and Correlation
16.1 Introduction
600
601
16.2 The Multiple Regression Model
602
16.3 Interval Estimation in Multiple Regression
609
16.4 Multiple Correlation Analysis
615
16.5 Significance Tests in Multiple Regression and Correlation
617
16.6 Overview of the Computer Analysis and Interpretation
622
16.7 Additional Topics in Multiple Regression and Correlation
632
16.8 Summary
634
Integrated Case: Thorndike Sports Equipment
639
Integrated Case: Springdale Shopping Survey
640
Business Case: Easton Realty Company (A)
641
Business Case: Circuit Systems, Inc. (C)
643
Chapter 17: Model Building
644
17.1 Introduction
645
17.2 Polynomial Models with One Quantitative
Predictor Variable
645
17.3 Polynomial Models with Two Quantitative
Predictor Variables
653
17.4 Qualitative Variables
658
17.5 Data Transformations
663
17.6 Multicollinearity
667
17.7 Stepwise Regression
670
17.8 Selecting a Model
676
17.9 Summary
677
Integrated Case: Thorndike Sports Equipment
681
Integrated Case: Fast-Growing Companies
681
Business Case: Westmore MBA Program
682
Business Case: Easton Realty Company (B)
685
Chapter 18: Models for Time Series and Forecasting
687
18.1 Introduction
688
18.2 Time Series
688
18.3 Smoothing Techniques
693
18.4 Seasonal Indexes
702
18.5 Forecasting
708
18.6 Evaluating Alternative Models: MAD and MSE
713
18.7 Autocorrelation, The Durbin-Watson Test, and
Autoregressive Forecasting
715
18.8 Index Numbers
724
18.9 Summary
729
Integrated Case: Thorndike Sports Equipment (Video Unit Five)
735
xii
Contents
PART 6: SPECIAL TOPICS
Chapter 19: Decision Theory
737
19.1 Introduction
738
19.2 Structuring the Decision Situation
738
19.3 Non-Bayesian Decision Making
742
19.4 Bayesian Decision Making
745
19.5 The Opportunity Loss Approach
749
19.6 Incremental Analysis and Inventory Decisions
751
19.7 Summary
754
Integrated Case: Thorndike Sports Equipment (Video Unit Seven)
757
Online Appendix to Chapter 19: The Expected Value of Imperfect Information
Chapter 20: Total Quality Management
758
20.1 Introduction
759
20.2 A Historical Perspective and Defect Detection
762
20.3 The Emergence of Total Quality Management
763
20.4 Practicing Total Quality Management
765
20.5 Some Statistical Tools for Total Quality Management
770
20.6 Statistical Process Control: The Concepts
774
20.7 Control Charts for Variables
776
20.8 Control Charts for Attributes
786
20.9 Additional Statistical Process Control and
Quality Management Topics
795
20.10 Summary
799
Integrated Case: Thorndike Sports Equipment
803
Integrated Case: Willard Bolt Company
804
Seeing Statistics Applet 21: Mean Control Chart
805
Appendix A: Statistical Tables
Appendix B: Selected Answers
A-1
B-1
Index/Glossary
Online Chapter 21: Ethics in Statistical Analysis and Reporting
I-1
P R E FA C E
Philosophies and Goals of the Text:
A Message to the Student
A book is a very special link between author and reader. In a mystery novel, the
author presents the reader with a maze of uncertainty, perplexity, and general
quicksand. Intellectual smokescreens are set up all the way to the “whodunit”
ending. Unfortunately, many business statistics texts seem to be written the same
way—except for the “whodunit” section. This text is specifically designed to be
different. Its goals are: (1) to be a clear and friendly guide as you learn about
business statistics, (2) to avoid quicksand that could inhibit either your interest or
your learning, and (3) to earn and retain your trust in our ability to accomplish
goals 1 and 2.
Business statistics is not only relevant to your present academic program, it is
also relevant to your future personal and professional life. As a citizen, you will
be exposed to, and perhaps may even help generate, statistical descriptions and
analyses of data that are of vital importance to your local, state, national, and
world communities. As a business professional, you will constantly be dealing
with statistical measures of performance and success, as well as with employers
who will expect you to be able to utilize the latest statistical techniques and computer software tools—including spreadsheet programs like Excel and statistical
software packages like Minitab—in working with these measures.
The chapters that follow are designed to be both informal and informative,
as befits an introductory text in business statistics. You will not be expected to
have had mathematical training beyond simple algebra, and mathematical symbols and notations will be explained as they become relevant to our discussion.
Following an introductory explanation of the purpose and the steps involved in
each technique, you will be provided with several down-to-earth examples of
its use. Each section has a set of exercises based on the section contents. At the
end of each chapter you’ll find a summary of what you’ve read and a listing of
equations that have been introduced, as well as chapter exercises, an interesting
minicase or two, and in most of the chapters—a realistic business case to help
you practice your skills.
Features New to the Seventh Edition
Data Analysis PlusTM 7.0
The Seventh Edition makes extensive use of Data Analysis PlusTM 7.0, an
updated version of the outstanding add-in that enables Microsoft Excel to carry
out practically all of the statistical tests and procedures covered in the text. This
excellent software is easy to use, and is available on the premium website that
accompanies this text.
xiii
xiv
Preface
The Test Statistics and Estimators Workbooks
The Excel workbooks Test Statistics and Estimators accompany and are an important complement to Data Analysis PlusTM 7.0. These workbooks enable Excel
users to quickly perform statistical tests and interval-estimation procedures by
simply entering the relevant summary statistics. The workbooks are terrific for
solving exercises, checking solutions, and especially for playing “what-if” by trying different inputs to see how they would affect the results. These workbooks,
along with Beta-mean and three companion workbooks to determine the power
of a hypothesis test, accompany Data Analysis PlusTM 7.0 and are also available
on the premium website at www.cengage.com/bstats/weiers.
Updated Set of 82 Computer Solutions Featuring
Complete Printouts and Step-By-Step Instructions
for Obtaining Them
Featuring the very latest versions of both Excel and Minitab—Excel 2007 and
Minitab 16, respectively—these pieces are located in most of the major sections
of the book. Besides providing relevant computer printouts for most of the text
examples, they are accompanied by friendly step-by-step instructions written in
plain English.
Updated Exercises and Content
The Seventh Edition includes a total of nearly 1600 section and chapter exercises,
and more than 300 of them are new or updated. Altogether, there are about 1800
chapter, case, and applet exercises, with about 450 data sets for greater ease and
convenience in using the computer. The datasets are in Excel, Minitab, and other
popular formats, and are available on the text’s premium website. Besides numerous new or updated chapter examples, vignettes, and Statistics in Action items,
Chapter 20 (Total Quality Management) has been expanded to include coverage
of Process Capability indices and measurement. In response to user preferences
and for greater ease of use, the normal distribution table is now cumulative, and
it is conveniently located on the rear endsheet of the text.
Continuing Features of Introduction
to Business Statistics
Chapter-Opening Vignettes and Statistics In
Action Items
Each chapter begins with a vignette that’s both interesting and relevant to the
material ahead. Within each chapter, there are also Statistics In Action items that
provide further insights into the issues and applications of business statistics in
the real world. They include a wide range of topics, including using the consumer
price index to time-travel to the (were they really lower?) prices in days gone by,
and surprisingly-relevant discussion of an odd little car in which the rear passengers faced to the rear. Some of the vignette and Statistics in Action titles:
Get That Cat off the Poll! (p. 116)
Proportions Testing and the Restroom Police (p. 467)
Time-Series-Based Forecasting and the Zündapp (p. 687)
Probabilities, Stolen Lawn Mowers, and the Chance of Rain (p. 138)
Preface
The CPI Time Machine (p. 728)
A Sample of Sampling By Giving Away Samples (p. 126)
Gender Stereotypes and Asking for Directions (p. 364)
Extensive Use of Examples and Analogies
The chapters continue to be packed with examples to illustrate the techniques
being discussed. In addition to describing a technique and presenting a smallscale example of its application, we will typically present one or more Excel
and Minitab printouts showing how the analysis can be handled with popular
statistical software. This pedagogical strategy is used so the reader will better
appreciate what’s going on inside the computer when it’s applied to problems of
a larger scale.
The Use of Real Data
The value of statistical techniques becomes more apparent through the consistent
use of real data in the text. Data sets gathered from such publications as USA
Today, Fortune, Newsweek, and The Wall Street Journal are used in more than
400 exercises and examples to make statistics both relevant and interesting.
Computer Relevance
The text includes nearly 200 computer printouts generated by Excel and Minitab,
and the text’s premium website contains data sets for section and chapter exercises, integrated and business cases, and chapter examples. In addition to the new
Data Analysis PlusTM 7.0 software and the handy Test Statistics and Estimators
workbooks that accompany it, the Seventh Edition offers the separate collection
of 26 Excel worksheet templates generated by the author specifically for exercise
solutions and “what-if” analyses based on summary data.
Seeing Statistics Applets
The Seventh Edition continues with the 21 popular interactive java applets,
available at the text’s premium website. Many of these interesting and insightful
applets are customized by their author to specific content and examples in this
textbook, and they include a total of 85 applet exercises. The applets are from the
award-winning Seeing Statistics, authored by Gary McClelland of the University
of Colorado, and they bring life and action to many of the most important
statistical concepts in the text.
Integrated Cases
At the end of each chapter, you’ll find one or both of these case scenarios helpful
in understanding and applying concepts presented within the chapter:
(1) Thorndike Sports Equipment Company
The text continues to follow the saga of Grandfather (Luke) and Grandson (Ted)
Thorndike as they apply chapter concepts to the diverse opportunities, interesting problems, and assorted dilemmas faced by the Thorndike Sports Equipment
Company. At the end of each chapter, the reader has the opportunity to help
Luke and Ted apply statistics to their business. The text’s premium website offers
seven Thorndike video units designed to accompany and reinforce selected written cases. Viewers will find that they enhance the relevance of the cases as well
xv
xvi
Preface
as provide some entertaining background for the Thorndikes’ many statistical
adventures.
(2) Springdale Shopping Survey
The Springdale Shopping Survey cases provide the opportunity to apply chapter
concepts and the computer to real numbers representing the opinions and behaviors of real people in a real community. The only thing that isn’t real is the name
of the community. The entire database contains 30 variables for 150 respondents,
and is available from the premium website accompanying the text.
Business Cases
The Seventh Edition also provides a set of 12 real-world business cases in 10 different chapters of the text. These interesting and relatively extensive cases feature
disguised organizations, but include real data pertaining to real business problems and situations. In each case, the company or organization needs statistical
assistance in analyzing their database to help them make more money, make better decisions, or simply make it to the next fiscal year. The organizations range all
the way from an MBA program, to a real estate agency, to a pizza delivery service,
and these cases and their variants are featured primarily among the chapters in
the latter half of the text. The cases have been adapted from the excellent presentations in Business Cases in Statistical Decision Making, by Lawrence H. Peters,
of Texas Christian University and J. Brian Gray, of the University of Alabama.
Just as answers to problems in the real world are not always simple, obvious,
and straightforward, neither are some of the solutions associated with the real
problems faced by these real (albeit disguised) companies and organizations.
However, in keeping with the “Introduction to …” title of this text, we do provide
a few guidelines in the form of specific questions or issues the student may wish
to address while using business statistics in helping to formulate observations
and recommendations that could be informative or helpful to his or her “client.”
Organization of the Text
The text can be used in either a one-term or a two-term course. For one-term
applications, Chapters 1 through 11 are suggested. For two-term use, it is recommended that the first term include Chapters 1 through 11, and that the second
term include at least Chapters 12 through 18. In either one- or two-term use, the
number and variety of chapters allow for instructor flexibility in designing either
a course or a sequence of courses that will be of maximum benefit to the student.
This flexibility includes the possibility of including one or more of the two remaining chapters, which are in the Special Topics section of the text.
Chapter 1 provides an introductory discussion of business statistics and its
relevance to the real world. Chapters 2 and 3 cover visual summarization methods and descriptive statistics used in presenting statistical information. Chapter 4
discusses popular approaches by which statistical data are collected or generated,
including relevant sampling methods. In Chapters 5 through 7, we discuss the
basic notions of probability and go on to introduce the discrete and continuous probability distributions upon which many statistical analyses depend. In
Chapters 8 and 9, we discuss sampling distributions and the vital topic of making
estimates based on sample findings.
Chapters 10 through 14 focus on the use of sample data to reach conclusions
regarding the phenomena that the data represent. In these chapters, the reader
Preface
will learn how to use statistics in deciding whether to reject statements that have
been made concerning these phenomena. Chapters 15 and 16 introduce methods
for obtaining and using estimation equations in describing how one variable
tends to change in response to changes in one or more others.
Chapter 17 extends the discussion in the two previous chapters to examine
the important issue of model building. Chapter 18 discusses time series, forecasting, and index number concepts used in analyzing data that occur over a
period of time. Chapter 19 discusses the role of statistics in decision theory, while
Chapter 20 explores total quality management and its utilization of statistics.
At the end of the text, there is a combined index and glossary of key terms,
a set of statistical tables, and answers to selected odd exercises. For maximum
convenience, immediately preceding the back cover of the text are pages containing the two statistical tables to which the reader will most often be referring: the
t-distribution and the standard normal, or z-distribution.
Ancillary Items
To further enhance the usefulness of the text, a complete package of complementary ancillary items has been assembled, and they are available at the premium
website accompanying the text:
Student Premium Website
This website available at www.cengage.com/bstats/weiers, contains Data Analysis PlusTM 7.0 Excel add-in software and accompanying workbooks, including
Test Statistics and Estimators; Seeing Statistics applets; datasets for exercises,
cases, and text examples; author-developed Excel worksheet templates for exercise solutions and “what-if” analyses; and the Thorndike Sports Equipment video
cases. Also included, in pdf format, are Chapter 21, Ethics in Statistical Analysis
and Reporting, and the Chapter 19 appendix on the expected value of imperfect
information.
Instructor’s Suite Resource
The Instructor’s Resource CD (IRCD) is available to qualified adopters and contains author-generated complete and detailed solutions to all section, chapter, and
applet exercises, integrated cases and business cases; a test bank in Microsoft Word
format that includes test questions by section; ExamView testing software, which
allows a professor to create exams in minutes; PowerPoint presentations featuring
concepts and examples for each chapter; and a set of display Seeing Statistics
applets based on those in the text and formatted for in-class projection.
Also Available from the Publisher
Available separately from the publisher are other items for enhancing students’
learning experience with the textbook. Among them are the following:
Student Solutions Manual (Weiers)
This manual is author-generated and contains complete, detailed solutions to all
odd-numbered exercises in the text. It can be purchased electronically via Cengage
Brain at www.cengagebrain.com.
xvii
xviii
Preface
Instructor’s Solutions Manual (Weiers)
The Instructor’s Solutions Manual contains author-generated complete and detailed solutions to all section, chapter, and applet exercises, integrated cases and
business cases. It is available to qualified adopters and is in Microsoft Word format
on the password-protected instructor’s website at www.cengage.com/bstats/weiers.
Test Bank (Doug Barrett)
Containing over 2600 test questions, including true-false, multiple-choice, and
problems similar to those at the ends of the sections and chapters of the text, the
computerized Test Bank makes test creation a cinch. The ExamView program is
available from the text’s premium website and on the IRCD.
PPTs: (Priscilla Chaffe-Stengel)
The PowerPoint slides contain the chapter learning outcomes, key terms, theoretical overviews, and practical examples to facilitate classroom instruction and
student learning. The PowerPoint files are available from the text’s premium
website and on the IRCD.
Minitab, Student Version for Windows (Minitab, Inc.)
The student version of this popular statistical software package. Available at a
discount when bundled with the text.
Acknowledgements
Advice and guidance from my colleagues have been invaluable to the generation
of the Seventh Edition, and I would like to thank the following individuals for
their helpful comments and suggestions:
J. Douglas Barrett
University of North Alabama
Linda Leighton
Fordham University
David Bush
Villanova University
Edward Mansfield
University of Alabama
Priscilla Chaffe-Stengel
California State University-Fresno
Elizabeth Mayer
St. Bonaventure University
Fred Dehner
Rivier College
Rich McGowan
Boston College
Jim Ford
University of Delaware
Patricia Mullins
University of Wisconsin
Jeff Grover
Dynamics Research Corporation
Alan Olinsky
Bryant University
Janice Harder
Motlow State Community College
Deborah J. Rumsey
The Ohio State University
Farid Islam
Utah Valley State College
Farhad Saboori
Albright College
Yunus Kathawala
Eastern Illinois University
Dan Shimshak
University of Massachusetts
Preface
xix
Kathy Smith
Carnegie Mellon University
Mark A. Thompson
University of Arkansas at Little Rock
Debra K. Stiver
University of Nevada, Reno
Joseph Van Metre
University of Alabama
I would also like to thank colleagues who were kind enough to serve as reviewers for previous editions of the text: Randy Anderson, California State
University—Fresno; Leland Ash, Yakima Valley Community College; James
O. Flynn, Cleveland State University; Marcelline Fusilier, Northwestern State
University of Louisiana; Thomas Johnson, North Carolina State University; Mark
P. Karscig, Central Missouri State University; David Krueger, Saint Cloud State
University; Richard T. Milam, Jr., Appalachian State University; Erl Sorensen,
Northeastern University; Peter von Allmen, Moravian College: R. C. Baker,
University of Texas-Arlington; Robert Boothe, Memphis State University;
Raymond D. Brown, Drexel University; Shaw K. Chen, University of Rhode
Island; Gary Cummings, Walsh College; Phyllis Curtiss, Bowling Green State
University; Fred Derrick, Loyola College; John Dominguez, University of
Wisconsin—Whitewater; Robert Elrod, Georgia State University; Mohammed A.
El-Saidi, Ferris State University; Stelios Fotopoulos, Washington State University;
Oliver Galbraith, San Diego State University; Patricia Gaynor, University
of Scranton; Edward George, University of Texas—El Paso; Jerry Goldman,
DePaul University; Otis Gooden, Cleveland State University; Deborah Gougeon,
Appalachian State University; Jeffry Green, Ball State University; Irene
Hammerbacher, Iona College; Robert Hannum, University of Denver; Burt Holland,
Temple University; Larry Johnson, Austin Community College; Shimshon
Kinory, Jersey City State College; Ron Koot, Pennsylvania State University;
Douglas Lind, University of Toledo; Subhash Lonial, University of Louisville;
Tom Mathew, Troy State University—Montgomery; John McGovern, Georgian
Court College; Frank McGrath, Iona College; Jeff Mock, Diablo Valley
College; Kris Moore, Baylor University; Ryan Murphy, University of Arizona;
Buddy Myers, Kent State University; Leon Neidleman, San Jose State University;
Julia Norton, California State University—Hayward; C. J. Park, San Diego State
University; Leonard Presby, William Patterson State College; Harry Reinken,
Phoenix College; Vartan Safarian, Winona State University; Sue Schou, Idaho State
University; John Sennetti, Texas Tech University; William A. Shrode, Florida
State University; Lynnette K. Solomon, Stephen F. Austin State University; Sandra
Strasser, Valparaiso State University; Joseph Sukta, Moraine Valley Community
College; J. B. Spaulding, University of Northern Texas; Carol Stamm, Western
Michigan University; Priscilla Chaffe-Stengel, California State University—
Fresno; Stan Stephenson, Southwest Texas State University; Patti Taylor, Angelo
State University; Patrick Thompson, University of Florida—Gainesville;
Russell G. Thompson, University of Houston; Susan Colvin-White, Northwestern
State University; Nancy Williams, Loyola College; Dick Withycombe, University
of Montana; Cliff Young, University of Colorado at Denver; and Mustafa Yilmaz,
Northeastern University.
I would like to thank Vince Taiani for assistance with and permission to
use what is known here as the Springdale Shopping Survey computer database.
Thanks to Minitab, Inc. for the support and technical assistance they have provided. Thanks to Gary McCelland for his excellent collection of applets for this
text, and to Lawrence H. Peters and J. Brian Gray for their outstanding cases
xx
Preface
and the hands-on experience they have provided to the student. Special thanks
to my friend and fellow author Gerry Keller and the producers of Data Analysis
PlusTM 7.0 for their excellent software that has enhanced this edition.
The editorial staff of Cengage Learning is deserving of my gratitude for their
encouragement, guidance, and professionalism throughout what has been an
arduous, but rewarding task. Among those without whom this project would
not have come to fruition are Charles McCormick, Acquisitions Editor; Suzanna
Bainbridge and Elizabeth Lowry, Developmental Editors; Kelly Hillerich, Content
Project Manager; Bill Hendee, Vice President of Marketing; Stacy Shirley, Art
Director; Eleanora Heink, Editorial Assistant; Suellen Ruttkay, Marketing Coordinator, and Libby Shipp, Marketing Communications Manager. In addition,
the world-class editorial skills of Susan Reiland and the detail-orientation of
Dr. Jeff Grover, Dr. Debra Stiver, and Dr. Doug Barrett are greatly appreciated.
Last, but certainly not least, I remain extremely thankful to my family for
their patience and support through seven editions of this work.
Ronald M. Weiers, Ph.D.
Eberly College of Business and Information Technology
Indiana University of Pennsylvania
and
Adjunct, H. John Heinz III College
Carnegie Mellon University