ch05 Cost-Volume-Profit Ke toan quan tri
Bạn đang xem bản rút gọn của tài liệu. Xem và tải ngay bản đầy đủ của tài liệu tại đây (1.21 MB, 75 trang )
Page
5-1
Cost-Volume-Profit
Cost-Volume-Profit
Managerial Accounting
Fifth Edition
Weygandt Kimmel Kieso
Page
5-2
study objectives
Page
5-3
1.
Distinguish between variable and fixed costs.
2.
Explain the significance of the relevant range.
3.
Explain the concept of mixed costs.
4.
List the five components of cost-volume-profit analysis.
5.
Indicate what contribution margin is and how it can be
expressed.
6.
Identify the three ways to determine the break-even
point.
7.
Give the formulas for determining sales required to earn
target net income.
8.
Define margin of safety, and give the formulas for
computing it.
preview of chapter 5
Page
5-4
Cost
Cost Behavior
Behavior Analysis
Analysis
Cost Behavior Analysis is
the study of how specific costs respond to
changes in the level of business activity.
Some costs change; others remain the same.
Helps management plan operations and decide
between alternative courses of action.
Applies to all types of businesses and entities.
Page
5-5
Cost
Cost Behavior
Behavior Analysis
Analysis
Starting point is measuring key business activities.
Activity levels may be expressed in terms of:
Sales dollars (in a retail company)
Miles driven (in a trucking company)
Room occupancy (in a hotel)
Dance classes taught (by a dance studio)
Many companies use more than one measurement
base.
Page
5-6
Cost
Cost Behavior
Behavior Analysis
Analysis
Changes in the level or volume of activity
should be correlated with changes in costs.
Activity level selected is called activity or
volume index.
The activity index:
Page
5-7
Identifies the activity that causes changes in the
behavior of costs.
Allows costs to be classified as variable, fixed,
or mixed.
Cost
Cost Behavior
Behavior Analysis
Analysis
Variable Costs
Costs that vary in total directly and proportionately
with changes in the activity level.
Example: If the activity level increases 10 percent,
total variable costs increase 10 percent.
Example: If the activity level decreases by 25
percent, total variable costs decrease by 25
percent.
Variable costs remain the same per unit at every
level of activity.
Page
5-8
SO 1 Distinguish between variable and fixed costs
Cost
Cost Behavior
Behavior Analysis
Analysis
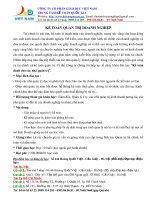
Illustration: Damon Company manufactures radios that
contain a $10 digital clock. The activity index is the
produced.
Damon
number of As
radios
Illustration 5-1
manufactures each radio, the
total cost of the clocks increases
by $10. As part (a) of Illustration
5-1 shows, total cost of the clocks
will be $20,000 if Damon
produces 2,000 radios, and
$100,000 when it produces
10,000 radios. We also can see
that a variable cost remains the
same per unit as the level of
Page
5-9 activity changes.
SO 1 Distinguish between variable and fixed costs
Cost
Cost Behavior
Behavior Analysis
Analysis
Illustration: Damon Company manufactures radios that
contain a $10 digital clock. The activity index is the
produced.
Damon
number of As
radios
Illustration 5-1
manufactures each radio, the
total cost of the clocks increases
by $10. As part (b) of Illustration
5-1 shows, the unit cost of $10 for
the clocks is the same whether
Damon produces 2,000 or 10,000
radios.
Page
5-10
SO 1 Distinguish between variable and fixed costs
Cost
Cost Behavior
Behavior Analysis
Analysis
Variable Costs
Illustration 5-1
Page
5-11
SO 1 Distinguish between variable and fixed costs
Cost
Cost Behavior
Behavior Analysis
Analysis
Fixed Costs
Costs that remain the same in total regardless of
changes in the activity level.
Per unit cost varies inversely with activity: As
volume increases, unit cost declines, and vice versa
Examples:
Page
5-12
Property taxes
Insurance
Rent
Depreciation on buildings and equipment
SO 1 Distinguish between variable and fixed costs
Cost
Cost Behavior
Behavior Analysis
Analysis
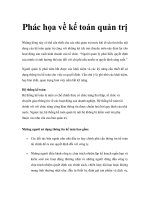
Illustration: Damon Company leases its productive
facilities at a cost of $10,000 per month. Total fixed costs
facilities
will remain constant at
of the
Illustration 5-2
every level of activity, as part
(a) of Illustration 5-2 shows.
Page
5-13
SO 1 Distinguish between variable and fixed costs
Cost
Cost Behavior
Behavior Analysis
Analysis
Illustration: Damon Company leases its productive
facilities at a cost of $10,000 per month. Total fixed costs
facilities
will remain constant at
of the
Illustration 5-2
every level of activity. But, on a
per unit basis, the cost of rent will
decline as activity increases, as
part (b) of Illustration 5-2 shows.
At 2,000 units, the unit cost is $5
($10,000 / 2,000). When Damon
produces 10,000 radios, the unit
cost is only $1 ($10,000 / 10,000).
Page
5-14
SO 1 Distinguish between variable and fixed costs
Cost
Cost Behavior
Behavior Analysis
Analysis
Fixed Costs
Illustration 5-2
Page
5-15
SO 1 Distinguish between variable and fixed costs
Cost
Cost Behavior
Behavior Analysis
Analysis
Review Question
Variable costs are costs that:
a. Vary in total directly and proportionately with
changes in the activity level.
b. Remain the same per unit at every activity level.
c. Neither of the above.
d. Both (a) and (b) above.
Page
5-16
Solution on
notes page
SO 1 Distinguish between variable and fixed costs
Cost
Cost Behavior
Behavior Analysis
Analysis
Relevant Range
Throughout the range of possible levels of
activity, a straight-line relationship usually does not
exist for either variable costs or fixed costs.
The relationship between variable costs and changes
in activity level is often curvilinear.
For fixed costs, the relationship is also nonlinear
– some fixed costs will not change over the entire
range of activities while other fixed costs may change.
Page
5-17
SO 2 Explain the significance of the relevant range
Cost
Cost Behavior
Behavior Analysis
Analysis
Relevant Range
Illustration 5-3
Page
5-18
SO 2 Explain the significance of the relevant range
Cost
Cost Behavior
Behavior Analysis
Analysis
Relevant Range - Range of activity over
which a company expects to operate during a
year.
Illustration 5-4
Page
5-19
SO 2 Explain the significance of the relevant range
Cost
Cost Behavior
Behavior Analysis
Analysis
Review Question
The relevant range is:
a. The range of activity in which variable costs will
be curvilinear.
b. The range of activity in which fixed costs will be
curvilinear.
c. The range over which the company expects to
operate during a year.
d. Usually from zero to 100% of operating capacity.
Page
5-20
SO 2 Explain the significance of the relevant range
Cost
Cost Behavior
Behavior Analysis
Analysis
Mixed Costs
Costs that have both a variable cost element
and a fixed cost element.
Change in total but
proportionately
changes in
activity level.
Page
5-21
Illustration 5-5
not
with
SO 3 Explain the concept of mixed costs.
Cost
Cost Behavior
Behavior Analysis
Analysis
K Christel, LLP, reports the following total
costs at two levels of production.
Classify each cost as variable, fixed, or
mixed.
Variabl
e
Fixed
Mixed
Page
5-22
SO 3 Explain the concept of mixed costs.
Cost
Cost Behavior
Behavior Analysis
Analysis
Mixed Costs - High-Low Method
Mixed costs must be classified into their fixed and
variable elements.
High-Low Method uses the total costs incurred at
both the high and the low levels of activity to
classify mixed costs.
The difference in costs between the high and low
levels represents variable costs, since only
variable costs change as activity levels
change.
Page
5-23
SO 3 Explain the concept of mixed costs.
Cost
Cost Behavior
Behavior Analysis
Analysis
Mixed Costs - High-Low Method
STEP 1: Determine variable cost per unit
using the following formula:
Illustration 5-6
Page
5-24
SO 3 Explain the concept of mixed costs.
Cost
Cost Behavior
Behavior Analysis
Analysis
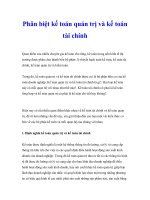
Mixed Costs - High-Low Method
Illustration: Metro Transit Company has the
following maintenance costs and mileage data for its
fleet of buses over a 4-month period.
Illustration 5-7
Change in
Costs
High minus
Low
Page
5-25
(63,000 - 30,000)
$33,000
(50,000 - 20,000)
30,000
= $1.1
0cost
per
unit
SO 3 Explain the concept of mixed costs.