ch14 Financial Statement Analysis Ke toan quan tri
Bạn đang xem bản rút gọn của tài liệu. Xem và tải ngay bản đầy đủ của tài liệu tại đây (1.62 MB, 61 trang )
Page
14-1
Financial Statement
Analysis
Managerial Accounting
Fifth Edition
Weygandt Kimmel Kieso
Page
14-2
study objectives
1.
Discuss the need for comparative analysis.
2.
Identify the tools of financial statement analysis.
3.
Explain and apply horizontal analysis.
4.
Describe and apply vertical analysis.
5.
Identify and compute ratios used in analyzing a firm’s
liquidity, profitability, and solvency.
6.
Understand the concept of earning power, and how
irregular items are presented.
7.
Page
14-3
Understand the concept of quality of earnings.
preview of chapter 14
Page
14-4
Basics
Basics of
of Financial
Financial Statement
Statement
Analysis
Analysis
Analyzing financial statements involves:
Comparison
Bases
Characteristics
Liquidity
Profitability
Solvency
Tools of
Analysis
Intracompan
y
Horizontal
Industry
averages
Ratio
Vertical
Intercompan
y
Page
14-5
SO 1
SO 2
Discuss the need for comparative analysis.
Identify the tools of financial statement
Horizontal
Horizontal Analysis
Analysis
Horizontal analysis, also called trend
analysis, is a technique for evaluating a series of
financial statement data over a period of time.
Its purpose is to determine the increase or
decrease that has taken place.
Horizontal analysis is commonly applied to the
balance sheet, income statement, and statement
of retained earnings.
Page
14-6
SO 3 Explain and apply horizontal analysis.
Horizontal
Horizontal Analysis
Analysis
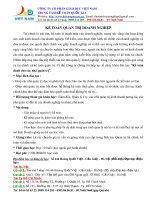
Balance
TheseSheet
changes
suggest that the
company expanded
its asset base
during 2007 and
financed this
expansion
primarily by
retaining income
rather than
assuming additional
long-term debt.
Illustration 14-5
Horizontal analysis of
balance sheets
Page
14-7
SO 3 Explain and apply horizontal analysis.
Horizontal
Horizontal Analysis
Analysis
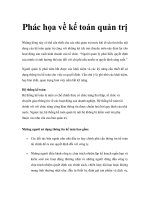
Income
Statement
Overall, gross profit
and net income
were up
substantially. Gross
profit increased
17.1%, and net
income, 26.5%.
Quality’s profit
trend appears
favorable.
Illustration 14-6
Horizontal analysis of
Income statements
Page
14-8
SO 3 Explain and apply horizontal analysis.
Horizontal
Horizontal Analysis
Analysis
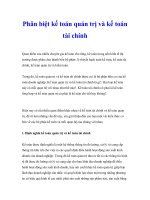
Retained
Earnings
Statement
Illustration 14-7
Horizontal analysis of
retained earnings
statements
We saw in the horizontal analysis of the balance sheet that ending
retained earnings increased 38.6%. As indicated earlier, the company
retained a significant portion of net income to finance additional plant
facilities.
Page
14-9
SO 3 Explain and apply horizontal analysis.
Horizontal
Horizontal Analysis
Analysis
Summary financial information for Rosepatch
Company is as follows.
Compute the amount and percentage changes in 2011 using
horizontal analysis, assuming 2010 is the base year.
Page
14-10
Solution on
notes page
SO 3 Explain and apply horizontal analysis.
Vertical
Vertical Analysis
Analysis
Vertical analysis, also called common-size
analysis, is a technique that expresses each
financial statement item as a percent of a base
amount.
On an income statement, we might say that
selling expenses are 16% of net sales.
Vertical analysis is commonly applied to the
balance sheet and the income statement.
Page
14-11
SO 4 Describe and apply vertical analysis.
Vertical
Vertical Analysis
Analysis
Balance
TheseSheet
results
reinforce the
earlier
observations that
Quality is
choosing to
finance its
growth through
retention of
earnings rather
than through
issuing
additional
debt.
Illustration
14-8
Vertical analysis of
balance sheets
Page
14-12
SO 4 Describe and apply vertical analysis.
Vertical
Vertical Analysis
Analysis
Income
Statement
Quality appears
to be a profitable
enterprise that is
becoming even
more successful.
Illustration 14-9
Vertical analysis of
Income statements
Page
14-13
SO 4 Describe and apply vertical analysis.
Vertical
Vertical Analysis
Analysis
Enables a comparison of companies of different sizes.
Illustration 14-10
Intercompany income
statement comparison
J.C. Penney earned net income more than 4,208 times larger than
Quality’s, J.C. Penney’s net income as a percent of each sales dollar (5.6%)
is only 44% of Quality’s (12.6%).
Page
14-14
SO 4 Describe and apply vertical analysis.
Ratio
Ratio Analysis
Analysis
Ratio analysis expresses the relationship among
selected items of financial statement data.
Financial Ratio Classifications
Page
14-15
Liquidity
Profitability
Solvency
Measures shortterm ability of
the company to
pay its maturing
obligations and
to meet
unexpected
needs for cash.
Measures the
income or
operating
success of a
company for a
given period of
time.
Measures the
ability of the
company to
survive over a
long period of
time.
SO 5 Identify and compute ratios used in
analyzing a firm’s liquidity, profitability,
Ratio
Ratio Analysis
Analysis
A single ratio by itself is not very
meaningful.
The discussion of ratios will
include the following
types of comparisons.
Page
14-16
SO 5 Identify and compute ratios used in
analyzing a firm’s liquidity, profitability,
Ratio
Ratio Analysis
Analysis
Liquidity Ratios
Measure the short-term ability of the company to
pay its maturing obligations and to meet
unexpected needs for cash.
Short-term creditors such as bankers and
suppliers are particularly interested in
assessing liquidity.
Ratios include the current ratio, the acid-test
ratio, receivables turnover, and inventory
turnover.
Page
14-17
SO 5 Identify and compute ratios used in
analyzing a firm’s liquidity, profitability,
Ratio
Ratio Analysis
Analysis
1. Current Ratio
Liquidity Ratios
Illustration 14-12
The ratio of 2.96:1 means that for every dollar of current
liabilities, Quality has $2.96 of current assets.
Page
14-18
Solution on
notes page
SO 5 Identify and compute ratios used in
analyzing a firm’s liquidity, profitability,
Page
14-19
Ratio
Ratio Analysis
Analysis
Liquidity Ratios
2. Acid-Test Ratio
Illustration 14-13
Page
14-20
SO 5 Identify and compute ratios used in
analyzing a firm’s liquidity, profitability,
Ratio
Ratio Analysis
Analysis
Liquidity Ratios
2. Acid-Test Ratio
Illustration 14-14
Measures immediate short-term liquidity.
Page
14-21
Solution on
notes page
SO 5 Identify and compute ratios used in
analyzing a firm’s liquidity, profitability,
Ratio
Ratio Analysis
Analysis
Liquidity Ratios
3. Receivables Turnover
Number of times, on average, the company collects
receivables.
Page
14-22
Solution on
notes page
Illustration 14-15
SO 5 Identify and compute ratios used in
analyzing a firm’s liquidity, profitability,
Ratio
Ratio Analysis
Analysis
$2,097,000
($180,000 + $230,000) / 2
Liquidity Ratios
Receivables
Turnover
=
10.2 times
A variant of the receivables turnover ratio is to
convert it to an average collection period in
terms of days.
365 days / 10.2 times = every 35.78 days
This means that receivables are collected on
average every 36 days.
Page
14-23
SO 5 Identify and compute ratios used in
analyzing a firm’s liquidity, profitability,
Ratio
Ratio Analysis
Analysis
Liquidity Ratios
4. Inventory Turnover
Illustration 14-16
Number of times, on average, the inventory is sold.
Page
14-24
Solution on
notes page
SO 5 Identify and compute ratios used in
analyzing a firm’s liquidity, profitability,
Ratio
Ratio Analysis
Analysis
$1,281,000
($500,000 + $620,000) / 2
Liquidity Ratios
Inventory
Turnover
= 2.3 times
A variant of inventory turnover is the days in
inventory.
365 days / 2.3 times = every 159 days
Inventory turnover ratios vary considerably among
industries.
Page
14-25
SO 5 Identify and compute ratios used in
analyzing a firm’s liquidity, profitability,