Báo cáo hóa học research article cross time frequency analysis of gastrocnemius electromyographic signals in hypertensive and nonhypertensive subjects
Bạn đang xem bản rút gọn của tài liệu. Xem và tải ngay bản đầy đủ của tài liệu tại đây (14.15 MB, 15 trang )
Hindawi Publishing Corporation
EURASIP Journal on Advances in Signal Processing
Volume 2010, Article ID 206560, 15 pages
doi:10.1155/2010/206560
Research Article
Cross Time-Frequency Analysis of
Gastrocnemius Electromyographic Signals in
Hypertensive and Nonhypertensive Subjects
Patrick Mitchell,1 Debra Krotish,2, 3 Yong-June Shin,1 and Victor Hirth2, 3
1 Department
of Electrical Engineering, University of South Carolina, 301 S. Main St. Columbia, SC 29208, USA
of Geriatrics, Palmetto Health Richland, 3010 Farrow Road Suite 300A Columbia, SC 29203, USA
3 School of Medicine, University of South Carolina, 6311 Garners Ferry Rd, Columbia, SC 29209, USA
2 Division
Correspondence should be addressed to Yong-June Shin,
Received 31 January 2010; Revised 14 May 2010; Accepted 9 August 2010
Academic Editor: Lutfiye Durak
Copyright © 2010 Patrick Mitchell et al. This is an open access article distributed under the Creative Commons Attribution
License, which permits unrestricted use, distribution, and reproduction in any medium, provided the original work is properly
cited.
The effects of hypertension are chronic and continuous; it affects gait, balance, and fall risk. Therefore, it is desirable to assess gait
health across hypertensive and nonhypertensive subjects in order to prevent or reduce the risk of falls. Analysis of electromyography
(EMG) signals can identify age related changes of neuromuscular activation due to various neuropathies and myopathies, but it
is difficult to translate these medical changes to clinical diagnosis. To examine and compare geriatrics patients with these gaitaltering diseases, we acquire EMG muscle activation signals, and by use of a timesynchronized mat capable of recording pressure
information, we localize the EMG data to the gait cycle, ensuring identical comparison across subjects. Using time-frequency
analysis on the EMG signal, in conjunction with several parameters obtained from the time-frequency analyses, we can determine
the statistical discrepancy between diseases. We base these parameters on physiological manifestations caused by hypertension, as
well as other comorbities that affect the geriatrics community. Using these metrics in a small population, we identify a statistical
discrepancy between a control group and subjects with hypertension, neuropathy, diabetes, osteoporosis, arthritis, and several
other common diseases which severely affect the geriatrics community.
1. Introduction
For the older adult population, falls continue to be a threat to
morbidity and mortality [1]. Falls accounted for some $19.5
billion dollars of health care costs in the United States in 2000
[2], and is one of the significant factors for unintentional
injury resulting in death in people aged 65–85. As the
number of older adults increases, the number of fall-related
injuries and death is also likely to increase [1]. Over one third
of community dwelling adults, aged 65 and older, fall each
year [3, 4], and the rate of falls increases by 7%–17% for
adults 80 years and older [4–6]. Falls are the leading cause of
admission to nursing homes and assisted care living facilities
[6], and healthcare costs associated with falls are estimated to
increase dramatically as fall-related injuries increase for older
adults [7–9]. Although the number of injuries and deaths
and the economic impact of falls continue to rise, the greatest
cost is in the loss of mobility, independence, and autonomy
in the later years of life.
Examining methods to identify fall risk factors is
paramount to developing a successful strategy to decrease
the rate of falls in the United States. A number of studies
have examined some of the more common comorbidities
that increase fall risk in the geriatric community. Motor
impairments rank as one of the most significant factors
in falls, resulting from decreases in muscle mass, muscular
strength, and muscular power [10, 11]. Several comorbidities, including neuropathy, diabetes, and high blood
pressure, are known to accelerate this degeneration, and
thereby increase the risk of falling [12]. In order to quantify
this degeneration, we used electromyography, a method
long used for assessment of musculoskeletal health and
2
diagnosis of specific diseases. To analyze gait associated with
detrimental comorbidities objectively, we propose a method
using time-frequency analysis of the EMG signals. Since
classical EMG analysis uses subjective or intuitive methods to
assess gait abnormalities, it is desirable to analyze parameters
pertaining to gait in relation to the specific degeneration
cause by the aforementioned comorbidities.
Historically, electromyography (EMG), the method of
recording the electrical or neurological activity of skeletal muscles, has been particularly useful for determining
medical abnormalities and gait deficits, such as neuropathy,
Parkinson’s, and carpal tunnel syndrome. This paper records
gait patterns and EMG signals for comparison across different individuals, with and without the comorbidities in
question. To compare subject-to-subject electromyography
data accurately, an independent reference of gait is desirable.
Therefore, we used a pressure-sensitive walkway, which
records time and pressure data that, by an external trigger,
is time-synchronized to the recording of the EMG signals, by
use of a series of pressure sensors tied together. The EMG
signals are recorded using eight surface EMG sensors routed
to a wireless transmitter pack, which sends the data to a host
computer. This data acquisition process and experimental
setup are described in detail in Section 2.1.
However, due to the transient nature of EMG signals
[13], we chose an advanced signal processing approach
known as time-frequency analysis. Time-frequency analysis
techniques have also been applied to EMG signal analysis, in considering the complex phenomenon known as
localized muscle fatigue [14], as well as for the assessment
and accurate classification of Parkinson’s disease [15]. A
unique subset of this methodology, known as cross timefrequency analysis, is the primary focus of this paper.
This methodology can directly compare two signals and
identify discrepancies in the time and frequency domain
simultaneously. Previous applications of time-frequency
analysis use a thresholding method for signal selection
and division, as opposed to our approach, which uses
the gait information directly for signal selection. When
this method is used in conjunction with cross timefrequency analysis, we can compare EMG data across the
same period within the gait cycle. Time-frequency analysis
techniques have seen successful application to the biomedical
realm, such as in determining the feedback relationships
between postural control and visual impairment [16] in
the platform test environment. As the knowledge base
for application of cross time-frequency analysis grows, the
clinical application for this method will become more
apparent.
Our experimental setup is introduced in Section 2.
The methods of time-frequency analysis and cross timefrequency analysis are discussed in Section 3.1, as well as our
unique selection of metrics. Section 4 discusses the results
of our initial trial in detail, explaining the application of
the metrics to two specific cases, then going on to compare
the results of the initial trials. The metrics determined show
significant discrepancy on our initial data in a quantitative
manner, with differences around eleven percent between
hypertensive and nonhypertensive cases.
EURASIP Journal on Advances in Signal Processing
2. Electromyography, Gait, and
Data Acquisition
Since muscle activation is not easily apprehended by visual
inspection, clinical observation alone does not provide a
complete picture of gait coordination. Electromyography can
provide information about muscle function within the gait
cycle, and the timing of the muscles as they work in selfcoordination [17]. The electrical signals recorded during
firing the muscles may be either over-or underactive in the
affected muscle groups. We selected four major muscles,
including the vastus lateralis, biceps femoris, tibialis anterior,
and gastrocnemius due to the predominant role each muscle
plays in gait and the muscles’ accessibility for data collection.
There is a large range of subjects present in this study,
consisting of 57 elderly subjects and 10 younger subjects.
Elderly subjects were all over age 65, 30% male, while the
younger subjects were all under 35, 90% male. Recruitment
for subjects occurred from a geriatric medical practice
and a local retirement community, as well as the graduate
department of the publishing school. We obtained approval
from the IRB, and all subjects provided informed consent.
All participants were cognitively intact, community dwelling
healthy older adults, who were ambulatory and living
independently. We excluded participants who had a score of
less than 25 on the Folstein Mini Mental State Exam (MMSE)
[18]. Inclusion in the study was independent of gender, race,
or ethnic background. We gathered medical records for each
participant from his/her primary care physician. A clinical
research nurse reviewed the records and categorized them
into two groups according to hypertension diagnosis or no
existing comorbidities.
2.1. Data Acquisition. In order to acquire gait-synchronized
EMG signals, we used a commercially available wireless
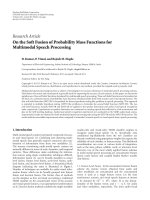
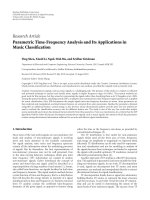
surface EMG interface, in conjunction with a pressuresensitive walkway. Figure 1 shows the experimental setup
used to collect data. The wireless EMG system uses a lithiumion powered pack (c), which acts as an IEEE 802.11b
broadcast host. The eight surface EMG sensors (b) route to
the pack, where the signals are amplified. The pack samples at
1 kHz, with a band-pass filter set from 20 Hz–450 Hz, sensor
to amplifier length is less than 2 m. When recording, data
transfers to a host computer (e) using the Wi-Fi link.
The mat (a) in Figure 1 is a 6 m long runway with 48×384
pressure sensors distributed uniformly throughout the mat
itself. These sensors route to a central recording unit (f) that
samples the sensors at 60 Hz. This sampling records footfall
pressure changes in time over the length of the mat. Using a
time-synchronization triggering system developed in-house,
the signals recorded by the wireless EMG system correspond
in time to the information recorded by the walkway.
For the experiment, surface EMGs were applied to the
four muscles in each leg by a trained research professional.
Figure 1 also shows the location of each of these four sensors,
placed on each of the four largest muscle control units
responsible for gait, as described in the previous section.
The wires were then secured and connected to the wireless
EURASIP Journal on Advances in Signal Processing
3
(i)
Sensor 3
(j)
Sensor 4
(e)
(c)
(d)
(g)
Sensor 1
(b)
(a)
(h)
Sensor 2
(f)
2.2. Use of Gait Synchronization for Signal Division. In order
to address the problem of cross-subject muscular activation
comparison, we used a footfall synchronization approach.
The normal gait cycle employs similar muscular activation
regardless of the subject, and is desirable for use as a standard
to compare same-muscle activation across subjects. Using
the same portion of the gait cycle from subject to subject
ensures that upon analysis, the EMG signals are comparable.
This method ensures that each cross time-frequency plot is
aligned across each subjects’ individual gait cycle, and each
1
0
−1
S1 S2
0
S3
0.5
1
S4
S5
1.5
Time (s)
2
S6
2.5
S7
3
Normalized
voltage
(a)
1
0
−1
S1 S2
0
S4
S5
1.5
Time (s)
2
S3
0.5
1
S6
2.5
S7
3
(b)
Pressure
location
transmitter pack. The subjects walked on the pressuresensitive walkway at a normal pace for two trials, then at a
faster pace for two additional trials. Subjects began their walk
at a designated acceleration line 2 m before the beginning of
the mat and continued to a deceleration line 2 m after the end
of mat.
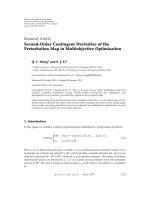
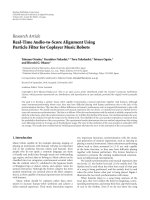
Figure 2 is a graphical example of a single walk file from
a healthy subject. Shown in the first two plots are the left
(a) and right (b) gastrocnemius muscle’s EMG signals and
under these plots is a record of the time-aligned y position
information. Due to the four-dimensional (time, X, Y , and
pressure) nature of the mat, only the time and Y -axis (the
span of the mat) are displayed (c). The stance phase divisions,
marked in red, are determined independent of the EMG
information and are located entirely by gait analysis. These
divisions align with signal groups for the gastrocnemius contraction, due to its use primarily during the stance phase. The
primary wave packets (S1 , S2 ) correspond to contractions,
and their secondary compliments (S1 , S2 ) correspond to the
stance phase of the opposing leg, during which time the
gastrocnemius should be in relative disuse.
Once these wave packets are selected in software, we
can properly analyze them using time-frequency analysis. By
then comparing the wave packets to one another within an
individual, we can gather information unique to that subject.
Section 3.2 discusses the parameters by which we compare
subjects in more detail.
Normalized
voltage
Figure 1: Diagram of data collection setup (a) pressure-sensitive walkway, (b) EMG sensors connected to muscles, (c) amplifier and wireless
transmitter unit, (d) 802.11 receiver, (e) data-recording computer, (f) walkway data converter and EMG sensor locations, (g) sensor 1: tibialis
anterior (h) sensor 2: gastrocnemius (i) sensor 3: vastus lateralis (j) sensor 4: biceps femoris.
20
10 S1 S2
0
−10
0
0.5
S3
1
S4
S5
1.5
Time (s)
2
S6
2.5
S7
3
(c)
Figure 2: Time-aligned EMG signals of (a) left gastrocnemius
(b) right gastrocnemius, and (c) pressure walkway recording, with
swing phase divisions shown in red.
signal selected is taken at the same time. After selection,
the signals are zero-padded to equalize their lengths to the
longer of the two signals, but all signals start immediately
at the beginning of each footfall. Figure 2 shows this signal
separation in detail within the gastrocnemius muscle, as
denoted by the red lines. Each muscle group has different
periods of activation, making it desirable to determine the
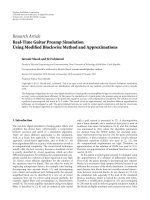
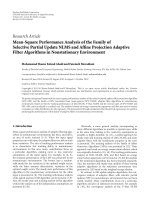
optimal signal selection based on the gait cycle. Figure 3
shows the normalized energy in each of the four muscle
groups on one leg through the course of a single healthy
gait cycle. Within a single gait cycle, the four major muscle
4
EURASIP Journal on Advances in Signal Processing
groups contract and release to control joint actuation, thus
producing locomotion.
The gastrocnemius muscle (c) lends itself to analysis by
the nature of its contraction over the course of a single stance
phase, as well as its importance to overall gait health. This
muscle activates during the push-off stage leading up to the
swing phase, actuating the heel and preparing the heel for
contact during the next stance phase. During the release
of the muscle, the opposing leg’s muscle begins activation,
causing a very distinct pattern that aligns with footfalls. Thus
by lining up wave packet selection with the beginning of each
swing phase, we captured the contraction of the muscle over
the course of the swing.
3. Theory of Application of Time-Frequency
Analysis to EMG Signals
3.1. Cross Time-Frequency Analysis. EMG signals have always
lent themselves to spectral analysis. Because of their heterogeneous nature, it is desirable to decompose these signals into
their primary frequency components. In order to analyze
signals in the time and frequency domain simultaneously,
we must first divide the signal into smaller segments, and
then analyze that segment in the frequency domain. This
process is called time-domain windowing, and a timelocalized signal st (τ) becomes
st (τ) = s(τ)h(τ − t),
(1)
where h(t) is a window function centered at time t. While
moving along different time slices, we can determine the
frequency content at each slice using the Short-Time Fourier
Transform (STFT) [19]. The equation for the STFT is
1
St (ω, t) = √
2π
s(τ)h(τ − t)e− jωt dτ.
(2)
By this definition of STFT, one can find the magnitude
of the signal at any time and frequency. This representation’s
resolution on time-frequency domain is highly dependent on
proper selection of the window, h(t). Due to the transient
nature of electromyography signals as shown in Figure 3,
a single window for all cases is not ideal. Therefore, it
is desirable to use a representation that is less dependent
on proper window selection. The Wigner distribution is
one such kernel, but is extremely susceptible to crossterm distortion [19], and when signal characteristics are
unknown, this distribution becomes difficult to interpret.
We therefore use the Reduced Interference Distribution
(RID), which has the advantages of a time-and frequencydomain representation, while eliminating cross-terms using
time-smoothing window as well as a frequency-smoothing
window. This distribution has seen previous application
in time-frequency analysis when dealing with EMG signals
[13, 20]. These windows reduce the effect that cross-terms
have by attenuating the signals where the cross-terms would
otherwise occur [21]. The RID is defined as follows:
RIDx (t, ω) =
∞
−∞
h(τ)Rx (t, τ)e− jωτ dτ,
(3)
where Rx (t, τ) is an instantaneous autocorrelation with a
time-smoothing window, h(τ). For our purpose, we chose
to use a Hanning frequency-smoothing window. Thus, for
a signal x(t) in the time-domain, the instantaneous autocorrelation function is
Rx (t, τ)
=
|τ |/2
g(v)
τ
2πv
τ
1+cos
x t+v+ x∗ t+v − dv ,
|τ |
τ
2
2
(4)
−|τ |/2
where g(v) is a frequency-smoothing window.
The traditional time-frequency distribution enables us to
analyze the time-varying spectral characteristic of a single
waveform. However, in this study of gait, it is necessary for
us to consider a time-localized cross-correlation between two
signals, such as left and right muscle groups responsible for
gait. In this paper, the wave packets defined as Si j correspond
to the time-domain signal x(t). Shin et al. established a
cross time-frequency transformation based on Williams’ [21]
definition that preserves phase information [22]. To develop
this transformation, we begin by using the definition of the
instantaneous cross-correlation
Rx1 x2 (t, τ) = x1
t+τ ∗ t−τ
x2
.
2
2
(5)
From here we apply the Fourier transform to obtain the
cross-Wigner distribution Wx1 x2 (t, ω),
Wx1 x2 (t, ω) =
1
2π
Rx1 x2 (t, τ)e− jωτ dτ.
(6)
By taking a 2-D Fourier transform of the desired kernel
and then inserting this transformed kernel into the definition
of the cross-Wigner distribution, we preserve the phase
information contained in the kernel:
Jx1 x2 (t, ω; Φ) =
1
4π 2
Wx1 x2 (u, ξ)Φ(t − u, ω − ξ)du dξ,
(7)
where Φ(t, ω) is the 2-D Fourier transform of the desired
kernel φ(θ, τ):
Φ(t, ω) =
φ(θ, τ)e− j(θt+τω) dθdt.
(8)
We finally define the cross time-frequency distribution as
follows [22]:
Jx1 x2 t, ω; φ
=
1
4π 2
x1 t −
τ
τ ∗
x2 t +
φ(θ, τ)e− jθt− jτω+ jτv dθdτdv.
2
2
(9)
By preserving the phase, we can ascertain valuable information that would otherwise be lost, as well as information
about the correlation between two signals x1 (t) and x2 (t).
In contrast to the cross-correlation, the cross time-frequency
distribution allows us to determine the localized time-and
EURASIP Journal on Advances in Signal Processing
5
(e)
Biceps
femoris
(b)
(c)
(d)
Tibialis Gastrocenemius Vastus
lateralis
anterior
(e)
Loading
Heel
response
strike
(start of cycle) (foot flat)
Midstance
Terminal
stance
(heel off)
Preswing
Heel
strike
(start of cycle)
Terminal swing
Swing phase
Stance phase
Single gait cycle
Voltage
(a)
1
0.5
0
0
0.2
0.4
0.6
0.8
Time (s)
1
1.2
1
1.2
1
1.2
1
1.2
Voltage
(b)
1
0.5
0
0
0.2
0.4
0.6
0.8
Time (s)
Voltage
(c)
1
0.5
0
0
0.2
0.4
0.6
0.8
Time (s)
Voltage
(d)
1
0.5
0
0
0.2
0.4
0.6
0.8
Time (s)
(e)
Figure 3: (a) Gait cycle aligned with normalized EMG voltages of (b) tibialis anterior, (c) gastrocnemius, (d) vastus lateralis, and (e) biceps
femoris in a healthy case over a single gait cycle.
frequency-moments where the peak correlation between two
signals occurs. Since this distribution returns a set of complex
numbers, we assess the cross time-frequency analysis using
the real part of the distribution. Our method uses the definition and properties of cross time-frequency analysis [22]
to arrive at the quantitative metrics defined in Section 3.2.
We define the joint time-moment and frequency-moment
by use of the real part of cross time-frequency distribution,
respectively,
−tx1 x2 (ω) = R
ωx1 x2 (t) = R
tJx1 x2 t, ω; φ dt
,
Jx1 x2 t, ω; φ dt
ωJx1 x2 t, ω; φ dω
.
Jx1 x2 t, ω; φ dω
(10)
Because the cross time-frequency distribution is a
complex representation, we find the normalized time and
frequency moments by taking the real portion of the
distribution. As we take the real part of the complex cross
time-frequency distribution, the joint moment will collapse
to instantaneous frequency and group delay in traditional
auto time-frequency analysis if the signal pair x1 (t) and
x2 (t) are identical. These joint moments in time and frequency domain are critically relevant for our study, where
the time and frequency localized correlation is representative
of muscular activation and force. For simplicity of mathematical expressions below, we assume that the cross timefrequency distribution (Jx1 x2 (t, ω)) is normalized to unity.
Extending the definition of the joint time-and frequencymoments in (10), one can define following normalized joint
6
EURASIP Journal on Advances in Signal Processing
time-and frequency-centers based on cross time-frequency
distribution:
tx 1 x 2 = R
t · Jx1 x2 (t, ω)dω dt ,
(11)
ωx1 x2 = R
ω · Jx1 x2 (t, ω)dω dt .
The joint time center (tx1 x2 ) and frequency center (ωx1 x2 )
enable us to identify the time and frequency centers of
the pair of signals x1 (t) and x2 (t). In particular, the joint
frequency center allows us to determine most significant
overlapping frequency components between the signal pairs,
a property utilized by one of our three metrics for evaluation.
The applications of this definition and its experimental result
are discussed in Section 4.1. Furthermore, the joint time and
frequency center enable one to determine joint time duration
(Tx1 x2 ) and frequency bandwidth (Ωx1 x2 ) as follows:
Tx21 x2 = R
t − tx 1 x 2
2
· Jx1 x2 (t, ω)dω dt ,
(12)
Ω2x1 x2 = R
ω − ωx1 x2
2
of gait, this translates to cadence that is more succinct and
deliberate, but can also indicate overexertion or inefficiency.
The frequency center correlates to the maximal torque
achieved within the muscle, specifically at the push-off
instance in the gastrocnemius (see Figure 4). Therefore, it
is desirable to examine this parameter as it relates to every
footfall. This frequency center has a very distinct band
around it, which corresponds to a much higher level of
energy than otherwise present in the wave packet elsewhere.
We measured and recorded this bandwidth, in both the time
and frequency domains for each footfall as well as for the
cross time-frequency analyses.
Through use of the time-frequency representation, we
can easily determine the amount of energy within a specific
range by merely integrating over the desired range. We then
divide by the total energy contained in the signal to find a
percentage.
Ex1 x2 (ω > 2π · 100) =
1
Ex
ωmax
tmax
ω=2π ·100
t =0
Jx1 x2 (t, ω)dt dω.
(13)
· Jx1 x2 (t, ω)dω dt .
The traditional definitions of time duration and frequency bandwidth describe the degree of a distribution’s
spreading in the time-frequency domain. Likewise, the joint
time-duration and joint frequency-bandwidth quantify the
degree of spreading of the joint time-frequency signature
in time and frequency domain respectively. In conjunction
with the joint frequency center defined in (1), one can find
significant differences between the healthy and unhealthy
subjects’ EMG signature in terms of the joint time duration
(Tx1 x2 ) and joint frequency bandwidth (Ωx1 x2 ), which is
discussed in Section 4.1.
3.2. Metric Selection. After the wave packet selection, it was
desirable to obtain measures of overall gait health, as well as
defining features, within the time-frequency analyses of the
signals. By review and analysis, we have developed several
parameters by which we gauge each subjects’ overall fitness as
it pertains to muscle activation for gait. These metrics are: the
time-and frequency-bandwidth of the wave packet peak (to
the −3 dB point of the peak), the frequency center of the wave
packet peak, and the percent of energy in the signal above
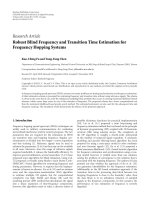
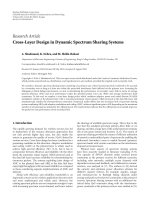
100 Hz. Figure 4 shows the cross time-frequency distribution
of a left and right EMG wave packet for single subject,
with the two wave packets represented in both the time and
frequency domain. The gait cycle is aligned in the figure,
identifying the parallelism between muscular activation and
the push-off phase of the gait cycle. The area above the white
line denoted by (e) corresponds to the energy measured
above 100 Hz through the course of a single contraction of
the gastrocnemius. The focused area (f) contains the energy
peak of the wave packet. This is the point at which the peak
instantaneous energy in the wave packet occurs, as well as
the time duration of the peak contraction and the frequency
bandwidth of the same contraction.
It has been shown that higher mean frequency corresponds to a higher amount of force [23], and in the case
This became our fourth metric; because more time
spent when muscles are in this band correspond to faster
contractions, and thus more powerful joint actuation. The
four metrics are now defined, and in order to condense
the large volume of metrics that exists upon time-frequency
analysis of every footfall, a matrix must be defined to
condense and intelligently present this information.
3.3. Definition of Matrix. As was previously described,
Figure 2 shows the primary and secondary wave packet definitions. It was desirable to compare these wave packets to one
another, as well as to perform analysis upon the primary wave
packets themselves. To organize the comparison between the
primary (S1 , S2 ) and secondary (S1 , S2 ) signals, a matrix
was developed that can be used to represent the different
parameters generated by each wave packet.
Equation (14) is the definition of our Spatiotemporal
Discrepancy Matrix (SDM) proposed for this study. The
cross time-frequency distribution metrics are in the upperright triangle, and the metric value contained in each slot
is the value for that particular pair of wave packets’ cross
time-frequency analysis. The main diagonal contains the
metrics for the autocorrelation of each prime wave packet,
and the lower left triangle contains cross-correlation of
the secondary wave packets. When performing analysis,
this information is valuable for some cases of hypertensive
subjects, as particularly in the case of the gastrocnemius, this
muscle should not be active
⎡
S11
S21 · · ·
Si−1 1
..
.
..
.
Si1
⎤
⎥
⎢
⎢
Si2 ⎥
⎥
⎢ S12 S22 · · ·
⎢
.. . .
.. ⎥
⎥
⎢ ..
S=⎢
,
.
.
. ⎥
⎥
⎢ .
⎥
⎢
.
⎥
⎢
⎣S1 j −1 . . · · · Si−1 j −1 Si j −1 ⎦
S1 j S2 j · · · Si−1 j
Si j
(14)
EURASIP Journal on Advances in Signal Processing
Loading response Midstance
Heel
strike
(foot flat)
(initial contact)
Stance phase (60%)
7
Terminal
stance
(heel off)
Terminal swing
Preswing
(toe off)
Push off
Gait cycle
Heel
strike
(initial contact)
Swing phase (40%)
Real part
(a)
1
0.5
0
−0.5
−1
Frequency (Hz)
(b)
400
350
300
250
200
150
100
50
0
(f)
(e)
0
0.1
0.2
0.3
0.4
0.5
0.6
0.4
0.5
(c)
4
2
0
−2
−4
−6
0
0.1
0.2
0.3
Time (s)
(d)
Figure 4: Time−aligned (a) gait cycle, (b) time−domain waveform of two EMG footfall wave packets, (c) cross time−frequency visualization
of two EMG footfall wave packets, (d) line denoting separation of measure for energy above 100 Hz, (e) location of peak energy and
time−bandwidth measures, (f) recording of pressure data from time−synchronized mat.
where Si j , i = j is the time-frequency distribution, Si j , i > j
is the cross time-frequency distribution between Si and S j ,
Si j , i < j is the cross time-frequency distribution between
Si and S j , and i = j = the total number of footfalls in the
walk. Ergo, the values above the main diagonal correspond
to the cross time-frequency analysis of the primary signals,
and the values below the main diagonal correspond to the
secondary signals. Each metric for each walk is organized
into a single matrix, thus for a single walk, there are three
matrices, as shown in Table 1.
These functions were defined in Section 3.1 by (12)
and (13). The method by which we further condense the
information and the use of the matrix is described in
Section 4.2.
Table 1: Example of matrices created due to single walk file
assuming three footfalls in walk.
Time
bandwidth
(ms)
Frequency
bandwidth
(Hz)
Frequency
center (Hz)
Percent energy above
100 Hz (%)
STij = TSi S j
Swij = FSi S j
SFij = ωSi S j
SEij = Esi s j (ω >
2π · 100)
3.4. Application of Time-Frequency Analysis. Upon acquisition of data, we exported data for each walk to commaseparated value format and imported this information
4. Experimental Results
4.1. Cross Time-Frequency Analysis of Gait EMG Wave
Packets. To ascertain the significance of the findings of this
paper, we will first examine two cases in detail, using the
methodology described in previous sections. Figure 5 shows
an example of one subject’s gastrocnemius EMG signals
in the time-domain during normal gait. The signals are
separated as described in Section 2.2, beginning with a left
footfall. These separated signals provide the data to which
we will apply time-frequency and cross time-frequency
analysis.
As was observed in Figure 2, for a healthy case the
gastrocnemius muscle activates during the stance phase of its
corresponding leg. To gain a more meaningful perspective
on the data, we will use time-frequency analysis. Figure 6
shows a series of time-frequency visualizations of the signals
denoted by S1 − S6 . The time-domain waveforms on which
the time-frequency analysis is performed is the same across
all six signals. The EMG signals were truncated as indicated
in Figure 5.
It is clear from this set of representations that the
gastrocnemius muscle activates for a large portion of the
stance phase, culminating at push-off, around 350–400 ms.
It is also worthwhile to notice the amount of content above
100 Hz. S3 is shown in more detail in Figure 7.
As discussed in Section 3.2, there are several metrics
we identify and compare in each signal’s time-frequency
analysis. In this footfall, the frequency center lies at f =
137 Hz (d). This frequency center marks the frequency at
which the highest instantaneous energy occurs within the
wave packet. Fifty-one percent of the energy within the
wave packet is above 100 Hz, which signifies overall faster
contraction throughout the wave packet. Also of note is
the time duration, which is 48 ms for this wave packet.
Shorter time durations correspond to a more succinct pushoff, and the frequency bandwidth corresponds to a more
1 S1
0
−1
0
S3
S2
0.5
1
S4
S5
1.5
2
Time (s)
S7
S6
2.5
3
Normalized
voltage
(a)
1 S1
0
−1
0
S2
0.5
S4
S3
1
S6
S5
1.5
2
Time (s)
2.5
S7
3
(b)
Pressure
location
to a mathematical computation program. The walk data
contained a matrix with time, X, Y , and pressure values
for each sampled moment for which a pressure sensor was
active. Using an algorithm that compares standard deviation
within the X and Y coordinates to look for large gaps where
footfalls occur, sections of stride were identified and their
time instances flagged, as described in Section 2.2. These
time instances correspond directly to the muscular activation
during the gait cycle. After the selection of the signal using
the footfall data, cross time-frequency information for each
pair of footsteps (left, right, cross, all) was synthesized, and
the metrics defined in Section 3.2 were stored in a matrix,
defined in Section 3.3. This generated one matrix for each
metric, for each walk, of which there are four per subject.
After creation of the matrices, data was aggregated and
analyzed based on medical history. Subjects found to be
without hypertension, diabetes, neuropathy, and a vitamin
D deficiency were considered for the selection of our normal
curve, as well as subjects under the age of 65 that had no gaitaltering conditions.
EURASIP Journal on Advances in Signal Processing
Normalized
voltage
8
10
S1
S2
S3
S4
S5
S6
S7
0
−10
0
0.5
1
1.5
2
Time (s)
2.5
3
(c)
Figure 5: Signal representation of (a) left gastrocnemius (b) right
gastrocnemius, and (c) pressure walkway recording, with swing
phase divisions shown in red for nonhypertensive subject 001
walk 4.
focused set of firings. Figure 8 shows the time-domain signal
of the left and right gastrocnemius for another subject.
Note the use of the muscle during the swing phase, during
which the muscle should show very little use, if any at
all. The swing phase for the muscle is marked by the
secondary signals (the prime signals). There is also a large
amount of muscle usage just before heel strike, where this
rotation should be natural rather than orchestrated by the
gastrocnemius.
The time-frequency distribution of wave packet 3 is
provided in Figure 10. The peak energy frequency center is
located at f = 68.2 Hz, almost 50 Hz below the previous case.
Also visible in the energy spectral density is a lower mean
frequency. In addition, the amount of frequency content
above 100 Hz is only 24.2%, composing less than one fourth
of the total energy. When comparing to Figure 7, the number
of significant firings is also noteworthy. In the previous case,
the energy up to the push-off point follows a smooth curve,
while in this case firings occur rapidly, and are separated
rather than contiguous. This becomes more visible in
Figure 9.
In Figure 9, the discrepancies of the frequency center
and energy above 100 Hz become apparent between the two
cases. Note that in the second case, the maximum frequency
of the peaks rarely exceeds 200 Hz, and each wave packet
shows short and pronounced time durations. In Figure 6, the
peaks often exceed 200 Hz, and are longer in duration in the
lower-frequency bands.
After developing the metric definition for small cases, it
is desirable to develop this information for a large number
of cases. It is difficult to examine all cases visually, due
to the number of individual time-frequency distributions
9
400
400
350
350
350
300
300
300
250
200
150
100
250
200
150
100
50
50
0
0
0.05
0.15
0.25
0.35
Time (s)
0.45
Frequency (Hz)
400
Frequency (Hz)
Frequency (Hz)
EURASIP Journal on Advances in Signal Processing
200
150
100
50
0.1
0.2
(a)
0.3
0.4
Time (s)
0
0.5
400
350
350
300
300
300
200
150
100
250
200
150
100
50
50
0
0
0.2
0.3
0.4
Time (s)
0.5
Frequency (Hz)
400
350
250
0.2
0.3
0.4
Time (s)
0.5
(c)
400
0.1
0.1
(b)
Frequency (Hz)
Frequency (Hz)
250
250
200
150
100
50
0.1
0.2
(d)
0.3
0.4
Time (s)
0
0.5
(e)
0.05
0.15
0.25
0.35
Time (s)
0.45
(f)
Figure 6: Individual muscle activation time-frequency visualizations of (a) S1 , (b) S2 , (c) S3 , (d) S4 , (e) S5 , and (f) S6 from 001 walk 4.
Real part
Linear scale
1
0.5
0
−0.5
Frequency (Hz)
(b)
1500
1000
500
400
350
300
250
200
150
100
50
0
0.05 0.1 0.15 0.2 0.25 0.3 0.35 0.4 0.45 0.5 0.55
Time (s)
(a)
(c)
Figure 7: The (a) power spectral density, (b) time-domain waveform, (c) time-frequency visualization (d) energy peak of subject 001 walk
4 S3 , over a single activation of the gastrocnemius.
performed on a per-footfall basis. The matrix described in
Section 3.3 solves this problem by condensing the dense
amount of information contained in a single time-frequency
analysis into the primary metrics, which differ between
subjects. By focusing only on the differentiating metrics, it
is easy to develop a conclusion.
4.2. Spatiotemporal Discrepancy Matrix and Interpretation.
The SDM developed contains all pertinent information for
each metric as it pertains to each footfall. We compiled
data for all subjects, whose medical report information was
available at time of publication, therefore allowing us to
compare averages across comorbidities. Equation (15) shows
Normalized
voltage
10
EURASIP Journal on Advances in Signal Processing
1 S
1
0
−1
0
S3
S2
0.5
1
1.5
S4
S5
S6
2
2.5
3
S7
3.5
S9
S8
4
S10
the matrix for the maximum frequency point for the case
examined in Section 4.1
5
4.5
Time (s)
⎡
Normalized
voltage
(a)
1
0
−1
S2
S1
S4
S3
S5
S6
S8
S7
S9
S10
SFnh
0
0.5
1
1.5
2
2.5
3
3.5
4
4.5
5
Time (s)
⎢
⎢
⎢ 16.11
⎢
⎢
⎢
= ⎢ 49.32
⎢
⎢
⎢ 14.65
⎢
⎣
60.06
80.08
70.80
54.20
64.94
56.15
15.14
116.70
92.77
62.50
18.55
106.93
43.95
18.55
45.41
17.58
Pressure
location
(b)
20
0
−20
S1
0
S2
0.5
S3
1
1.5
S4
S5
S6
2
2.5
3
S8
S7
3.5
4
S9
4.5
5
(c)
Figure 8: EMG signals of (a) left gastrocnemius (b) right gastrocnemius, and (c) pressure walkway recording, with swing phase
divisions shown in red for hypertensive subject 004 walk 1.
⎢
⎢
⎢
⎢
⎢
⎢
⎢
⎢
SFh = ⎢
⎢
⎢
⎢
⎢
⎢
⎢
⎢
⎣
43.46
11.72
48.34
8.79
58.11
21.48
57.13
11.72
48.34
44.43
23.93
33.20
23.44
37.60
21.48
35.64
52.25
78.18
68.36
19.53
66.41
24.90
38.57
21.48
97.17
⎤
⎥
⎥
66.41 ⎥
⎥
⎥
⎥
, (15)
84.96 ⎥
⎥
⎥
104.49 ⎥
⎥
⎦
81.05
S10
Time (s)
⎡
83.01
45.90
73.73
70.80
78.61
28.32
31.25
24.90
45.41
It is immediately apparent that there are lower values
for the frequency center on average. The mean value of the
pertinent wave packets is 65.66 Hz with a standard deviation
of ±19.9 Hz. When analyzing the matrices, it was determined
that due to the nature of gait, one leg may perform slightly
differently than the other. We therefore examined average
metric values across all walks for the right foot, left foot,
between feet, and as an average of all feet for the cross timefrequency distributions between each footfall, rather than a
single lump sum average. Figure 11 shows these relations for
5 control subjects and 5 hypertensive subjects, with standard
deviations marked.
As discussed in Section 4.1, the frequency centers, as
well as the amount of energy above 100 Hz are measures
used for assessing overall gait health. As is clear from the
table, the nonhypertensive subjects have different values for
the metrics in the intrafoot analyses. In addition, frequency
center is lower for the control subjects, corresponding to
less force in push-off activation. The percent of frequency
The main diagonal (boxed), as discussed in Section 3.3,
contains the value of the frequency center for the autocorrelation wave packets shown in Figure 6. The upper-right
triangle contains the values for the cross time-frequency
analysis performed between two wave packets. Averaging
these values together, we find an average frequency center of
81.32 Hz with a standard deviation of ±19.40 Hz. We then
contrast this information with the second case we examined
38.09
60.06
62.50
66.41
44.92
24.90
62.50
27.83
74.71
83.98
87.89
75.20
64.45
88.38
22.95
31.25
⎤
77.64 24.90
⎥
100.10 62.01 ⎥
⎥
⎥
77.64 52.73 ⎥
⎥
⎥
66.89 100.59 ⎥
⎥
⎥
67.38 77.15 ⎥
⎥
79.10 89.36 ⎥
⎥
⎥
84.47 31.25 ⎥
⎦
19.53 21.97
(16)
content above 100 Hz is also significantly different, again
corresponding to the overall force exacted by the muscle,
and the amount of muscle use. When we look at the overall
standard distribution of the metrics, we see in more detail the
discrepancies between the groups.
4.3. Statistical Analysis of Control Subjects. Upon examination of the control subjects, normalized distribution
characteristics were identified between the subjects, specifically those with no comorbidities, as seen from Figure 11.
Therefore, we endeavored to create normal distributions
based on the metrics of different groups’ footfalls. To create
a normal distribution for control subjects, we identified 10
subjects with no comorbidities or gait dysfunction. We used
the methodology described in Section 3.4 to analyze both sets
of faster-paced walks, and created a set of event metrics for
each subject. For a subject with six footfalls in a single walk,
there are six metrics generated for each of the left foot, right
foot, and cross-foot measures. With two walks per subject,
0.3 0.5
Time (s)
0.7
0.1 0.2 0.3 0.4 0.5
Time (s)
400
350
300
250
200
150
100
50
0
(e)
Frequency (Hz)
Frequency (Hz)
(b)
Frequency (Hz)
Frequency (Hz)
(a)
400
350
300
250
200
150
100
50
0
0.1 0.2 0.3 0.4 0.5
Time (s)
400
350
300
250
200
150
100
50
0
0.1 0.2 0.3 0.4 0.5
Time (s)
400
350
300
250
200
150
100
50
0
(c)
0.1 0.2 0.3 0.4 0.5 0.6
Time (s)
(f)
400
350
300
250
200
150
100
50
0
0.1 0.2 0.3 0.4 0.5
Time (s)
(d)
Frequency (Hz)
0.1
400
350
300
250
200
150
100
50
0
11
Frequency (Hz)
400
350
300
250
200
150
100
50
0
Frequency (Hz)
Frequency (Hz)
EURASIP Journal on Advances in Signal Processing
0.1 0.2 0.3 0.4 0.5
Time (s)
400
350
300
250
200
150
100
50
0
0.1 0.2 0.3 0.4 0.5
Time (s)
(g)
(h)
Figure 9: Previous subject’s time-frequency visualizations for (a) S1 , (b) S2 , (c) S3 , (d) S4 , (e) S5 , (f) S6 , (g) S7 , and (h) S8 , highlighting overall
similarity between distributions.
Real part
Linear scale
0.6
0.4
0.2
0
−0.2
−0.4
Frequency (Hz)
(b)
800
600
400
200
400
350
300
250
200
150
100
50
0
0.05 0.1 0.15 0.2 0.25 0.3 0.35 0.4 0.45 0.5 0.55
Time (s)
(a)
(c)
Figure 10: The (a) power spectral density, (b) time-domain waveform, (c) time-frequency visualization, and (d) energy peak for subject 003
walk four S3 .
when combined, there are 36 individual metric values for
one subject. Our normal metric, therefore, is based on a large
number of sampled data, two walks from each of ten subjects.
This normalized curve serves as a reference to which we
can compare the recorded cases with significantly degenerated gait. Figure 12 shows the standard distribution of ten
control cases, with no comorbidities, and several subjects
whose metrics lie well outside the standard distribution.
These graphs are organized across the four metrics, and are
based on the left foot, right foot, cross-foot, and combinations (all) of each cross time-frequency pair given by each set
of footfalls. Because the time-bandwidth (a) and frequencybandwidth (b) are both found in a similar manner, they
are presented first, followed by the frequency center (c) and
percent over 100 Hz (d). The size of population is relatively
small in this pilot study, but we assumed normal distribution
for a convenience of confidence level determination. With
the calculated mean and standard deviation of the controlled
12
EURASIP Journal on Advances in Signal Processing
30
20
10
0
60
50
40
30
20
10
Right foot
50
40
30
20
10
70
25
20
15
10
5
10
0
34 59 60 62 63 2 3 19 23 5
Patient number
All foot
Frequency center (Hz)
20
60
50
40
30
20
10
50
45
40
35
30
25
20
15
10
5
0
110
100
90
80
70
60
50
40
30
20
10
0
34 59 60 62 63 2 3 19 23 51
Patient number
All foot
34 59 60 62 63 2 3 19 23 51
Patient number
30
20
10
34 59 60 62 63 2 3 19 23 51
Patient number
Right foot
50
45
40
35
30
25
20
15
10
5
0
34 59 60 62 63 2 3 19 23 51
Patient number
Cross foot
70
110
100
90
80
70
60
50
40
30
20
10
0
All foot
Cross foot
60
50
40
30
20
10
0
34 59 60 62 63 2 3 19 23 51
Patient number
Frequency center (Hz)
Frequency bandwidth (Hz)
30
40
34 59 60 62 63 2 3 19 23 51
Patient number
Cross foot
40
50
0
0
50
60
Right foot
30
60
Frequency b andwidth (Hz)
Time bandwidth (ms)
Time bandwidth (ms)
Cross
All
20
34 59 60 62 63 2 3 19 23 51
Patient number
Cross foot
34 59 60 62 63 2 3 19 23 51
Patient number
40
80
34 59 60 62 63 2 3 19 23 51
Patient number
50
45
40
35
30
25
20
15
10
5
0
60
35
0
0
45
40
35
30
25
20
15
10
5
0
80
Left foot
70
34 59 60 62 63 2 3 19 23 51
Patient number
Frequency center (Hz)
60
100
Right foot
Frequency bandwidth (Hz)
Time bandwidth (ms)
Right
70
120
34 59 60 62 63 2 3 19 23 51
Patient number
80
80
0
0
34 59 60 62 63 2 3 19 23 51
Patient number
Left foot
Percent over 100 Hz (%)
40
140
Percent over 100 Hz (%)
50
Left foot
Percent over 100 Hz (%)
(d)
Percent over 100 Hz (%)
70
Frequency center (Hz)
(c)
70
Percent over 100 Hz (%)
Left foot
Frequency bandwidth (Hz)
Time bandwidth (ms)
Left
60
Frequency bandwidth (Hz)
(b)
Frequency center (Hz)
Time bandwidth (ms)
(a)
34 59 60 62 63 2 3 19 23 51
Patient number
All foot
60
50
40
30
20
10
0
34 59 60 62 63 2 3 19 23 51
Patient number
34 59 60 62 63 2 3 19 23 51
Patient number
Figure 11: Means of cross-foot SDM for (a) time bandwidth, (b) frequency bandwidth, (c) frequency center, and (d) percent of energy
above 100 Hz; Mean values shown for control subjects are shown in green mean values for hypertensive cases are shown in blue standard
deviations are shown on either side by red lines.
subjects displayed as a Gaussian standard distribution, the
outlying subjects are organized such that they lie in the x-axis
where their mean value occurs (for the respective metric).
The y values of the outlying subjects are arbitrary, and are
organized to allow for legibility of the corresponding subject
numbers. Mean and variance of individual distribution are
provided in each sub-figure in Figure 12.
Upon investigation of the outlying subjects’ medical
histories, we find a large number of comorbidities present
in varying degrees in each of the cases. Several of the medical
conditions of the outlying subjects are listed in notified by
the other measures. It is a notable fact that the frequencyrelated parameters in Figure 12 are obtained by cross timefrequency analysis that captures time-localized cross spectral
characteristics of signals, which is proposed in this paper
Table 2.
The majority of subjects have hypertension, and many
exhibit other comorbidities that exacerbate the symptoms
and complications of hypertension. The standard deviations
of distribution are marked in Figure 12, to show the confidence with which the normal distribution identifies outlying
subjects. One can find that both the time bandwidth and
EURASIP Journal on Advances in Signal Processing
0.2
20
40
60
0
80
5
8
19
51
0.6
57
0.4
0.2
0
0.8
0.6
0
0.6
0.4
0.2
−20
0
20
40
60
−5 0
0.6
0.4
57
6
8
5
0.8
6
0.6
28
31
0.4
53
0
8
19
23
0.4
51
10 20 30 40 50
Mean = 13.1587, variance = 7.7221
0.6
0.4
0
0
20
40
60
80
Mean = 29.4631, variance = 17.966
24
28
31
0
−40 −20
10
20
30
40
50
Mean = 17.3127, variance = 8.8743
8
51
57
2 24
4 26
0.8
0.6
5 28
31 6
8
15
19
21
37
0.4
0.2
51
23
0
0
20
40
−10 0
80
60
10 20 30 40 50 60
Mean = 19.9123 variance = 6.2083
1
2
3
8
19
23
43
0.4
0
5 51
23
1
31
0.6
0
20
0.4
80
23
0.8
0.2
34
6 57
8
0.6
Mean = 24.7927, variance = 13.7444
0.2
4
0.8
0.2
2
3
6
1
51
51
60
40
0.4
0
8
8
0.6
0
0.8
20
0.8
0.2
−10 0 10 20 30 40 50 60 70
1
Mean = 21.952, variance = 9.6528
0.2
23
37
0
0
1
2
3
6
0.6
−20
19
21
0.2
Mean = 20.3143, variance = 10.7894
57
0.2
51
6
10
0.4
0
2
43
3
4
0.6
20 40 60 80 100 120
1
0.2
−20
51
0.8
Mean = 30.3776, variance = 21.684
5 10 15 20 25 30 35 40
1
8
51
−40−20 0
80
51
52
−30 −20 −10 0
80
Normalized (%)
All
Normalized (%)
1
60
31
0.8
Mean = 27.2551, variance = 16.0837
0.8
15
24
1
44
51
23
43
Mean = 11.7188, variance = 6.0182
Normalized (%)
Normalized (%)
Cross
1
0
28
0.4
Mean = 32.5352, variance = 17.2028
0.8
40
20
5
0.2
−10 0 10 20 30 40 50 60 70 80
21
0
0
1
Normalized (%)
Normalized (%)
Right
1
19
0.4
Mean = 16.263, variance = 16.075
Mean = 29.44, variance = 20.6249
0.8
−40 −20
Normalized (%)
0
Normalized (%)
−20
0.6
0.2
Normalized (%)
0
0.4
8
Normalized (%)
0.2
51
0.6
1
2
3
0.8
Normalized (%)
0.4
1
8
23
0.8
Percent over 100 Hz (%)
(d)
51
57
Normalized (%)
0.6
Frequency center (Hz)
(c)
Normalized (%)
1
23
51
0.8
Normalized (%)
Normalized (%)
Left
1
Frequency bandwidth (Hz)
(b)
Normalized (%)
Time bandwidth (ms)
(a)
13
2
4
0.8
51
6
8
0.6
19
0.4
23
24
28
0.2
37
−40 −20
0
20
40
60
80
Mean = 13.6939, variance = 10.7806
−40 −20
0
20
40
60
80
Mean = 25.6828, variance = 16.0195
0
−10 0
10 20 30 40 50
Mean = 19.2794, variance = 8.6686
Figure 12: Cross-foot Gaussian distribution functions based on 10 control cases for (a) time bandwidth, (b) frequency bandwidth, (c)
frequency center, and (d) percent energy above 100 Hz with outlying subjects marked in blue (1σ outside) and red (2σ outside).
frequency bandwidth are less effective in their assessment
of outlying subjects, while the frequency center and percent
above 100 Hz measures have much lower variance in the
control distribution. However, the cas-es identified by both
the time and frequency bandwidths are also identified by
the other measures. It is a notable fact that the frequencyrelated parameters in Figure 12 are obtained by cross timefrequency analysis that captures time-localized cross spectral
characteristics of signals, which is proposed in this paper.
As is apparent in the table, several of the outlying subjects
had multiple comorbidities that jointly affect gait. This
fact corroborates the hypothesis that specific, measurable
quantities can be used to identify certain comorbidities that
affect gait. Identifiable measures of change include a higher
frequency center for hypertensive subjects, more energy
over 100 Hz, larger-frequency bandwidth, and a smaller
time-bandwidth. These findings corroborate the existing
knowledge base, but the trends in this case are entirely
quantifiable due to the use of the cross time-frequency
analysis technique. It should be noted, however, that not
all the hypertensive cases were identified at this time using
the metric, but those cases that were not identified typically
had fewer comorbidities than those identified. This result
can be interpreted such that the proposed methodology is
suited towards identification of severe cases of hypertension
or other comorbidities, rather than strict identification of
14
EURASIP Journal on Advances in Signal Processing
Table 2: List of comorbidities for subjects that lie outside the normal distribution of metrics.
Subject
number
2
4
5
6
8
15
19
21
23
24
26
28
31
37
51
Age Hyper-thyroid Hyper-tension Osteoporosis Arthritis Neuropathy Diabetes Vitamin-D deficient
78
70
81
87
80
87
86
78
93
87
77
75
86
85
81
Yes
Yes
Yes
Yes
Yes
Yes
Yes
Yes
Yes
Yes
Yes
Yes
Yes
Yes
Yes
Yes
Yes
Yes
Yes
Yes
Yes
Yes
Yes
Yes
Yes
Yes
Yes
Yes
hypertension. It is necessary for us to investigate statistical
correlation between hypertension and gait problems in
future. Also, due to the accuracy of the medical records
provided, and a general difficulty in assessing hypertension,
it is unknown which subjects’ hypertension was controlled,
uncontrolled, or otherwise more extreme as compared to
other cases. And although the proposed use of cross timefrequency analysis may be helpful for the identification of
these comorbidities, it is still necessary for a trained clinician
to assist in the diagnosis and assessment of health in clinical
applications. Ultimately, the goal of this methodology is to
assist physicians in the identification of comorbidities, and
then have their presence corroborated by clinical diagnosis.
5. Conclusion
Because certain comorbidities, directly affect gait, analysis
of the electromyographic signals of the muscles responsible
for gait is useful for identifying signs of these comorbidities,
as well as deficiencies in gait patterns. Doctors using
electromyography, however, are subject to error, and most
EMG signals have very dense information packing, making
it difficult to ascertain certain details. This research has
proposed a solution using time-frequency analysis of gaitrelated EMG information that uses four quantitative metrics
to distinguish hypertensive and nonhypertensive cases.
Through careful selection of each wave packet, we
have created an algorithm that can accurately compare
parameters of wave packets on an individual subject basis.
This method relies on the synchronization of footfall data
with collected electromyographic data. This synchronization
makes possible the cadence separation to allow for crosssubject comparison of muscle activations. After separation,
cross time-frequency analyses are performed using a reduced
interference kernel on several cases to determine specific
Yes
Yes
Yes
Yes
Yes
Yes
Yes
Yes
Coronary
artery disease
Yes
Yes
Yes
Yes
Yes
Yes
markers that identified discrepancies between hypertensive
and nonhypertensive subjects. These metrics, obtainable
through the time-frequency analysis of footfall wave packets,
are the time duration of 25% of the peak of the signal, the
frequency at which the peak instantaneous energy occurs,
and the ratio of energy above 100 Hz to the energy of the
wave packet. Using the cross time-frequency analysis, we
can uniquely compare sets of muscle activation wave packets
and determine the weighted value of the interaction between
muscles.
In this paper, we analyzed two cases in detail, substantiating the basis for our metric selection. We then developed
our matrix to compare these individual metrics, and using
this matrix, we compared different subjects to one another.
The resulting differences show that upon analysis and
comparison between control cases and hypertensive cases,
all four metrics identify discrepancies within one standard
deviation. This quantitative analysis of gait degeneration is
unique in its independence from intuitive assessment, as
well as the accuracy of muscle activation selection ensured
by synchronization of gait with EMG acquisition. As work
continues on this ongoing project, we hope to substantiate
our claims by processing and analyzing a greater number
of subjects. We desire to analyze at least 80 subjects,
increasing the efficacy of our results. This paper examined
a very specific set of gastrocnemius activations during only
the stance phase, but recordings exist for three additional
muscles, as well as the opportunity to analyze and categorize
abnormalities in the swing phase for the gastrocnemius
muscle, as well as the other muscles. In this preliminary
study, analysis focused on the gastrocnemius muscle during
the stance phase, but not during the swing phase, leaving
a large portion of information untapped. As the size of
our database increases, we will continue to develop and
identify new methods and metrics by which to identify
those subjects with comorbidities, and while these results are
EURASIP Journal on Advances in Signal Processing
promising, more substantiation is necessary before we begin
investigating reliable clinical application.
Acknowledgments
This paper is sponsored by Palmetto Health and SeniorSMART center. The authors appreciate the cooperation of the
staff for experiments and data collection in the Department
of Geriatrics, Palmetto Health, as well as Still Hopes Retirement Community. The authors would also like to thank Mr.
Daniel Joseph Hood for his artistic work in this paper.
References
[1] P. Kannus, J. Parkkari, S. Koskinen et al., “Fall-induced injuries
and deaths among older adults,” Journal of the American
Medical Association, vol. 281, no. 20, pp. 1895–1899, 1999.
[2] January 2010.
[3] M. C. Hornbrook, V. J. Stevens, D. J. Wingfield, J. F. Hollis,
M. R. Greenlick, and M. G. Ory, “Preventing falls among
community-dwelling older persons: results from a randomized trial,” Gerontologist, vol. 34, no. 1, pp. 16–23, 1994.
[4] A. Bergland and T. B. Wyller, “Risk factors for serious fall
related injury in elderly women living at home,” Injury
Prevention, vol. 10, no. 5, pp. 308–313, 2004.
[5] A. J. Campbell, J. Reinken, B. C. Allan, and G. S. Martinez,
“Falls in old age: a study of frequency and related clinical
factors,” Age and Ageing, vol. 10, no. 4, pp. 264–270, 1981.
[6] M. E. Tinetti, M. Speechley, and S. F. Ginter, “Risk factors for
falls among elderly persons living in the community,” The New
England Journal of Medicine, vol. 319, no. 26, pp. 1701–1707,
1988.
[7] F. Englander, T. J. Hodson, and R. A. Terregrossa, “Economic
dimensions of slip and fall injuries,” Journal of Forensic
Sciences, vol. 41, no. 5, pp. 733–746, 1996.
[8] M. E. Tinetti and C. S. Williams, “The effect of falls and
fall injuries on functioning in community-dwelling older
persons,” Journals of Gerontology, vol. 53, no. 2, pp. M112–
M119, 1998.
[9] J. A. Stevens, P. S. Corso, E. A. Finkelstein, and T. R. Miller,
“The costs of fatal and non-fatal falls among older adults,”
Injury Prevention, vol. 12, no. 5, pp. 290–295, 2006.
[10] J. F. Bean, D. K. Kiely, S. Herman et al., “The relationship
between leg power and physical performance in mobilitylimited older people,” Journal of the American Geriatrics
Society, vol. 50, no. 3, pp. 461–467, 2002.
[11] D. A. Skelton, C. A. Greig, J. M. Davies, and A. Young,
“Strength, power and related functional ability of healthy
people aged 65–89 years,” Age and Ageing, vol. 23, no. 5, pp.
371–377, 1994.
[12] J. M. Hausdorff, T. Herman, R. Baltadjieva, T. Gurevich, and
N. Giladi, “Balance and gait in older adults with systemic
hypertension,” American Journal of Cardiology, vol. 91, no. 5,
pp. 643–645, 2003.
[13] W. J. Williams, “Reduced interference distributions: biological
applications and interpretations,” Proceedings of the IEEE, vol.
84, no. 9, pp. 1264–1280, 1996.
[14] P. Bonato, S. H. Roy, M. Knaflitz, and C. J. De Luca, “Time
frequency parameters of the surface myoelectric signal for
assessing muscle fatigue during cyclic dynamic contractions,”
IEEE Transactions on Biomedical Engineering, vol. 48, no. 7, pp.
745–753, 2001.
15
[15] G. De Michele, S. Sello, M. C. Carboncini, B. Rossi, and
S.-K. Strambi, “Cross-correlation time-frequency analysis
for multiple EMG signals in Parkinson’s disease: a wavelet
approach,” Medical Engineering and Physics, vol. 25, no. 5, pp.
361–369, 2003.
[16] Y.-J. Shin, D. Gobert, S.-H. Sung, E. J. Powers, and J. B.
Park, “Application of cross time-frequency analysis to postural
sway behavior: the effects of aging and visual systems,” IEEE
Transactions on Biomedical Engineering, vol. 52, no. 5, pp. 859–
868, 2005.
[17] R. F. M. Kleissen, M. C. A. Litjens, C. T. M. Baten, J. Harlaar,
A. L. Hof, and G. Zilvold, “Consistency of surface EMG
patterns obtained during gait from three laboratories using
standardised measurement technique,” Gait and Posture, vol.
6, no. 3, pp. 200–209, 1997.
[18] M. Folstein, S. Folstein, and P. McHugh, Mini Mental State
Examination, Psychological Assessment Resources (PAR),
1975.
[19] L. Cohen, Time-Frequency Analaysis, Prentice-Hall, Upper
Saddle River, NJ, USA, 1st edition, 1995.
[20] C. Zheng, S. E. Widmalm, and W. J. Williams, “New timefrequency analyses of EMG and TMJ sound signals,” in Images
of the Twenty-First Century. Proceedings of the 11th Annual
International Conference of the IEEE Engineering in Medicine
and Biology Society, Engineering in Medicine and Biology
Society, pp. 741–742, November 1989.
[21] J. Jeong and W. J. Williams, “Kernel design for reduced interference distributions,” IEEE Transactions on Signal Processing,
vol. 40, no. 2, pp. 402–412, 1992.
[22] Y. J. Shin, E. J. Powers, and W. M. Grady, “On definition of
cross time-frequency distribution function,” in Advanced Signal Processing Algorithims, Architectures, and Implementations,
Proceedings of SPIE, pp. 9–16, San Diego, Calif, USA, July
2000.
[23] S. Karlsson and B. Gerdle, “Mean frequency and signal amplitude of the surface EMG of the quadriceps muscles increase
with increasing torque—a study using the continuous wavelet
transform,” Journal of Electromyography and Kinesiology, vol.
11, no. 2, pp. 131–140, 2001.