Remote Sensing and GIS Technologies for Monitoring and Prediction of Disasters (Environmental Science and Engineering - Environmental Science)
Bạn đang xem bản rút gọn của tài liệu. Xem và tải ngay bản đầy đủ của tài liệu tại đây (17.5 MB, 268 trang )
Environmental Science and Engineering
Subseries: Environmental Science
Series Editors: R. Allan • U. Förstner • W. Salomons
S. Nayak · S. Zlatanova (Eds.)
Remote Sensing and GIS
Technologies for Monitoring
and Prediction of Disasters
123
Editors
Dr. Shailesh Nayak
ISRO Government of India
Ahmedabad-380015
Jodhpur Tekra
India
ISBN: 978-3-540-79258-1
Dr. Sisi Zlatanova
Delft University of Technology
OTB Research Inst. Housing
Urban & Mobility Studies
2600 GA Delft
Netherlands
e-ISBN: 978-3-540-79259-8
Environmental Science and Engineering ISSN: 1863-5520
Library of Congress Control Number: 2008930076
c 2008 Springer-Verlag Berlin Heidelberg
This work is subject to copyright. All rights are reserved, whether the whole or part of the material is
concerned, specifically the rights of translation, reprinting, reuse of illustrations, recitation, broadcasting,
reproduction on microfilm or in any other way, and storage in data banks. Duplication of this publication
or parts thereof is permitted only under the provisions of the German Copyright Law of September 9,
1965, in its current version, and permission for use must always be obtained from Springer. Violations are
liable to prosecution under the German Copyright Law.
The use of general descriptive names, registered names, trademarks, etc. in this publication does not imply,
even in the absence of a specific statement, that such names are exempt from the relevant protective laws
and regulations and therefore free for general use.
Cover Design: Integra Software Services Pvt. Ltd.
Printed on acid-free paper
9 8 7 6 5 4 3 2 1
springer.com
Contents
Contributors ........................................................................................... VII
Introduction................................................................................................ 1
Sisi Zlatanova and Shailesh Nayak
Part 1: Use of Geo-Information technology in large disasters ................. 9
1. Geoinformation-Based Response to the 27 May Indonesia
Earthquake – an Initial Assessment................................................. 11
Norman Kerle and Barandi Widartono
2. The Application of Geo-Technologies after
Hurricane Katrina ............................................................................. 25
Henrike Brecht
3. Application of Remote Sensing for Damage Assessment
of Coastal Ecosystems in India due to the December 2004
Tsunami .............................................................................................. 37
Shailesh Nayak and Anjali Bahuguna
4. Increasing the Use of Geospatial Technologies for
Emergency Response and Disaster Rehabilitation in
Developing Countries ........................................................................ 57
David Stevens
Part 2: Remote Sensing Technology for Disaster Monitoring ................ 73
5. Adopting Multisensor Remote Sensing Datasets and
Coupled Models for Disaster Management ..................................... 75
Gilbert L. Rochon, Dev Niyogi, Alok Chaturvedi,
Rajarathinam Arangarasan, Krishna Madhavan, Larry Biehl,
Joseph Quansah and Souleymane Fall
6. Nearshore Coastal Processes Between Karwar and Bhatal,
Central West Coast of India: Implications for Pollution
Dispersion ......................................................................................... 101
Viswanath S. Hedge, G. Shalini, Shailesh Nayak and
Ajay S. Rajawat
VI
Contents
7. Landslide Hazard Zonation in Darjeeling Himalayas:
a Case Study on Integration of IRS and SRTM Data .................. 121
Mopur Surendranath, Saibal Ghosh, Timir B. Ghoshal and
Narayanaswamy Rajendran
8. Monitoring and Interpretation of Urban Land Subsidence
Using Radar Interferometric Time Series and Multi-Source
GIS Database.................................................................................... 137
Swati Gehlot and Ramon F. Hanssen
9. Extending the Functionality of the Consumer-Grade GPS
for More Efficient GIS and Mapping Applications...................... 149
Robert M. Mikol
Part 3: System Architectures for Access of Geo-Information............... 165
10. Interoperable Access Control for Geo Web Services in
Disaster Management...................................................................... 167
Jan Herrmann
11. Spatial Data Infrastructure for Emergency Response
in Netherlands .................................................................................. 179
Henk Scholten, Steven Fruijter, Arta Dilo and Erik van Borkulo
12. Geocollaboration in Hazard, Risk and Response: Practical
Experience with Real-Time Geocollaboration at Québec
Civil Security.................................................................................... 199
Charles Siegel, Donald Fortin and Yves Gauthier
13. On-line Street Network Analysis for Flood Evacuation
Planning............................................................................................ 219
Darka Mioc, François Anton and Gengsheng Liang
14. Multi-user tangible interfaces for effective decision-making
in disaster management................................................................... 243
Harmen Hofstra, Henk Scholten, Sisi Zlatanova and
Alessandra Scotta
Index ....................................................................................................... 267
About the Editors................................................................................... 271
Contributors
François Anton: Department of Informatics and Mathematical Modelling,
Technical University of Denmark, Lyngby, Denmark,
Rajarathinam Arangarasan: The Raj Organization LLC, Las Vegas,
Nevada, USA,
Anjali Bahuguna: Space Applications Centre (ISRO), Ahmedabad, India,
Larry Biehl: Rosen Center for Advanced Computing, Purdue University;
Purdue Terrestrial Observatory, West Lafayette, Indiana, USA,
Erik van Borkulo: Geodan,
Amsterdam,
The
Nederlands,
Henrike Brecht: LSU Hurricane Center, Louisiana State University, LA,
USA,
Alok Chaturvedi: Purdue University; Purdue Homeland Security Institute, West Lafayette, Indiana, USA,
Arta Dilo: OTB Research Institute for housing, urban and mobility studies,
Delft University of Technology, Delft, The Netherlands,
Souleymane Fall: Earth and Atmospheric Sciences, Purdue Terrestrial
Observatory, West Lafayette, Indiana, USA,
Donald Fortin: Direction des opérations, Ministère de la Sécurité
publique du Québec, St-Jean-sur-Richelieu, Québec, Canada,
Steven Fruijtier: Geodan, Amsterdam, The Netherlands,
Harmen Hofstra: Vrije Universiteit, Amsterdam, The Netherlands,
VIII
Contributors
Yves Gauthier: Laboratoire de télédétection, Institut national de recherche
scientifique - Eau, Terre et Environnement, Québec City, Québec, Canada,
Saibal Ghosh: Geological Survey of India, Salt Lake, Kolkata, India,
Swati Gehlot: Max-Planck Institute of Meteorology, Hamburg Germany,
Timir B. Ghoshal: Geological Survey of India, Salt Lake, Kolkata, India,
Ramon F. Hanssen: Aerospace Engineering, University of Technology,
Delft, The Netherlands,
Viswanath S. Hegde: SDM College of Engineering and Technology,
Dharwad, India,
Jan Herrmann: Department for Geography, Ludwig-MaximiliansUniversität München, Munich, Germany,
Norman Kerle: Department of Earth Systems Analysis, International Institute for Geonformation Science and Earth Observation (ITC), Enschede,
The Netherlands,
Gengsheng Liang: Department of Geodesy and Geomatics Engineering,
University of New Brunswick, Fredericton, Canada,
Krishna Madhavan: Clemson University, Clemson, South Carolina,
USA,
Robert M. Mikol: Geographic Information Network of Alaska, University
of Alaska, AK, USA,
Darka Mioc: Department of Geodesy and Geomatics Engineering, University of New Brunswick, Fredericton, Canada,
Shailesh Nayak, Indian National Council for Ocean Information Services
(INCOIS), Hyderabad, India,
Contributors
IX
Dev Niyogi: Purdue University and Indiana State Climatologist, West
Lafayette, Indiana, USA,
Joseph Quansah:, Department of Agricultural & Biological Engineering
Purdue University,
Ajay S. Rajawat: Space Application Centre, Ahmedabad, India,
Narayanaswamy Rajendran: Geological Survey of India, Op. Karnataka
& Goa, Bangalore, India,
Gilbert L. Rochon: Rosen Center for Advanced Computing, Purdue University; Purdue Terrestrial Observatory, West Lafayette, Indiana, USA,
Henk Scholten: Vrije Universiteit, Amsterdam, The Nederlands,
Alessandra
Scotta: Geodan,
Amsterdam,
The
Netherlands,
Charles Siegel : TGIS Technologies inc., Chelsea, Québec, Canada,
David Stevens: United Nations Office for Outer Space Affairs, Vienna,
Austria,
G. Shalini: Global Academy of Technology, Rajarajeshwari Nagar,
Bangalore, India,
Mopur Surendranath: Geological Survey of India, Bandlaguda, Hyderabad, India,
Barandi Widartono: Cartography and Remote Sensing Department,
Faculty of Geography, Gadjah Mada University, Yogyakarta, Indonesia,
Sisi Zlatanova, OTB Research Institute for housing, urban and mobility
studies, Delft University of Technology, Delft, The Netherlands,
Introduction
Sisi Zlatanova and Shailesh Nayak
Natural and anthropogenesis disasters cause widespread loss of life and
property and therefore it is critical to work on preventing hazards to become
disasters. This can be achieved by improved monitoring of hazards through
development of observation systems, integration of muti-source data and efficient dissemination of knowledge to concerned people. Geo-information
technologies have proven to offer a variety of opportunities to aid management and recovery in the aftermath. Intelligent context-aware technologies
can provide access to needed information, facilitate the interoperability of
emergency services, and provide high-quality care to the public.
Disaster management poses significant challenges for real-time data collection, monitoring, processing, management, discovery, translation, integration, visualisation and communication of information. Challenges to
geo-information technologies are rather extreme due to the heterogeneous
information sources with numerous variations: scale/resolution, dimension
(2D or 3D), type of representation (vector or raster), classification and attributes schemes, temporal aspects (timely delivery, history, predictions of
the future), spatial reference system used, etc.
There is a need to continuously discuss the state of the observing systems and integration of effective monitoring of disasters, development of
predictions systems, integration and analysis of geo-information. Recognising the importance of use of geo-information in disaster management,
several universities (Delft University of Technology, VU University Amsterdam, The Netherlands; University of Waterloo, Canada), international
organisations (ISPRS, UNOOSA, EU, ICA, FIG, OGC) and vendors
(Bentley, Intergraph, Oracle, PCI) have taken the initiative to organise an
annual symposium, which aims at uniting the efforts of researchers, developers, data providers and users from different countries and continents.
The symposium was organised first in Delft, The Netherlands (March,
2005). Three more symposia were organised under the coordination of the
ISPRS WGIV/8: Goa, India (September 2006), Toronto, Canada (2007)
and Harbin, China (August, 2008).
The second symposium concentrated on natural disasters as the general
theme was ‘Remote Sensing and GIS Techniques for Monitoring and Prediction of Disasters’. It was organised by the Indian Society of Remote
Sensing, ISPRS, ISRO, UNOOSA, FIG, EC, AGILE, ICA and Delft University of Technology on 25-26th of September 2006, Goa, India. The twoday symposium has accommodated 60 participants from 12 countries.
2
S. Zlatanova and S. Nayak
From the originally 96 submitted abstracts (from 28 countries), 46 full papers were received. The papers were presented in 6 oral sessions and one
poster session in the first day. The symposium was closed with a panel
session devoted to providing timely geo-information, quality of data, use
of technical expertise after a disaster and involvement of geo-specialist in
efforts to predict and mitigate disasters.
There are practically no doubts about current status of technology in
providing spatial data to end users. Global navigation satellites and Earth
observation satellites have largely demonstrated their flexibility in providing data for a broad range of applications: weather forecasting, vehicle
tracking, disaster alerting, forest fire and flood monitoring, oil spills detection, desertification spread monitoring, crop and forestry damage assessment. Monitoring and management of recent natural disasters have also
benefited from satellite imagery, such as the Indian Ocean tsunami in
2004, floods (Austria, Romania, Switzerland, and Germany in 2005), hurricanes (USA in 2005), forest fires (Portugal, France in 2005), earthquakes
(Pakistan in 2005, Indonesia in 2006), etc.
However, it is recognised that effective utilisation of satellite positioning and remote sensing in disaster monitoring and management requires
research and development in numerous areas: data collection, access and
delivery, information extraction and analysis, management and their integration with other data sources (airborne and terrestrial imagery, GIS data,
etc.) and data standardization. Establishment of Spatial Data Infrastructure
at national and international level would greatly help in supplying these
data when necessary. In this respect legal and organisation agreements
could contribute greatly to the sharing and harmonisation of data.
Quality of data in case of disaster is still a tricky issue. Data with less
quality but supplied in the first hour might be of higher importance in saving lives and reducing damages compared to trusted, high quality data but
after two days. Apparently a balance should be found in searching and
providing data as the general intention should be increased use of accurate,
trusted data.
Charters and international organizations have already launched various
initiatives on the extended utilization of satellite positioning and remote
sensing technologies in disaster monitoring and management. For example, the International Charter is often given as a good example of availability of data and expertise after a disaster, but still the coordination between
the different initiatives at local and international level is considered insufficient. This observation is especially strong for developing countries, although some authorities in developed countries (e.g. USA in the case of
Hurricane Katrina) also fail to react appropriately. Capacity building needs
to be further strengthened and the governments must be the major driving
Introduction
3
factor in this process. Related to this is the role of the geo-specialist in disaster management. Geo-specialist are not directly involved in emergency
response, e.g. training together with first responders or preparing monitoring and mitigation programs, but there is high understating of closer work
with users.
The Second Symposium has clearly revealed regional specifics in disaster management. While the symposium in Europe addressed Spatial Data
Infratsructures and cooperation between different rescue units as major
challenges, the symposium in India discussed mostly availability and processing of data and put emphasis on early warning systems, realizing that
the national SDI for disaster management either do not exist or are at a
very early stage.
The chapters of this book reflect some of the topics mentioned above.
The efforts of many researchers over the past four years to continue research and development in the area of spatial data integration for effective
emergency services and disaster management have also provided guidance
and inspiration for the preparation of this book.
This book consists of 14 chapters organised in three parts. The readings
in this book outline major bottlenecks, demonstrate use of remote sensing
technology, and suggest approaches for sharing and access of information
in various stages of disaster management process.
Part 1: Use of geo-information technology in large disasters.
The first chapter of Kerle and Widarontono elaborate on use of geoinformation during the earthquake on 27 May 2006 in the Yogyakarta area,
Indonesia. The authors provide numerous chronological details on the
work of the different local and national organisations involved and the use
of remote sensing data. This particular disasters is an excellent illustration
of the works completed after the activation of the International Charter
‘Space and Major Disasters’. Thanks to the almost immediate activation of
the Charter, much satellite information could be quickly provided in the
first two days. The authors also address some issues that need further improvement such as prices, availability of high resolution data, etc.
The second chapter is devoted to the lessons learned from the Katrina
hurricane. The author Henrike Brecht has participated in the emergency response activities immediately after the water flooded the city of New Orleans. The personal observations of the author are organised in five groups
of lessons namely management, technology and infrastructure, data, operational (and workflow) and map products. Clearly, many improvements
have been observed in providing and use of geo-information comparing to
4
S. Zlatanova and S. Nayak
any other disaster in USA, but problems still exist. The chapter provides a
very good overview on bottlenecks and failures largely contributing to the
‘what went wrong’ issue. Interestingly, the lessons learned are very similar
to the 9/11 experiences.
The third chapter addresses the damages on the fauna and flora on the
Indian cost after the Tsunami, December 2004. Shailesh Nayak and Anjali
Bahuguna present their elaborated study on the impact on major ecosystems applying high-resolution satellite imagery. As illustrated in the chapter, the applied methodology has helped to estimate the loss and help in the
rehabilitation process. The damage to ecosystem (especially the coral reef
and the mangroves) is critical as it directly affects fishery recourses of
coastal communities.
After the first three chapters on use of remote sensing information for
monitoring and damage assessment, Chapter 4 elaborates on a new initiative for developing countries that have to further ease access and sharing
of satellite data. David Stevens elaborated on the tasks and activities of the
United Nations Platform for Space-based Information for Disaster Management and Emergency Response (UN-SPIDER), established in December 2006 as a program of the United Nations Office for Outer Space Affairs. Through presenting recent major meetings, conferences and
assemblies, and summarizing the most important activities of various organisations, the author motivates the work of the new program.
Part 2: Remote sensing technology for disaster monitoring
The second part of this book consists of five chapters all presenting remote-sensing technologies (satellite imagery, radar technology, Global Positions Systems) applied for various hazards or phases of disaster management process.
Chapter 5 is a collaborative work of eight universities and organisations
and present a broad overview on need of different technology for monitoring of hazards, response to disaster, recovery and mitigation. The authors
discuss availability of remote sensing data (illustrated with useful web
links), provide practical examples from case studies and report software
developments within the participating organisations. Special attention is
given to dynamic integration of data for geo-visualisation in virtual environments and on hand-held. The chapter concludes with thoughts about a
well-recognised need for an appropriate geo-education for disaster managers.
Hedge, Shalini, Nayak and Rajawat present a satellite-image based
methodology for monitoring of pollution in the shore water. According to
Introduction
5
the authors, the pollution dispersion in the near shore water is highly complex and dependent on a number of factors. Ocean Colour Monitor patterns
as well as other satellite data products have helped to successfully trace
sediments dispersion and understand sediment dynamics through the different seasons.
In the following chapter, Surendranath, Saibal Ghosh, Ghosal and Rajendran address mapping of landslides in the Darjeeling Himalayas in East
India. Again, this chapter is an excellent illustration of use of remote sensing data for monitoring of hazards. The authors are confident that some
conventional methods based on aerial photogrammetry and manual inspection can successfully be replaced by high-resolution satellite images. The
chapter present details on the methodology for the derivation of accurate
DEM from topographic maps, IRS pan stereoscopic satellite imagery and
freely available Shuttle Radar Topography Mission elevation data. Their
method is especially suitable for highly rugged hilly areas, which are constantly under the highly dynamic and active erosion processes.
Chapter 8 discusses the potential of Persistent Scattered Interferometry
for detection and monitoring of land subsidence. This technology reveals
high cost effectiveness compare to conventional geodetic techniques. Besides the applicability of radar technology for monitoring of deformations,
this research stresses the need of incorporating supplementary geo- information sources for an improved interpretation. Swati Gehlot and Ramon
Hanssen report very promising results of applying this technology in the
city areas in the Netherlands.
The last chapter in this Part 2 presents an extended procedure for GPS
data collection. The improved procedure makes use of special waypoint
protocol. Robert Mikol discusses the waypoint naming in detail (and the
consequent organisation in a database) and illustrates its applicability for
rapid data collection in case of oil spill. Though the DBMS has been never
used during oil spill and subsequent cleanup, the idea was accepted as successful for data collection under limited financial resources.
Part 3: System architectures for access of geo-information
This part presents different approaches for management, access and sharing of geo-information for disaster management. Though not specifically
concentrated on remote sensing data, the presented systems can easily be
used if remote sensing imagery is available.
Jan Herrman addresses the very important issue of access and sharing of
data through web services. Access control and security (protection of information) are especially important to enforce restricted access to pro-
6
S. Zlatanova and S. Nayak
tected spatial data or to declare views on the relevant data for certain users/roles. The author provides a overview on existing technology and
elaborates on the advantages of Geo OASIS’s eXtensible Access Control
Markup Language (GeoXACML).
Chapter 11 elaborates further on a Spatial Data Infrastructure for disaster management in the Netherlands. The presented system architecture is a
typical example of thin client-server architecture, which should be able to
serve any type of user on the field or in the commando center. The implemented services are context-oriented and follow recent standardization developments toward chaining of generic services. A spatio-temporal model
for management of operational data is one of the few attempts worldwide
to manage emergency operational data in DBMS.
Charles Siegel, Donald Fortin and Yves Gauthier report on their system
for cooperation and collaboration during emergencies. As discussed in the
chapter, real-time contact and making available all the data to all the
participants in an emergency is considered a key component in every
command and control system. The developed system allows live Internet
geo-collaboration, which is in use in civil security operating in the Québec
Ministry of Public Security. The presented case studies come from real
emergency management situations.
Chapter 13 presents yet another approach to access and visualize data
over Internet, this time for flood management. The authors extensively
discuss the decisions taken in development of the client-server architecture, data model for management of flood information, street/road networks and other spatial information. This approach convincingly illustrates
the advantage of storing and managing information in DBMS: integrated
spatial analysis can readily be performed at the server. A light webapplication allows for visualization and inspection of performed analysis.
The last chapter presents a usability study about new type of hardware,
i.e. Multi Tangible Tabletop User Interface, for its applicability in disaster
management. The tangible table does not require use of mouse and keyboard; instead, the user can touch the surface with fingers. As the name
suggests, multiple many users can work simultaneously as the table ‘remembers’ who ‘possesses which objects. The authors suggest that this
technology could be very appropriate at a tactical level in commando centers, where disaster managers have to discuss steps in managing emergency situations.
The chapters in this book are aimed at researchers, practitioners, and
students who apply remote sensing technology in monitoring of hazards
and managing of disasters. The book itself is the result of a collaborative
effort involving 37 researchers located in 8 countries.
Introduction
7
Acknowledgements
The editors express their sincere gratitude to IRSS, India, the RGI-029 project ‘Geographical Data Infrastructure for Disaster Management’, the
Netherlands and Delft University of Technology, the Netherlands for making this book possible.
Previous book volumes in the series of Gi4DM
Zlatanova, S. and J.Li, 2008, Geospatial Information Technology for Emergency
Response, 2008, ISBN 13: 978-0-415-42247-5 (hbk), ISBN 13: 987-0-20392881-3 (ebook), Taylor & Francis Group, London, UK, 381 p. (ISPRS book
series Vol. 6)
Li, Zlatanova, Fabbri, 2007, Geomatics Solutions for Disaster Management, 2007,
ISBN 10 3-540-72106-1 Springer, Berlin, Heidelberg, New York, 444 p.
Van Oosterom, P., S. Zlatanova and E. Fendel, 2005, Geo-information for Disaster
Management, 2005, ISBN 3-540-24988-5, Springer, Berlin, Heidelberg, New
York, 1434 p.
Part 1: Use of Geo-Information technology
in large disasters
1. Geoinformation-Based Response to the 27 May
Indonesia Earthquake – an Initial Assessment
Norman Kerle and Barandi Widartono
Abstract
A devastating earthquake occurred on 27 May 2006 in the Yogyakarta area
in Indonesia. Response activities began immediately, and included extensive ground-based mapping by Indonesian entities, as well as an activation
of the International Charter “Space and Major Disasters”, which led to the
rapid production of image based damage maps and other assistance. The
aim of this paper is to assess the Geoinformation that became available and
was used in the aftermath of the disaster. It shows that some of the map
products, largely because of lack of field data and communication with
forces in the disaster area, were not as effective as they could have been. It
further provides a preliminary quality assessment of those damage maps,
using data from a house-by-house damage assessment. Disaster response
and data processing are still ongoing, and further analysis will be required
to determine how the use of Geoinformatics, and the utility of international
assistance based on Charter products in particular, can be improved.
1.1
Introduction
At 05:54 AM local time on 27 May, 2006, a magnitude 6.3 earthquake
struck eastern Java in Indonesia. With an epicenter approximately 20 km
SSE of Yogyakarta near the densely populated Bantul district, close to
6,000 people died and an estimated 154,000 houses were destroyed. Despite frequent geophysical disasters in Indonesia, the affected area had not
experienced an earthquake of comparable magnitude in over 100 years,
and was thus ill prepared. Simple brick buildings, the principal housing
type in the affected area, could not withstand the motion and readily collapsed. Despite the time of the earthquake, very early in the day on a Saturday, many people were already busy outside their homes, limiting the
loss of life in one of the most densely populated areas Indonesia with
>1,600 people per km2 (BAPPENAS, 2006).
12
N. Kerle and B. Widartono
1.1.1 The earthquake event
The earthquake occurred early on 27 May, at a shallow depth of approximately 10 km, and 20 km SSE of Yogyakarta (USGS, 2006), although epicenter coordinates indicated on various maps, as well as the hypo center
depth, have varied substantially. While only limited damage occurred in
Yogyakarta itself, the district of Bantul to the south suffered most, with
additional substantial damage in the Klaten district to the NE. Preliminary
estimates of damage exceed 3 billion US$, over 50% of which attributed to
housing damage (BAPPENAS, 2006). The earthquake began just weeks
after sustained strong eruptions at Merapi volcano, some 45 km to the
North, prompting speculations of a connection. However, the movement
followed a previously identified NE-SW-trending fault, and, while
Merapi’s activity may have played a role, resulted primarily from the Australian plate subducting beneath the Sunda plate at a rate of 6 cm per year
(USGS, 2006). Figure 1 gives an overview of the affected area and seismic
intensities caused by the earthquake. Note that the epicenter (star) as determined by the USGS is more than 10 km away from the fault line
(hatched line) identified by Indonesian scientists as the source of the earthquake.
1.2. Immediate response activities
The disaster led to the immediate mobilisation of a variety of response activities. An USAID/OFTA team arrived on the same day, followed quickly
by other organisations over the next few days. Within Indonesia, the established disaster management hierarchy was activated, comprising of Bakornas, Satkorlak and Satlak for the national, provincial and district levels, respectively. The latter coordinated the local work, predominantly in the
Bantul and Klaten districts. In addition to these efforts, the Ministry of
Public Works carried out a rapid damage assessment for 300 selected public buildings to assess structural integrity, followed by an extensive houseto-house mapping campaign by the geography department of Gadjah Mada
University (UGM) in Yogyakarta. About 100 staff and students carried out
several ground mapping projects. After an initial survey of the emergency,
a rapid building damage survey was initiated, followed by a more detailed
one. Data entry and processing are still ongoing, and the large amount of
data promises to be valuable in assessing the accuracy and potential limitations of purely image-based damage maps. A preliminary assessment of
the parts of the UNOSAT damage maps is provided below. It is based on
Geoinformation-Based Response to the 27 May Indonesia Earthquake
13
data for one of 8 mapped districts, Imogiri, for which alone over 14,000
houses were individually assessed for damage.
Fig. 1. Map of the disaster area, with seismic intensity zones and the mainly affected districts of Bantul and Klaten, as well as the active fault (hatched line) and
epicenter (star) indicated.
The International Charter was also activated on the day of the earthquake by the German Foreign Ministry, and project management assigned
to the German Space Agency, DLR. Due to favourable satellite positions
and pointability, high resolution satellite data were acquired as early as 28
May, and again on 30 and 31 May, while medium resolution ASTER and
SPOT images were taken on 30 May. In addition, Japans Daichi satellite
passed over the area on 28 May, collecting images with the AVNIR
(VNIR) and PALSAR (radar) sensors. A pre-disaster Ikonos image was
also acquired on 9 May 2006, while 2 Quickbird scenes were taken in July
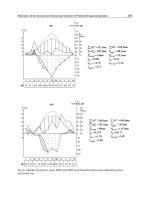
2003, all adding to a substantial array of data. Figure 2 shows the images
and ground data that were obtained, and the damage maps produced.
14
N. Kerle and B. Widartono
Despite the abundance of images, however, there were also problems.
In particular (i) the immediate availability only of lower resolution quicklooks, (ii) distribution by different vendors and organisations at different
prices, (iii) availability of the actual satellite data, as opposed to quick-look
or jpg-images, only to selected users, and (iv) frequent distribution in
smaller tiles led to difficulties. For example, a largely cloud-free Ikonos
image covering much of the affected area was acquired on 28 May and
was available from CRISP in Singapore, the Asian distributor for Ikonos
data. However, LAPAN, the Indonesian mapping agency only received
and distributed parts of it (several tiles missing; Fig. 3), while the DLR
carried out a preliminary damage assessment only on two lower resolution
samples posted on the CRISP site, and later used the cloudier Quickbird
image that covered a smaller area. This was because the CRISP Ikonos images are nearly 3 times the price of Ikonos imagery sold through the European vendor, exceeding the budget made available by RESPOND, the
GMES service element for the use of Geoinformatics for humanitarian assistance (DLR, pers. comm.).
Fig. 2. Overview of high and medium resolution image data acquired before and after the 27 May earthquake. Damage maps based on those images, as well as field mapping carried out, are also indicated.
1.2
Damage Map Products
Image-based damage mapping is constrained by the spatial resolution of the
available data and the average size of the destroyed objects to be mapped.
If those objects are too small to be imaged individually, texture-based
Geoinformation-Based Response to the 27 May Indonesia Earthquake
15
processing is required, by necessity resulting in lower accuracies (Kerle
et al., 2008). Given the nature of the predominantly affected houses –
small and distributed in clusters amidst heavy vegetation – high resolution
data such as Quickbird or at most Ikonos are required. The price for such
high detail, however, is not only high image cost, but also lower coverage.
From Fig. 4 it is clear that, despite the seemingly extensive image database, only limited high resolution coverage of damaged areas was
achieved, further hampered by clouds. Hence the substantial mapping efforts could only produce detailed damage assessment of parts of the area, a
typical reality for such disasters, especially spatially extensive ones in
tropical areas. Additionally, damage mapping as part of a Charter activation is carried out on a best-effort basis, typically without feedback from
the field, constrained by the available or affordable data, as indicated
above, and with very limited time. Therefore, focus on especially affected
areas at the expense of comprehensive coverage is frequent.
Following the 27 May earthquake a large number of map types was
produced by different entities, the majority of them based on field information. Reliefweb (www.reliefweb.int) lists some 50 maps for the earthquake
area, primarily produced by UNOSAT, DLR, IFRC, MapAction, and
OCHA. All of them are of high cartographic standard and optimised for
large-scale printing, and reflect an overall increasing specialisation of different response organisations, each providing assistance according to its
specific expertise and resources, and generating map products related to
specific aspects of the disaster.
Fig. 3. Ikonos scenes of the disaster area acquired on 28 May, available
through CRISP in Singapore (background), and actual scene provided to
LAPAN in Indonesia, all color images reproduced here in grayscale. Star
shows epicenter. For footprint of the smaller image see Fig. 4.
16
N. Kerle and B. Widartono
Fig. 4. Footprints of selected pre- (hatched line) and post-disaster (solid lines) satellite images that covered parts of the affected area.
For Indonesia, only DLR and UNOSAT produced image-based damage
maps, which include (i) overviews, typically annotated with auxiliary information such as coordinate grids, place names, major roads, etc., (ii) preand post- event comparisons with or without further analysis, and (iii)
stand-alone damage maps. Each of those categories can contain further
sub-types (Fig. 5). All high-resolution versions can be found on Reliefweb,
RESPOND (www.respond-int.org), DLR-ZKI (www.zli.dlr.de) and
UNOSAT (www.unosat.org).
Maps created after a disaster are aimed at different purposes. They include simple reference maps that facilitate orientation and navigation,
status-quo maps of different disaster-related aspects such as landslides or
building damage, auxiliary maps showing population densities, utility
lines, ethnic distributions, etc., and maps as a planning basis. Those may
show possible shelter locations, or areas safe for reconstruction. Depending on their information content, the maps are needed by different users
and at different times, and are ideally produced with a specific user group
in mind. Especially maps prepared in the first few days after an event,
however, are typically prepared far away from, and without a direct communication link to, the disaster area. This results in the risk that maps are
Geoinformation-Based Response to the 27 May Indonesia Earthquake
17
prepared without awareness of the specific information needs of, in particular, national response forces in the affected country. Similarly, one of
the limitations of the Charter is limited knowledge within potential beneficiary countries on what the Charter may provide, and when. In Indonesia
this led to a situation where local institutions carried out their own damage
mapping, albeit ground-based but with satellite image support. This was
approached from 2 sides. First, as stated above, a limited assessment of
public buildings was carried out by the Ministry of Public Works, while
UGM organised a more extensive house-by-house mapping campaign that
lasted over one month. In addition, bottom-up reporting worked well,
where representatives from some 1,200 villages reported damage numbers
to district officials, and from there further to the district. This took approximately 2 weeks to be done, longer than the initial image-based maps,
but also resulted in more reliable data.
Fig. 5. Illustration of different image-based map types. A: overview map
based on SPOT5 data with auxiliary data overlaid; B: damage map based
on pre- and post disaster Ikonos data; C: 250m grid damage map based on
Quickbird image; and D: more detailed damage mapping on the same
Quickbird image (source: A-C DLR, D UNOSAT). All maps are originally
on color.
18
N. Kerle and B. Widartono
This is particularly so since only a coarse damage map based on 250m
grid cell was prepared by DLR at first (published on 31 May), while map
results from a more detailed assessment in the area further East that was
located in the highest intensity zone, were only published by UNOSAT
on12 June, the same day as the map based on village reports (prepared by
OCHA, available on Reliefweb).
1.3
The Response Chain and the Weakest Link
Geoinformation has a tremendous potential to facilitate all aspects of disaster management, including response. The general approach is illustrated
in Fig. 6, which shows the main elements of the chain, as well as constraining factors.
Fig. 6. The Geoinformation-based disaster response chain.
To what extent image-based information can aid in an emergency situation depends primarily on the disaster type (Kerle et al., 2008; Zhang and
Kerle, 2008). Suitable sensors are then further constrained by their actual
availability, a function of position and pointing capabilities. Civilian data
acquisition and distribution is still a relatively slow process, hence agreements such as the Charter have been establish to speed up the process. The
acquired data are made available to reference imagery, as well as more
analysis time. The map products thus produced can be highly variable in
quality. SERTIT, for example, when in charge of a Charter activation,