Tom tat luan an tieng anh hệ tư vấn dựa trên phân tích hàm ý thống kế
Bạn đang xem bản rút gọn của tài liệu. Xem và tải ngay bản đầy đủ của tài liệu tại đây (887.22 KB, 28 trang )
MINISTRY EDUCATION AND TRAINING
UNIVERSITY OF DANANG
PHAN QUOC NGHIA
RECOMMENDER SYSTEM BASED ON
STATISTICAL IMPLICATIVE ANALYSIS
Speciality: Computer Science
Code:
62 48 01 01
DOCTORAL THESIS SUMMARY
Danang - 2018
The dissertation is completed at:
UNIVERSITY OF DANANG
Academic Instructors:
1. Associate Professor Huynh Xuan Hiep, PhD.
2. Dang Hoai Phuong, PhD.
Opponent 1:……………………………..……………
Opponent 2:………………...………...………………
Opponent 3:………………...……...…………………
The dissertation will be defended before the Board of thesis
review established by University of Da Nang
At ... ..... hour ......... day ....... month ....... year .......
The dissertation can be found at:
- National Library
- Information and Learning Center, University of Da Nang
1
PREFACE
1. The urgency of the thesis
The information overload problem really became popular
with the rise of the Internet and social networks, the amount of
information that people are approaching is expanding ever more.
Everyday, we are exposed to a multitude of types of
information: email communications, articles in Internet, social
media postings, advertising information from e-commerce sites.
With this huge amount of information, choosing the right
information for the decision-making of computer users and
smart devices users will be increasingly difficult. The
recommender model is considered as solution to support users
to select information effectively and is widely used in many
fields.
Recommender model is a system capable of automatically
analyze, classify, select and provide users with the information,
goods or services that users are interested by application of
statistical techniques and artificial intelligence. In particular,
machine learning algorithms play an important role. In order to
provide the information that users need to support, many
recommender models have been proposed such as Collaborative
filtering recommender models, Content-based recommender
models, Demographic recommender models, Knowledge-based
recommender models, Hybrid recommender models.
However, due to the information explosion on social
networking sites and the spread of products on e-commerce
sites today, the current recommender models have not yet met
the complex requirements of the users. Therefore, the study of
recommender models continue to be interested in such research
both advanced methods and algorithms to improve the accuracy
2
of the current recommender models, research to improve the
systems to adapt for the problem of information explosion and
research to propose new recommender model.
Starting from this practical situation, the topic
"Recommender system based on statistical implicative analysis"
is conducted within the framework of a doctoral dissertation in
computer science with the desire to contribute a part to the
recommender model of research. Specifically, it is a
collaborative filtering recommender model.
2. Objectives, objects and scope of research of the thesis
2.1. Research objectives
The objective of the thesis is to propose collaborative
filtering recommender models that apply the proposed measures
from the statistical implicative analysis method, tendency of
variation in statistical implications, and association rules.
2.2. Research objects
The objective interestingness measures, statistical
implicative analysis method, recommender models.
2.3. Research scopes
Focus on Statistical implication analysis method, Tendency
of variation in statistical implications, Association rules, and
Recommender models.
3. Research methods
Analysis and synthesis of theory combined with experiment.
4. Thesis structure
Preface
Chapter 1: An overview.
Chapter 2: Classification objective interestingness measures
based on statistical implication parameters.
Chapter 3: Recommender model based on Implication index.
3
Chapter 4: Collaborative filtering recommender model based
on Implication intensity.
Chapter 5: Collaborative filtering recommender model based
on statistical implicative similarity measures.
Appendix
5. Contribution of the thesis
- Propose a new method for classification objective
interestingness measures based on statistical implication
parameters.
- Propose recommender model based on Implication index.
- Propose a collaborative filtering recommender model
based on Implication intensity.
- Propose a collaborative filtering recommender model
based on statistical implicative similarity measures.
- Develop empirical toolkit (ARQAT) on the R language.
CHAPTER 1: AN OVERVIEW
The main content of this chapter studies an overview of
objective interestingness measures, statistical implicative
analysis method, tendency of variation in statistical implications,
and recommender models. Research on the proposed
recommender models and analysis of advantages and
disadvantages of each model. On the basis of these studies,
clearly define the research content of the thesis.
1.1. Statistical implicative analysis
Statistical implicative analysis is the method of data analysis
studying implicative relationships between variables or data
attributes, allowing detecting the asymmetrical rules a → b in
the form "if a then that almost b" or "consider to what extent
4
that b will meet implication of a". The purpose of this method is
to detect trends in a set of attributes (variables) by using
statistical implication measures.
Figure 1.1. The model represents statistical implication
analysis method
Let E be a set of n objects or individuals described by a
finite set of binary variables (property). A (
) is a subset of
objects that meet the property a; B (
) is a subset of objects
that meet the property b; ̅ (resp. ̅ ) is the complement of A
(resp. B);
is the number of elements of set A;
is the number of elements of set B; and the
̅ ) is the number of
counter-examples ( ̅
objects that satisfy the attribute a but does not satisfy the
property b. Let X and Y be two random sets with the number
and
respectively.
For a certain process of sampling, the random variable
̅ follows the Poisson distribution with the
̅
parameter
.
The rule
threshold
is said to be admissible for a given
if
̅
̅
Let us consider the case where
Poisson random variable
random as:
(1.2)
̅
. In this case, the
̅ can be standardized
5
̅
̅
(1.3)
√
In experimental realization, the observed value
̅ is defined by:
̅ of
̅
̅
(1.4)
√
This value measures a deviation between the contingency
and expected value when a and b are independent.
When the approximation is justified (e.g. > 4) the
̅ is approximatively N(0,1)-distributed.
random variable
The implication intensity
of the rule
is defined
by:
{
(
̅
̅ )
∫
(1.5)
̅
This measures is used to determine the unlikehood of the
counter-example
̅
in the set
. The implication intensity
is admissible for a given threshold
if
.
1.2. Tendency of variation in statistical implications
The tendency of variation in statistical implications is a
research directions to examine the stability of the implication
intensity to observe small variations of measures in the
surrounding space of parameters
. To clarify the
tendency of variation in statistical implications, we examine the
implication index measures under 4 parameters
with formula defined (1.4).
6
To observe the variation of q from the variability of the
parameters
, Let us consider the parameters
as real numbers which satisfy the following
inequalities:
và
(1.6)
In this case, q can be considered as a continuous
differentiable function:
̅
̅
(1.7)
The
s a function has 4 parameters. To
observe the variation of q according to the parameters we
calculated the partial derivative for each parameter. In fact, this
variation is estimated rising of the function q with variation
according to the variation of q corresponding components
. Therefore, we have the formula:
̅
̅
Let us take the partial derivatives of q under
(1.8)
̅
we have the
following formula:
̅
√
(1.12)
Equation 1.12 shows that if the
tends to increase, then
the q tends to increase.
1.3. Recommender models
1.3.1. The basic concepts
1.3.2. Content-based recommender models
1.3.3. Collaborative filtering recommender models
1.3.4. Demographic recommender models
1.3.5. Knowledge-based recommender models
1.3.6. Recommender based on association rule models
7
1.3.7. Recommender model based on statistical implicative
analysis
1.3.8. Hybrid recommender models
1.4. Evaluating recommender models
1.4.1. Method for developing evaluation data
1.4.2. Method for Evaluating the recommender models
1.5. Application of recommender models
1.6. Development trends of recommender models
1.7. Conclusion Chapter 1
The contribution of this chapter studies objective
interestingness measures, statistical implicative analysis method.
Study recommender models, analyze advantages and
disadvantages of each model. This is the basis for determining
the research contents of the thesis.
CHAPTER 2: CLASSIFICATION OBJECTIVE
INTERESTINGNESS MEASURES BASED ON
STATISTICAL IMPLICATION PARAMETERS
The main content of this chapter presents objective
interestingness measures, methods of classifying objective
interestingness measures, and proposing a method for
classifying measures based on an asymmetric approach using
statistical implication parameters.
The research results of this chapter have been published in
works (3), (4) in the published list by author.
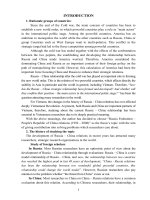
2.1. An objective interestingness measures
An objective interestingness measures is the measurement of
knowledge patterns based on the distribution of data. Assume
that we have a finite set of transactions, with each transaction
8
contained in item set I. An association rule
where A and
B are two disjoint sets of items (
) where a are
attributes of the objects of the set A, b are attributes of the
objects of the set B. Item set A (resp. B) is associated with a
{
}
subset of transactions with
̅
̅
(resp.
), item set (resp. ) is associated with a
̅
subset of transactions with
̅
̅ ). The rule can be described
{
} (resp. ̅
| |
by four cardinalities
where
̅
̅
| |
| |
|
|. The interestingness value of an
̅
association rule based on an objective interestingness measures
will then be calculated by using the cardinality of a rule
̅ .
n
𝑛𝐵
T
A
B
𝑛𝐴𝐵̅
𝑛𝐴𝐵
𝑛𝐴̅𝐵
𝑛𝐴
Figure 2.1. The cardinality of an association rule
2.2. Classify the objective interestingness measures
2.2.1. Classification based on examining of measures
properties
2.2.2. Classification based on measures of behavior
2.3. Classifying objective interestingness measures based on
statistical implication parameters
9
2.3.1. The principles define the variance of the measure based
on the partial derivative
The principles used to investigate the objective
interestingness measures based on the partial derivative value
according to 4 parameters:
- If the partial derivative values of corresponding parameter
is positive, the property of measures in the corresponding
parameter is labeled as 1.
- If the partial derivative values of corresponding parameter
is negative, the property of measures in the corresponding
parameter is labeled as -1.
- If the partial derivative values of corresponding parameter
is zero, the property of measures in the corresponding parameter
is labeled as 0.
2.3.2. The rules for classification measures based on the
variable attribute of measures
Measures are classified according to the following rules:
- If the value of the partial survey has label 1, then put it in
the class of measures vary increasing with the corresponding
parameter;
- If the value of the partial survey has label -1, then put it in
the class of measures vary decreasing with the corresponding
parameter;
- If the value of the partial survey has label 0, then put it in
the class of measures is independent on corresponding
parameter;
- If the value of the partial survey has label more than one
value (1, 0, -1), then put it in the other class.
10
2.4. Classification results of asymmetric objective
interestingness measures
2.4.1. Classification result of measures based on partial
derivative under the parameter n
2.4.2. Classification result of measures based on partial
derivative under the parameter
2.4.3. Classification result of measures based on partial
derivative under the parameter
2.4.4. Classification result of measures based on partial
derivative under the parameter
2.5. Comparison and evaluation of classification results by
statistical implication parameters
- Class of measures independent of the parameter n by the
classification method based on tendency of variation in
statistical implications fall in the class of measures have
descriptive property by the classification method based on
properties of measures.
- The majority of measures have asymmetric properties
increase with the parameter
and decrease with the parameter
when calculating the value based on the association rules.
- The class measures has statistical property is always
increasing or decreasing with statistical implication parameters.
2.6. Conclusion chapter 2
The main contribution of this chapter is to propose new
method for classifying objective interestingness measures based
on statistical implication parameters. Then apply this method to
conduct classification 39 asymmetric objective interestingness
measures. This result can help users choose the appropriate
measures for the collaborative filtering recommender model.
11
CHAPTER 3: RECOMMENDER MODEL BASED ON
IMPLICATION INDEX
The main content of this chapter proposed recommender
model based on asymmetric approach using association rules,
Implication index, and partial derivatives under statistical
implication parameters. This model is particularly interested in
the relationship between the condition attributes and decision
attributes on the same object to give the recommendation results
for users.
The research results of this chapter have been published in
works (1), (2) in the published list by author.
3.1. An association rules based on decision attributes
3.1.1. Definition of association rule based on decision attributes
Let
{
} is a set of n users, where each user
is stored as a transaction, U is considered the transaction
database;
{
} is the set of m
{
attributes of each user, where
condition attributes,
{
} is the set of
} is the set of decision
attributes.
An association rule based on decision attributes generated
from the transaction database U is an implicative expression of
the form: a → b, with
,
,| |
| |
.
3.1.2. Algorithm for generating association rule based on
decision attributes
Input: User transaction dataset ( ).
Output: Set of association rules for recommender models.
Begin
Step 1: Scan transaction database (U) to determine Support of each
candidate 1-itemset, compare candidate Support with min_sup to find
frequent 1-itemset ( ).
12
Step 2: Use
join
to generate a candidate set of candidate
k-itemset. Prune not frequent itemsets to determine candidate kitemset.
Step 3: Scan transaction database (U) to determine Support of each
candidate k-itemset, compare candidate Support with min_sup to find
frequent k-itemset ( ).
Step 4: Repeat from step 2 until the candidate set is empty.
Step 5: For each frequent itemset I, generate all nonempty s
subsets of I.
Step 6: For every nonempty subset s of l, generate the rules:
{
}
{
|
}.
End.
3.2. Statistical implication parameters of association rules
3.2.1. Statistical implication parameters
3.2.2. Statistical implication parameters based on binary matrix
3.3. Calculate Implication index and partial derivatives
based on statistical implication parameters
3.4. Recommender model based on Implication index
3.4.1. Definition of recommender model based on Implication
index
The recommender model based on Implication index is
defined as follows:
Where:
{
{
each user, where
attributes,
{
{
} is a set of n users;
} is the set of m attributes of
{
} is the set of condition
} is the set of decision attributes;
} is the association rule set for the model;
13
are computational functions for finding
{
} which have valuable
association rules
recommendation for user
based on Implication index and
partial derivative under statistical implication parameters.
3.4.2. Recommendation algorithm based on Implication index
Input: - Transaction dataset;
- Value set of condition attributes ( ) of the user ;
Output: The association rule set supports for users to choice the value of
the decision attributes;
Begin
Step 1: Generate association rules based on decision attributes from
transaction dataset.
Step 2: Determine the value of statistical implication parameters for
association rule set:
For each association rule based on decision attributes of rule set do
<Determine value of parameter >;
<Determine value of parameter >;
<Determine value of parameter >;
<Determine value of parameter ̅ >;
Step 3: Calculate value of Implication index and partial derivatives based on
statistical implication parameters:
For each association rule based on decision attributes in RU set do
<Calculate value of Implication index of rule >;
<Calculate value of partial derivatives on parameter n of rule >;
<Calculate value of partial derivatives on parameter of rule >;
<Calculate value of partial derivatives on parameter of rule >;
<Calculate value of partial derivatives on parameter ̅ of rule >;
Step 4: Choose a recommendation rule set for the user :
For each association rule based on decision attributes in RU set do
if (<Value attributes left side of rule > < Value set of >) then
and value of partial derivatives on statistical implication parameters>;
14
highest partial derivative value to recommend user >;
End.
3.5. Experiment
3.5.1. Experimental data
The model has been tested on two datasets: Lenses dataset of
UCI and admissions dataset of Tra Vinh University (DVT-Data).
3.5.2. Evaluate the model's accuracy on standard dataset
Table 3.17. The recommendation result with the condition
attributes {i1 = 1, i2 = 2, i3 = 2, i4 = 1}
From the recommendation results in Table 3.17, the users
can consider value of decision attributes to make a final
decision to use contact lenses or not.
3.5.3. Evaluate the model's accuracy on real dataset
The model has 8 results that contain the course code
registered by the candidate over 10 tests. In particular, most
recommendation results are based on rules related to the scores
of subjects in the examination. This is a characteristic quite
suited to the actual requirements of admission consultants.
3.6. Conclusion chapter 3
The contribution of this chapter is to propose recommender
model based on Implication index and association rules. The
difference of this model is based on the value of the condition
attributes to calculate the values of the decision attributes on the
same object.
15
CHAPTER 4. COLLABORATIVE FILTERING
RECOMMENDER MODEL BASED ON IMPLICATION
INTENSTY
This chapter proposes a new model for collaborative
filtering recommender model based on asymmetric approach.
The model uses association rules and Implication intensity. In
particular, the model using association rules with high
surprisingness generated based on rating matrix and Implication
intensity.
The research results of this chapter have been published in
work (12) in the published list by author.
4.1. Association rules based on Implication intensity
4.1.1. Definition of association rules based on Implication
intensity
{
Let
} is a set of n users;
{
is a set of m items;
column represents an item
for item ;
a set of items rated by
}
} is a rating matrix of n users for m
items with each row representing a user
value of user
{
(
(
); each
);
is the rating
is a set of items rated by
, and
,
is
.
The association rule based on Implication intensity is
defined as:
where
and
and is accepted with threshold α (
where
;
) if
is defined in formula (1.5).
4.1.2. Algorithm for generating association rule based on
Implication intensity
Input: Training dataset and the threshold value of Implication intensity;
Output: the association rule set based on Implication intensity;
Begin
Step 1: Generate a candidate set from 1-itemset to k-itemset
16
<Generate a candidate set 1-itemset from training dataset >;
<Generate a candidate set 2-itemset from candidate set 1itemset>;
<Generate a candidate set k-itemset from candidate set k1-itemset >;
Step 2: Generate nonempty subsets of candidate set
For each candidate set I do
<Generate nonempty subsets s of I >;
Step 3: Generate association rule with threshold value of Implication
intensity
For each nonempty subsets s of I do
If (value of Implication intensity of rule r threshold ) then
<Select association rule r for recommender model>;
End.
4.2. The collaborative filtering recommender model based
on Implication intensity
4.2.1. Definition of recommender model based on Implication
intensity
{
} is a set of n users;
Suppose that
{
} is a set of m items;
{ } is a
training dataset, with
is the rating value of user for item
;
is the rating value
{ } is a testing dataset, with
{
}
of user for item ;
is a set of association
rules generated from training dataset based on Implication
intensity;
is
{ } is logical matrix, with
logical value between rule and user , if user has ratings
for items of the left side of rule
then
,
otherwise
;
{
} is a set
of association rules selected for user . The recommendation
results for user
is a set of items belong to right side of
that user
has not rated
{
}.
17
4.2.2. Recommendation algorithm based on Implication
intensity
Input: - Set of association rules generated from training dataset;
- Testing dataset;
Output: Recommendation results for each user in the testing dataset;
Begin
Step 1: Create a logical matrix based on association rule set and testing
dataset
t = <The number of association rules>;
l = <The number of users in testing dataset>;
{
}
{
};
{ }, với
For each association rule in RU do
For each user in testing dataset do
Otherwise
Step 2: Select association rules to recommend for each user
For each user in testing dataset do
For each association rule selected do
If (
) then
<Select association rule on row i for user on column j>;
Step 3: Select items to recommend for each user
For each user in testing dataset do
<Sort descending rule set based on Implication intensity values >;
intensity value that user j has not rated to recommend for user j>;
End.
18
4.2.3. Evaluate model accuracy
4.3. Experiment
4.3.1. Experimental data
The experiment is performed on two different datasets: real
rating dataset (MovieLens) and binary rating dataset (MSWeb).
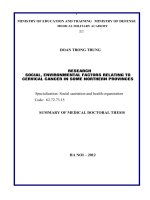
4.3.2. Compare the model's accuracy on binary rating dataset
and real rating dataset
The accuracy of model is based on three metrics Precision,
Recall and Fmeasure (Figure 4.2) shows the recommendation
results on binary rating dataset higher precision than the
recommendation results on real rating dataset.
Figure 4.2. The diagram shows the pattern with high
precision on binary rating dataset
4.3.3. Compare the accuracy of the model with other
collaborative recommender models
The accuracy of the proposed model is compared to the
accuracy of the collaborative filtering recommender models:
User-based
collaborative
filtering
(UBCF),
Item-based
collaborative filtering (IBCF) and Collaborative filtering
recommender based on association rules (AR). Kết quả so sánh
19
được trình bày trong hình 4.3. The comparison results are
presented in Figure 4.3.
Figure 4.3. Compare the accuracy of the recommender
models
This
result
shows
that
the
collaborative
filtering
recommender model based on Implication intensity is highly
accurate on two empirical datasets. In particular, on binary
rating dataset (MSWeb), the model has far more precision than
the other models.
4.4. Conclusion Chapter 4
The contribution of this chapter is to propose collaborative
filtering recommender model based on Implication intensity.
Experiment the model on two standard datasets and compare
the evaluation results with other effective collaborative filtering
recommender models. The experimental results show that using
of asymmetric association rules based on statistical implication
analysis method can increase the accuracy of the collaborative
filtering recommender model.
20
CHAPTER 5: COLLABORATIVE FILTERING
RECOMMENDER MODEL BASED ON STATISTICAL
IMPLICATIVE SIMILARITY MEASURES
This chapter presents steps to develop a similarity measures
based on the asymmetric approach for the user-based
collaborative filtering recommender model. The similarity
measures between the two users is based on association rules
and Implication intensity.
The research results of this chapter have been published in
works (7), (8) in the published list by author.
5.1. Similarity measures based on Implication intensity
5.1.1. The statistical implicative similarity measures between
two users
The statistical implicative similarity value between two users
,
is determined by the following formula:
∑
Of which:
-
: is similarity value between two users
;
: is implication intensity value of association rule ;
- : is the number of association rule set that generated from
rating dataset of two users
.
5.1.2. Algorithm to measure statistical implicative similarity
value between two users
Input: Rating dataset for items of two users
;
Output: Similarity value between two users
;
Begin
Step 1: Generate association rules from user's rating matrix
Step 2: Select association rules for two users
< Select items are rated by user : >;
21
<Select items are not rated by user : ̅ >;
̅ và
with
;
>;
Step 3: Define the parameters
̅ for selected rules
For each selected rule in selected association rule set do
Step 4: Calculate implication intensity value for selected set of
association rules
For each selected rule in selected association rule set do
<Calculate implication intensity value>;
Step 5: Calculate similarity value between two users
(
)
<Calculate mean of implication intensity values of rule set: ̅>;
̅ >;
End.
5.2. Collaborative filtering recommender model based on
statistical implicative similarity measures
5.2.1. Definition of recommender model based on statistical
implicative similarity measures
The collaborative filtering recommender model based on
statistical implicative similarity measures is defined as follows:
Of which:
{
} is a set n users in system;
{
} is a set m items in system;
is
rating
matrix of users for items,
is
{ }
rating value of user for item ;
is a function to find out the items
that need to recommend for user
(with
{
}).
22
5.2.2. Recommendation algorithm based on on statistical
implicative similarity measures
Input: - User set U; Item set I, Rating matrix R;
- User need recommendation result ;
{
};
Output: Recommendation items for user
Begin
Step 1: Determine the list of k users who are similar to user
For each user
do
and
by statistical
>;
<Sort descending user list by similarity values>;
>;
Step 2: Calculate the predicted rating value for items
̂
, with
is similarity value between user
∑
and user
;
is rating value of user
for item >;
Step 3: Select recommendation items for user
<Sort descending item list by predicted rating values>;
user
>;
End.
5.3. Experiment
5.3.1. Experimental data
The experiment is performed on two datasets: the
MovieLense dataset and the MSWeb dataset.
4.3.2. Evaluate the model on real rating dataset
Table 5.4.1Present comparison error parameters of two
models
Model using statistical
implicative similarity measures
Model using similarity Pearson
measures
RMSE
MSE
MAE
0.8961562
0.8030960
0.7077939
0.9796664
0.9597462
0.7704055
23
Table 5.4 shows that values of error parameters (RMSE,
MSE, MAE) of the model are lower than the model using
similarity Pearson measures.
4.3.3. Evaluate the model on binary rating dataset
The results of the model was compared with the model using
Jaccard by drawing the ROC diagram for Precision and Recall
ratios in figure 5.8. The diagram shows that the value of
Precision and Recall ratios on a model using statistical
implicative similarity measures are higher than the value of
Precision and Recall ratios on a model using Jaccard measures.
Figure 5.8.1ROC diagram for Precision and Recall ratios of
two models
4.4. Conclusion chapter 5
The contribution of this chapter presents steps for
developing a new similarity measures for User-based
collaborative filtering recommender model. The similarity
measure between two users is based on association rules and
Implication intensity. It calls statistical implicative similarity
measures.