Multidimensional poverty in mekong river delta
Bạn đang xem bản rút gọn của tài liệu. Xem và tải ngay bản đầy đủ của tài liệu tại đây (1.43 MB, 73 trang )
UNIVERSITY OF ECONOMICS HOCHIMINH CITY
VIETNAM –NETHERLANDS PROGRAMME FOR M.A IN
DEVELOPMENT ECONOMICS
MULTIDIMENSIONAL POVERTY IN
MEKONG RIVER DELTA
By
NGUYEN THI LAN ANH
Ho Chi Minh, April 2014
UNIVERSITY OF ECONOMICS
INSTITUTE OF SOCIAL STUDIES
HO CHI MINH CITY
THE HAGUE
VIETNAM
THE NETHERLANDS
VIETNAM - NETHERLANDS PROGRAMME
FOR M.A. IN DEVELOPMENT ECONOMICS
MULTIDIMENSIONAL POVERTY IN
MEKONG RIVER DELTA
A thesis
submitted in partial fulfillment of the requirements for the degree of
Master of Arts in Development Economics
By
NGUYEN THI LAN ANH
Academic supervisor
Dr. NGUYEN HUU DUNG
Ho Chi Minh City, April, 2014
DECLARATION
I declare that "Multidimensional poverty in Mekong River Delta” is my own work; it has not been
submitted to any degree at other universities.
I confirm that I have made by effort and applied all knowledge for finishing this thesis in the best
way.
Ho Chi Minh City, April 2014
NGUYEN THI LAN ANH
i
ACKNOWLEDGEMENTS
First of all, I would like to express our deepest gratitude to my supervisor, Dr. Nguyen Huu Dung
for his invaluable comments, suggestions and engagement through the learning process of the
thesis. I would also like to thank Dr Pham Khanh Nam for helpful remarks on my TRD. Then I am
much obliged to Dr.Tran Tien Khai and Dr. Truong Dang Thuy for their enthusiasm which has
encouraged me a lot to complete my dissertation.
I would also like to thank my Research Methodology module lecturer Dr. Luca Tasciotti and
Assoc. Prof. Dr. Nguyen Trong Hoai who provided me with the background knowledge of
research implementation.
It is no doubt that I am deeply indebted to my family members for all the kind understanding and
spiritual support. Finally, I would like to dedicate my concluding words to all class-mate who
involved in this study.
ii
ABSTRACT
The study provides a critical review of poverty measurement in Mekong River Delta and
arguments for utilizing a recent multi-dimensional methodology framework. By applying Alkire &
Foster’s methodology for Vietnamese Households Living Standards Survey data 2010 (VHLSS
2010), it produces a multidimensional poverty estimation of Mekong River Delta at the aggregate
level, provincial level and identify the biggest contributors to multidimensional poverty. Twelve
indicators corresponding to four dimensions are considered for estimation. The study also works
out how policy-makers can prioritize the budget spending among provinces and within each
province based on decomposable property of adjusted headcount ratio. Lastly, the study
investigates the effectiveness of using uni-dimension, per capita consumption, in poverty
measurement and reaching a conclusion that consumption alone cannot capture deprivation
experienced by the poor households.
Key words: Multidimensional poverty measurement, Deprivation, Alkire & Foster Methodology,
Mekong River Delta.
iii
TABLE OF CONTENTS
DECLARATION.............................................................................................................................. i
ACKNOWLEDGEMENTS ........................................................................................................... ii
ABSTRACT .................................................................................................................................... iii
TABLE OF CONTENTS .............................................................................................................. iv
LIST OF TABLES ...................................................................................................................... vii
LIST OF FIGURES .................................................................................................................... vii
ACRONYMS ............................................................................................................................. viii
Chapter 1 INTRODUCTION ........................................................................................................1
1.1.
Problem statement ..............................................................................................................1
1.2.
Research objectives ............................................................................................................2
1.3.
Research questions .............................................................................................................2
1.4.
Research hypothesis ...........................................................................................................2
1.5.
Justification of the study ....................................................................................................3
1.6.
Organization of the research study ....................................................................................3
Chapter 2 LITERATURE REVIEW ............................................................................................4
2.1.
Key concepts of multidimensional poverty .......................................................................4
2.1.1. Poverty ...........................................................................................................................4
2.1.2. Poverty line ....................................................................................................................5
2.2.
Economic theories of poverty ............................................................................................7
2.3.
Approaches to poverty measurement .................................................................................8
2.3.1. Monetary approach ........................................................................................................8
2.3.2. Non-monetary approach.................................................................................................8
iv
2.4.
Reviews of empirical studies ...........................................................................................10
2.5.
Chapter summary .............................................................................................................14
2.5.1. Empirical literature summary ......................................................................................14
2.5.2. Problems and limitations of previous studies ..............................................................17
2.5.3. Conceptual framework .................................................................................................18
Chapter 3 METHODOLOGY .....................................................................................................19
3.1.
An overview of poverty in Vietnam and Mekong River Delta ........................................19
3.2.
Data ..................................................................................................................................20
3.3.
Methodology ....................................................................................................................20
3.3.1. Frequently used indicators of poverty measurement ...................................................21
3.3.2. Multidimensional poverty index of Alkire and Foster .................................................22
3.4.
3.3.2.1.
Methodology ........................................................................................................22
3.3.2.2.
Choice of dimensions, indicators and deprivation cut off ...................................23
3.3.2.3.
Application of Weights ........................................................................................31
Treatment of non-applicable population and missing data ..............................................33
3.4.1. Treatment of non-applicable population ......................................................................33
3.4.2. Treatment of missing data ............................................................................................33
3.5.
Analytical framework ......................................................................................................34
3.6.
Chapter summary .............................................................................................................34
Chapter 4 RESULTS ....................................................................................................................36
4.1.
Indicator deprivation ........................................................................................................36
4.2.
“Across dimension” cut-off and MPI estimation .............................................................39
4.3.
Poverty estimates at provincial level ...............................................................................40
4.4.
Which indicator contributes the most to MPI? ................................................................44
4.5.
Decomposition of adjusted headcount ratio and Policy implications ..............................45
4.6.
Comparison between Consumption poverty and Multidimensional poverty ..................50
v
4.6.1. Income poverty verses Multi-dimesional poverty .......................................................50
4.6.2. Correspondence of consumption poverty and multidimensional poverty ...................51
4.6.3. Correlation between Consumption and Multidimensional poverty .............................51
4.7.
Chapter summary .............................................................................................................51
Chapter 5 CONCLUSION ...........................................................................................................52
5.1.
Conclusion .......................................................................................................................52
5.2.
Limitation and further researches ....................................................................................53
APPENDIX .....................................................................................................................................55
REFERENCES ...............................................................................................................................55
vi
LIST OF TABLES
Table 2.1: GSO – WB poverty lines .................................................................................................. 6
Table 2.2 MOLISA poverty lines ...................................................................................................... 7
Table 2.3:Summary of empirical studies relating to multidimensional poverty .............................. 14
Table 3.1: Households surveyed in each province........................................................................... 20
Table 3.2: Dimensions, Indicators and cutoffs ................................................................................ 30
Table 3.3: Weights assigned to dimensions and indicators ............................................................. 32
Table 4.1: Multidimensional poverty estimate on various cut off point .......................................... 40
Table 4.2: Poverty estimates at provincial level .............................................................................. 42
Table 4.3: Spearman correlation between Mo ranks by different k values ..................................... 46
Table 4.4: Decomposing of adjusted headcount ratio by indicator ................................................. 49
Table 4.5: Comparing monetary poor and multidimensional poor at aggregate level..................... 51
Table 4.6: Spearman coefficient between indicators ....................................................................... 50
LIST OF FIGURES
Figure 2.1: Dimensions and indicators of the MPI ( by Alkire and Foster, 2010) ......................... 10
Figure 2.2: Dimensions and indicators of the MPI (by Cuong Nguyen, 2012) ............................... 12
Figure 2.3: Ten dimensions with 16 indicators representative for four livelihood assets (by Khai
Tran & Danh Nguyen, 2012) ........................................................................................................... 13
Figure 2.4 Conceptual framework ................................................................................................... 18
Figure 3.1: Analytical framework .................................................................................................... 34
Figure 4.1: Comparison percentage of households deprived in each indicator ............................... 37
Figure 4.2: Proportion of households deprived in each indicators .................................................. 38
Figure 4.3: Proportion of household deprived in various numbers of indicators ............................ 38
Figure 4.4: Contribution by province of each dimension to MPI .................................................... 44
Figure 4.5: Contribution to MPI by indicators at aggregate level ................................................... 45
Figure 4.6: MPI compare to consumption poverty by provincial level ........................................... 50
vii
ACRONYMS
GSO
General Statistics Office
HHP
Household Prestige index
HDI
Human Development Index
MDG
Millennium Development Goal
MPI
Multidimensional Poverty Index
VHLSS
Vietnam Household Living Standard Survey
MRD
Mekong River Delta
MOLISA
Ministry of Labor, Invalids and Social Affairs
viii
Chapter 1
INTRODUCTION
1.1.
Problem statement
Our life is better but poverty is still knocking at the door, from the world’s wealthiest nations to
the poorest. According to Human Development report (March 2012), nearly a haft the world, or
about three billion, are still living on less than 2USD a day; 1.1 billion people in developing
countries with inadequate access to water; 800 million people in the world suffer from hunger and
malnutrition; among 2.2 billion children, close to haft of children live in poverty, 15 million
children die each year from hunger, 1.4 children die every year from lack of access to safe
drinking water and adequate sanitary. These unexpected deprivations have severely existed in
many countries over centuries. Facing with this situation, an issue of how to define the poor has
been increasingly concerned by economists during the past decades.
Conventionally, poverty is defined and measured in money term but poverty definitely goes far
beyond the monetary deprivation. During recent decades, poverty has been described as a
multidimensional phenomenon due to the fact that people may suffer deprivation in many other
aspects of life rather than income. For that reason, many alternative approaches to measuring and
conceptualizing poverty have been explored to reflect its nature, such as Household prestige score
HHP (Rossi, 1974), Human Development Index HDI (UNDP, 1990), the Human Poverty Index
(UN, 1997), household asset index (Filmer and Prichett, 1998, Booysen et al 2007)…. Such
approaches encompassed almost aspects of human life like asset ownership, health, education,
security, living standard etc. Remarkably, multidimensional poverty index developed by Sabina
Alkire and James Foster in 2010 which covers deprivation in various social-economic aspects of
human being is widely accepted and internationally used during recent years.
Keeping in view international as well as national demand of addressing the poverty through
multiple dimensions of deprivation, this paper chooses Mekong River Delta to study poverty in
wider and deeper sense through various dimensions. The study aims at mapping and measuring of
multidimensional poverty in rural areas of Mekong River Delta by estimating incidence and depth
of poverty across provinces through multidimensional poverty index (MPI) developed by Alkire
and Foster in 2010. Based on research findings of these, some policy implications will be
1
discussed and suggested to alleviate efficiently poverty in each province from the
multidimensional perspectives.
1.2.
Research objectives
i. To measure the state of multidimensional poverty by provinces in rural of Mekong River
Delta.
ii. To find out which deprivation contribute the most to overall poverty and provincial
poverty.
iii. To compare between monetary poor and multidimensional poor indexes
iv. To propose some necessary/appropriate interventions for alleviating poverty.
1.3.
Research questions
i. How width and depth of multidimensional poverty in Mekong River Delta?
ii. Which deprivation contributes the most to multidimensional poverty at aggregated level
and provincial level among rural areas of the Mekong River Delta?
iii. How difference can be between consumption poor and multidimensional poor indexes?
iv. Can consumption alone measure poverty experienced by households?
1.4.
Research hypothesis
i. Multidimensional poverty is severe in Mekong River Delta
ii. Deprivation in per capita consumption, sanitation, cultivated land and housing quality
contributes the most to rural multidimensional poverty.
iii. The poverty rate is much higher in multidimensional poverty than consumption poverty.
iv. Consumption alone cannot measure poverty experienced by households.
2
1.5.
Justification of the study
Given the absence of research on rural poverty in multidimensional sense in Vietnam, this type of
research is necessary. The study tries to discover the state of multidimensional poverty in rural of
Mekong River Delta by using Alkire and Foster methodology and find out which indicator
impacts the most to overall MPI. Result of study is informative and useful for rural policy maker
in determining scope and aspects which need to be addressed to alleviate poverty and, on that
basis, they propose some recommendations on investigation or relief to improve rural living
standards in Mekong River Delta.
1.6.
Organization of the research study
The rest of this study is organized as follows. Chapter two introduces some key concepts of
multidimensional poverty, some economic theories, a review of literature and relevant research
associated with multidimensional poverty. In addition to a review of literature, chapter two also
presents the conceptual framework and builds on an analytical framework to capture multi aspects
of poverty. Chapter three elaborates on the data and methodology for multidimensional poverty
measurement. Chapter four reflects data analysis and result presentation. Chapter five concludes
with research’s discussion, recommendation for practice and direction for further researches.
3
Chapter 2
LITERATURE REVIEW
This chapter begins by describing some key concepts of poverty which have been developed over
time. Economic theories of poverty are then highlighted (section 2) and brief overview of
approaches to measure poverty in Mekong River Delta is provided (section 3). Some empirical
studies are then presented (section 4). The conceptual framework for multidimensional deprivation
is defined (section 5) and analytical framework to construct multidimensional poverty index is
outlined (section 6).
2.1.
Key concepts of multidimensional poverty
2.1.1. Poverty
For poverty, two of the most typical definitions accepted world-wide are from United Nations and
the World Bank. The United Nations measures poverty by various attributes that contribute to
human well-being. The United Nations states that:
“Fundamentally, poverty is a denial of choices and opportunities, a violation of human dignity. It
means lack of basic capacity to participate effectively in society. It means not having enough to
feed and cloth a family, not having a school or clinic to go to; not having the land on which to
grow one’s food or a job to earn one’s living, not having access to credit. It means insecurity,
powerlessness and exclusion of individuals, households and communities. It means susceptibility
to violence, and it often implies living on marginal or fragile environments, without access to
clean water or sanitation“(United Nations, 1998)
Similarly, another multi-dimensional poverty definition which is widely used is the one from
World Bank:
”Poverty is pronounced deprivation in well-being, and comprises many dimensions. It includes
low incomes and the inability to acquire the basic goods and services necessary for survival with
dignity. Poverty also encompasses low levels of health and education, poor access to clean water
and sanitation, inadequate physical security, lack of voice, and insufficient capacity and
opportunity to better one’s life.” (World Bank, 2000).
4
Besides, in the paper in 2009, Alkire and Foster defined multidimensional poverty as:
“A multidimensional poor person who is if and only if having both 16 economically deprived and
socially deprived. A person is economically deprived if the person’s income falls below the
income cutoff as a shortfall in the space of income (consumption, wealth). A person is socially
deprived if any social achievement falls below its respective cutoff. It focuses on the social
dimensions pertaining to health, education, and social protection, and is based on the assumption
that each social dimension is intrinsically important, and that an attainment below the respective
cutoff represents a denial of a basic human right” (Alkire and Foster, 2009).
Based on the above concepts, there are two types of poverty. Absolute poverty is the state where
an individual found lacking sufficient resources to meet the basic needs like food, shelters,
cloths….Relative poverty refers to the situation of population living under an average level of
society.
2.1.2. Poverty line
The poverty lines, or poverty thresholds, are the cut-off points where individuals below are
regarded as the poor. There are two main kinds of poverty lines:
Relative poverty line is set by putting one income in relation to the rest of population. This
establishes poverty lines in terms of a percentage mean or median of income.
Absolute poverty line is established base on equivalent amount of money needed for survival.
Literature review shows two methods to define absolute poverty line: The food energy intake
(Gree and Thorbecke 1986; Paul, 1989) and the cost of basic needs method (Ravallion, 1994).
Under the former, poverty line is determined by finding the level of consumption or income at
which food energy intake satisfies normal nutrient requirement. The latter defines poverty line by
computing the cost of good basket that typically consumed by any individual to meet the
requirement. Different from food intake method, the cost basic method adds to this cost a specific
allowance of non food items and hence commonly used rather than food energy intake method.
5
In Vietnam, there are two approaches to measurement of poverty line: International poverty line
measurement approach and National Poverty lines measurement approach (considered as the
official poverty line).
The first approach is based on international standards, in which poverty line was calculated by the
General Statistic Office (GSO) with technical assistance from World Bank. This poverty line was
built for 2 periods 1993-2008 and 2010-later. In the first period, poverty line was determined by
equivalent money of acquiring food for sufficient nutrient standard of 2.100 calories per person
per a day adding the cost of necessary non-food items like shelters, clothes, etc. People whose
expenditure fall below this minimum level are considered poor. In the second period, poverty line
was calculated by the cost of basic food for 2.230 calories per person per day plus cost of essential
non food items. In each period, this approach produces only one poverty line for both rural and
urban. This poverty line then has been kept constant over time in real purchasing power. Table
below will present the changes of poverty line over the time:
Table 2.1: GSO – WB poverty lines
Year
1993
1998
2000
2004
2006
2008
2010
Poverty line
97
149
160
173
213
280
653
The second approach, developed by Ministry of Labor, Invalid and Social Affairs (MOLISA) is
based on the growth rate of economy, the financial resources reserved for poverty reduction. Then,
the welfare indicator is expressed by per capita income adjusted for the regional differences in
terms of number of kilogram of rice which is equal to 15kg, 20kg and 25 kg of rice per person per
day for mountainous countryside and islands, the delta countryside and midlands and the urban
areas respectively. The poverty line was built in the first year of five year period, depicted in table
2.2:
6
Table 2.2 MOLISA poverty lines
Poverty line
1996-1997
1998-2000
2001-2005
2006-2010
2011-2015
Urban
70
80
150
260
500
Rural
50
70
100
200
400
55
80
200(*)
400 (*)
Mountain
(*) There has been no separated poverty line for rural areas and mountain areas since 2006. The
poverty line of mountain areas falls under rural areas.
2.2.
Economic theories of poverty
There are conflict economic theories of Poverty. However, they all share the notion that poverty is
an economic status which one cannot satisfy basic needs for subsistence. These theories “can be
simplistically lumped into two groups: theories that focus on individualistic behaviors and theories
that focus on social structures” (Sherraden, 1991 p. 35).
The individualistic theories of poverty (Schultz, 1963; Becker, 1964) state that what constitutes
poverty are found in attributes inherently existing in individual characteristics as well as in the
personal abilities of the poor themselves. The explanation is that each individual is a rational being
who has totally power to act for maximizing their own interest. Hence, determinants of poverty lie
in their behaviors upon making choice/decision. Those who fail to make the right
choices/decisions and those who cannot compete with others become poor.
Structural or situational theories of poverty (Doeringer & Piore, 1971; North, 1990; Sherraden
1991; Burton, 1992; Rank, 1994; etc.), on the other hand, asserted that causes of poverty are found
“not in the characteristics of the poor themselves, but in the structural elements of the larger
society” (Burton, 1992, p.149). The explanation follows that each individual behavior is
influenced by external factors, not his/her own characteristics. Those with better social economic
status/relations have dominant choices while those who have lower social economic/relation
usually do not have opportunities to make the right choices. Due to this inequality, the rich will
become richer and the poor always remains poor regardless of their hard work or their dominant
values. In other words, it is the failure of structure of society which causes poverty.
7
2.3.
Approaches to poverty measurement
There are two main approaches on the theoretical ground: the monetary approach and the non
monetary approach.
2.3.1. Monetary approach
The monetary approach which is also called uni-dimensional approach has been pioneered by
Rowntree (1901, 1941). He carried out a survey of living conditions of poor families in York,
England in 1899 and drew a poverty line in terms of a minimum weekly sum of money which
enables families to secure the common necessities of a healthy life. This minimum sum of money,
called a “bare subsistence” covered light and fuel, food, clothing, rent and personal items…He did
it again in 1936 and used a “relative” concept of poverty line “what human needs are for a
minimum necessary for a healthy life”. Adjust for the movement of price, he wanted to address
whether the poverty in York (England) had been decreased or increased over more than 30 years.
This approach has been widely used by economics because it is relatively easy to calculate
numerically and easily apply policy-based. However, it remains many practical problems even
though it is well-known; for example, the basis of recall data, difficulties of converting products
into money terms and the seasonality of information. Above all, it does not explain enough the
multiple aspects passing household living conditions.
2.3.2. Non-monetary approach
Contrary to the monetary approach which makes a linkage between poverty and expenditure, the
non-monetary approach considers poverty from the point of view of multiple deprivations. Over
its long history, many indicators have been applied to measure poverty. This paper only presents
three of them.
Household asset index of Filmer and Pritchett (1999, 2001) are based on asset ownership and
housing characteristics to measure household’s well-being. They used data from India and applied
principle component analysis for constructing asset index to explore the impacts of household
wealth on educational enrollment across states in India. Filmer and Prichett illustrated that
classification household based on asset indicators are very close to expenditure-base yet more
accuracy and validity. Different from money-metric measure, asset index are based on data
8
collected from interview through inspection checklist, on that account, the accuracy and validity of
the asset data are better than that of income-based or expenditure-based. They also suggested:
“using assets as instruments for household per capita expenditures is most likely the more
effective way of extracting the maximum amount of information from the data while reducing the
impact of measurement error” and by economic evidences, they convince that “asset index, as a
proxy of economic status for use in predicting enrollments, is at least as reliable as conventionally
measured consumption”. (Filmer and Prichette 2001).
Following Filmer and Prichett study, in the year 2008, Booysen et al. assessed trends in poverty in
seven African countries over time (1986 – 1992) and across countries using asset index
constructed from nationally data of demographic and health survey (DHS). However, difference
from Filmer and Prichett study, Booysen et al. employ multiple correspondence analysis (MCA)
which works better for category variables, rather than principle component analysis (PCA) to
derive the weight of each asset indicator. For inter-country comparability, Booysen et al. used two
conventional poverty lines suggested by World Bank, the 40th percentile and 60th percentile
together with one absolute poverty line. The absolute poverty line is derived by using weighted
sum of assets which represent an adequate condition for subsistence. All the three poverty lines are
constructed from aggregate data for the purpose of comparability. They also claim that asset index
is not relatively volatile as income or expenditure yet slow-moving due to the slow rate of change.
Human poverty index (HPI) developed by the United Nations (UN) in 1997 is another well-known
poverty indicator. It focuses on deprivation of the most basic dimensions of poverty: Survival,
knowledge and standard of living. HPI is derived separately for developing countries (HPI-1) and
developed countries (HPI-2) to reflect differences in socio-economic features. In spite of
concentrating on a wider set of attributes than income, HPI have not covered totally the multiple
aspects of deprivation which human being may suffer.
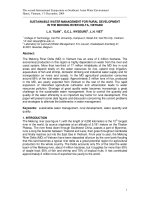
Multidimensional Poverty Index of Alkire and Foster is an international measure of acute poverty
that replaces for HPI during recent years. The MPI exhibits a different pattern of poverty than
income poverty as it takes into account not only material standards of living but also all attributes
which affect household living conditions. Alkire and Foster (2010) proposed that MPI combines
two aspects of poverty: Incidence (H) - the percentage of people who are poor or the headcount
9
ratio and intensity of people’s poverty (A) or the average percentage of dimensions in which the
poor are deprived. Three dimensions are included in the study: health, education, and standard of
living. These three dimensions are measured by ten indicators. Each dimension is equally
weighted as well as each indicator in each dimension, briefly represented as below diagram:
Figure 2.1: Dimensions and indicators of the multidimensional poverty index
(By Alkire and Foster, 2010)
Alkire and Foster claim that there are two main approaches to identify the poor. “Union” approach
defines those who deprive at least one dimension as the poor. The other main approach is
“intersection” method which states that someone is poor if he or she deprives in all dimensions.
2.4.
Reviews of empirical studies
Many studies on multidimensional poverty have been conducted for all countries in the world,
especially for developing countries. Each of them has different approach.
Concerning household asset index, in the paper in 2006, Prakongsai used data from two household
surveys data, the Socio-economic Survey (SES) and the Health and Welfare survey (HWS), to
construct asset index to measure poverty in Thailand over the period 1998, 2000, and 2002. He
used a range of 28 to 30 variables (including: Washing machine, Telephone, Video recorder,
Refrigerator, Electrical cooking pot, Mobile phone, Bed, Air conditioner, Iron, Water boiler, Sofa
in living room, Electrical iron, Gas cooking stove, Water boiler, Toilet, Bicycle, Light bulb…)
which exhibit housing characteristics, ownership of durable and semi-durable assets and, types of
household sanitation and water supply. Principle Principal Component Analysis (PCA) which was
presented by Filmer and Prichett in 2001 was used to derive household asset index for each
household. By comparing between poor household of the first decile determined by household
10
asset index and the first decile classified by the national poverty line, he found that the correlation
between the poor classified by using the asset index and household income/expenditure in 2002 is
only 0.23 and 0.28 respectively. This comparison is based on the assumption that household of the
first decile determined by household asset index is classified as the poor due to household below
the national poverty line of Thailand in 2002 account for 9.8%. Meanwhile, Pearson Correlation
shows that household classified by asset index is correlated with household classified by
expenditure/income at over 50%.
Maria Emma Santos and Karma Ura applied Alkire and Foster methodology to estimate
multidimensional poverty in Bhutan using 2007 Bhutan Living Standard Survey. Poverty are
reflected in 5 dimensions in both urban and rural areas: income, education, room availability,
access to electricity and access to safe drinking water, and poverty in rural are exclusively
reflected in two additional dimensions: access to road and land ownership. Two weighting
structures are used: one using equal weighting structures and one using weights identified through
Gross National Happiness Survey (GNHS). The study found that poverty is fundamentally a rural
phenomenon. In rural areas, when equal weights are used, deprivation in electricity, room
availability, education and income are the ones with the highest share in overall deprivation,
followed by access to road, land ownership and water respectively. In counterpart, when weights
obtained from GNHS, income and education have higher share to overall poverty relative to
access to electricity and room availability due to they are assigned higher weights.
In the paper of Asselin and Vu (2009, p.124), multidimensional poverty index is applied for
analyzing dynamic poverty in Vietnam during the period 1993-2002, using Vietnam living
standard survey (VLSS) data. In this paper, five dimensions are presented, including education,
water/sanitation, health, employment and housing. Eight indicators covered are underemployment,
chronic sickness; adult illiteracy; under-schooling and; without radio, TV, type of dwelling; and
drinking water sanitation. A composite indicator of poverty (CIP) on each household was built
base on the weight derived for each indicator using multiple correspondence analysis (MCA)
technique. Then, CIP absolute poverty line defined as “the average of the poverty thresholds
specific to the primary indicators” (Asselin 2009, p.142) in view of the union-poverty concept is
computed; thus, MPI indices are constructed. Keeping the weights and CIP absolute poverty line
unchanged over studied period, multidimensional poverty can be compared to consumption
11
poverty; and also, analysis of poverty trends over the period 1992–2002 was carried out. The
findings show that poverty has declined significantly during the 1993-1998 period, which match
well with consumption poverty. Among seven regions, Red River Delta obtained most dramatic
reduction; conversely, the Mekong River Delta shows the lowest improvement.
Cuong Nguyen (2010) constructed multidimensional poverty index to estimate multidimensional
poverty in five central cities in Vietnam: Hanoi, Haiphong, Danang, Hochiminh and Cantho using
Vietnamese household standard living survey 2008. In this research, the authors takes into account
five main dimensions including education, health, living standard, economic well-being, and
employment labor. These dimensions are measured by fifteen indicators (figure 2.2). Equal
weights are applied within dimension and across dimensions. What he obtained was
multidimensional poverty is significantly high in five central cites, especially in Hochiminh city
and the poor intensively suffer from deprivation of under-employment, types of dwelling, working
time and housing space.
Figure 2.2: Dimensions and indicators of the multidimensional poverty index
(by Cuong Nguyen, 2012)
Be Lam (2012) constructed multidimensional poverty index to estimate multidimensional poverty
in Mekong River Delta using Vietnamese household standard living survey 2008. In this research,
ten indicators pertaining to three dimension health, education and living standards were selected.
The study also applied equal weighting system for multidimensional poverty estimation. The
result showed that MRD emerged as the poorest region among 8 regions (Red River Delta, North
Eastern, North Western, North Central, South Central, Central Highland, South Eastern and
MeKong River Delta) in terms of MPI although it ranked third in monetary poverty, after South
12
Eastern and Red River Delta. His study also concluded that poverty is much severe in
multidimensional sense than monetary poverty.
Different from the above studies, Khai Tran & Danh Nguyen (2012) did not construct any index
for measuring poverty, they instead oriented to investigating interrelations between monetary
poverty and other rural households’ socioeconomic in Vietnam through livelihood assets approach
and selecting appropriate indicators for measuring multidimensional poverty. Data of rural
households extracted from VHLSS 2008 data set was employed. They began with twenty three
socioeconomic indicators which divided into four categories of livelihood assets: human, natural,
physical and financial assets. The result of Principle component analysis and multiple
correspondence analysis methods allow to selecting 16 indicators related to four livelihood assets
for further analysis. Cluster analysis then will be explored for measuring multidimensional
poverty. The result exhibits some important findings which give remarkable contribution to
multidimensional poverty research in Vietnamese rural households. The first finding is there must
be remarkable differences between monetary poverty and multidimensional poverty and
expenditure per capital has lowest impact on poverty in multidimensional perspective. Each
dimension and indicator has different contribution level to overall poverty is the second finding.
The third finding is physical asset has impressive contribution to multidimensional poverty.
Finally, difference in variable importance suggests that weight assigned to each dimension is very
important, but how is still an open question.
Figure 2.3: Ten dimensions with 16 indicators representative for four livelihood assets
(by Khai Tran and Danh Nguyen, 2012)
Livelihood asset
(1) Human asset
Dimension
Human resource for
agriculture
Health status
Job diversification ability
(2) Natural asset
Land resource
Relevant indicators
Total number of household labours
Household size
Average day of treatment of a household
member
Number of sickness day
Number of household member working
non-farm
Number of household member working for
others
Total agricultural cultivated area
13
Livelihood asset
(3) Physical asset
Dimension
Housing condition
(4) Financial asset
Housing facilities
Ordinary consumption
goods
Additional income
2.5.
Relevant indicators
House value; Housing area; Type of house
Type of toilet; Water source; Electric
source
Motorbike; Mobile phone
Remittance received within year
Chapter summary
2.5.1. Empirical literature summary
The following table summarizes the common used dimensions and indicators as well as indexes
and methodologies applied for investigating multi aspects of poverty. Although these studies are
different by approaches, they all focus on the basic subsistence needs of human being.
Table 2.3: Summary of empirical studies relating to multidimensional poverty
No
Author
Dimensions &
Indicators
Methodology
Data set
Results
- Decile compare:
30 variables
Correlation between the
which exhibit
poor classified by asset
housing
characteristics,
ownership of
1
Prakongsai, durable and
2006
semi-durable
assets and,
types of
index and household
Household
income/expenditure in
asset index
Thailand,
2002 is only 0.23 and
with Principle
1998,2000,
0.28 respectively
components
2002
- Pearson Correlation:
analysis
household classified by
household
asset index is correlated
sanitation and
with household classified
water supply
by expenditure/income at
over 50%
14
No
Author
Dimensions &
Indicators
Methodology
Data set
Results
- Poverty is
2
5 dimensions
fundamentally a rural
are considered
phenomenon.
both urban and
- In rural areas, when
rural areas:
equal weights are used,
income,
deprivation in electricity,
education, room
room availability,
availability,
education and income are
Maria
access to
Emma
electricity and
Santos and
access to safe
2007 Bhutan
MPI
Karma Ura, drinking water,
2008
Living
Standard
Survey data
in rural the
the ones with the highest
share in overall
deprivation. In
counterpart, when
weights obtained from
study
GNHS, income and
considered two
education have higher
additional
share to overall poverty
dimensions:
relative to access to
access to road
electricity and room
and land
availability due to they
ownership
are assigned higher
weights.
- Poverty has declined
five dimensions
are presented,
3
Asselin and including
Vu, 2009 education,
MPI, multiple
correspondenc
e analysis
significantly during the
Vietnam,
1993-1998 period for
1993-2002
both multidimensional
water/sanitation
and consumption poverty
, health,
concepts.
15