The effect of cash flow sensitivity on enterprises cash holdings evidence from vietnam
Bạn đang xem bản rút gọn của tài liệu. Xem và tải ngay bản đầy đủ của tài liệu tại đây (1.38 MB, 78 trang )
UNIVERSITY OF ECONOMICS
HO CHI MINH CITY
VIETNAM
ERASMUS UNVERSITY ROTTERDAM
INSTITUTE OF SOCIAL STUDIES
THE NETHERLANDS
VIETNAM – THE NETHERLANDS
PROGRAMME FOR M.A IN DEVELOPMENT ECONOMICS
THE EFFECT OF CASH FLOW SENSITIVITY
ON ENTERPRISES’ CASH HOLDINGS:
EVIDENCE FROM VIETNAM
BY
LE KHA TU
MASTER OF ARTS IN DEVELOPMENT ECONOMICS
HO CHI MINH CITY, December 2017
UNIVERSITY OF ECONOMICS
HO CHI MINH CITY
VIETNAM
INSTITUTE OF SOCIAL STUDIES
THE HAGUE
THE NETHERLANDS
VIETNAM - NETHERLANDS
PROGRAMME FOR M.A IN DEVELOPMENT ECONOMICS
THE EFFECT OF CASH FLOW SENSITIVITY
ON ENTERPRISES’ CASH HOLDINGS:
EVIDENCE FROM VIETNAM
A thesis submitted in partial fulfilment of the requirements for the degree of
MASTER OF ARTS IN DEVELOPMENT ECONOMICS
By
LE KHA TU
Academic Supervisor:
Dr. NGO MINH HAI
HO CHI MINH CITY, December 2017
ABSTRACT
Cash holdings have long been a particular concern when studying the financial
policies of enterprises. The global financial crisis in 2008 has impacted many
economies in the world; Vietnam was one of the few emerging economies in
Southeast Asia being less affected by the crisis. However, the crisis has negative
impacts on the macroeconomy of Vietnam. Low GDP growth rates, booming inflation
and escalating interest rates made Vietnamese enterprises’ situation more difficult.
Along with the Central bank's tightening monetary policy to curb inflation,
commercial banks simultaneously restricted the issuance of large loans, which were
more difficult for firms to access more capital. In that context, the efficient use of cash
holdings is the key to business success. To use effectively the cash flow of the firms, it
is important to study the factors that affect the cash holdings of firms. Thus, the author
chose the topic "The effect of cash flow sensitivity on enterprises’ cash holdings:
Evidence from Vietnam" to study the effect of financial factors on firms’ cash
holdings in Vietnam. The main objective of the study was to find empirical evidence
on the effects of cash flow sensitivities on cash holdings in the world and to seek
evidence of this in Vietnam. The study uses data from financial statements of 274
non-financial firms listed on Hanoi Stock Exchange (HNX) and Hochiminh Stock
Exchange (HOSE) between 2009 and 2015. In Vietnam, cash flow sensitivities have a
real impact on the cash holdings of firms, which is greater for firms with negative cash
flows. The financial constraint also affects the relationship between cash flow
sensitivity and cash holdings, but the agency problem does not show any significant
influence on this relationship. Based on the results of the study, the paper offers some
recommendations to help businesses make better cash management options. At the
same time, the paper also outlines some of the remaining limitations of research and
future research.
Keywords: Cash flow sensitivity, cash holdings, financial constraint, agency problem,
asymmetric
i
ACKNOWLEDGEMENT
The first word I would like to send my sincere thanks to all Vietnam – Netherlands
Programme professors, who have taught and imparted me valuable knowledge during
the time of study and research, enabling me to complete this thesis. You all not only
gave me the knowledge but also created the best conditions for me in the data
collection and thesis writing process. Friendly and kind Vietnam – Netherlands
Programme staff were always willing to help me on physical facilities as well as
references.
I would like to sincerely and gratefully thank Dr. Ngo Minh Hai, my supervisor, for
his great assistance, principal and valued advice, guiding me from the smallest steps to
help my thesis complete.
I would like to express my deep gratitude to all my friends, families, who have always
been with me, cheered and supported me all the time.
Despite all the effort, due to limited knowledge and time, the problems presented in
this thesis will certainly have many shortcomings. I look forward to receiving
feedback, evaluations and comments from the professors.
ii
CONTENTS
CHAPTER 1: INTRODUCTION ................................................................................ 1
1.1
The problem statement ...................................................................................... 1
1.2
The research objectives ..................................................................................... 2
1.3
Research contribution ....................................................................................... 2
1.4
The thesis structure ........................................................................................... 3
CHAPTER 2: LITERATURE REVIEW .................................................................... 4
2.1
Introduction ....................................................................................................... 4
2.2
Studies on the effects of cash flow sensitivity on cash holdings ...................... 4
2.2.1 The impact of change in cash flow on cash holdings ..................................... 4
2.2.2 The relationship between financial constraints and cash holdings of a
company ................................................................................................................... 7
2.3
Summary of previous findings .......................................................................... 9
CHAPTER 3: RESEARCH METHODOLOGY ...................................................... 13
3.1
The analytical framework ............................................................................... 13
3.2
The econometric models ................................................................................. 14
3.2.1 Model the effect of cash flow sensitivity on cash holdings ........................... 14
3.2.2 The effect of cash flow sensitivity on cash holdings is under financial
constraints .............................................................................................................. 15
3.2.3 The effect of cash flow sensitivity on cash holdings is in the agency problem
................................................................................................................................ 17
3.3
The data .......................................................................................................... 20
3.4
Fixed Effects and Random Effects ................................................................. 20
3.5
GMM4 estimations ......................................................................................... 21
3.6
Expectations on research results ..................................................................... 22
3.6.1 Effects of cash flow sensitivity on cash holdings .......................................... 22
3.6.2 Effects of cash flow sensitivity on cash holdings under financial constraints
................................................................................................................................ 23
3.6.3 Effects of cash flow sensitivity on cash holdings under agency problem ..... 23
CHAPTER 4: RESEARCH RESULTS ..................................................................... 24
4.1
Data description .............................................................................................. 24
iii
4.2. Regression results and discussions .................................................................... 28
4.2.1 Effects of cash flow sensitivity on cash holdings .......................................... 28
4.2.2 Effects of cash flow sensitivity on cash holdings under financial constraints
................................................................................................................................ 37
4.2.3 Effects of cash flow sensitivity on cash holdings under agency problem ..... 42
CHAPTER 5: CONCLUSIONS ................................................................................. 45
5.1
Conclusions ..................................................................................................... 45
5.2
Policy implications .......................................................................................... 46
5.3.
Limitations ...................................................................................................... 47
REFERENCE............................................................................................................... 49
APPENDIX................................................................................................................... 51
iv
LIST OF TABLES
Table 4. 1: Sample statistics ......................................................................................... 24
Table 4. 2: Variable description ................................................................................... 25
Table 4. 3: Compare the mean of variables .................................................................. 25
Table 4. 4: Pearson and Spearman correlation coefficients ......................................... 27
Table 4. 5: The results of Almeida (2004) ................................................................... 29
Table 4. 6: Estimation results of the model .................................................................. 31
Table 4. 7: Results of the asymmetry sensitivity of cash flow ..................................... 34
Table 4. 8: Cash Flow and Cash of FPT Corporation for the period 2009 – 2015 ...... 36
Table 4. 9: The number of observations of companies by year divided into three
categories ...................................................................................................................... 38
Table 4. 10: The summary statistics for the cash holdings of the two groups of
companies by the three classification criteria ............................................................... 39
Table 4. 11: Estimation results for financial constraints .............................................. 40
Table 4. 12: Estimation results of the model for agency problem ............................... 43
v
CHAPTER 1: INTRODUCTION
1.1
The problem statements
The 2008 financial crisis was the worst economic disaster since the Great Depression
of 1929, having a strong impact on the world in general and Southeast Asia in
specific. However, Vietnam was one of the few economies that were less affected by
the recession caused by this crisis. Nevertheless, the GDP growth rates for seven
consecutive years (from 2009 to 2015) were in low level, showing that the crisis still
had negative impacts on Vietnamese economy. Moreover, in the period of 2009-2015,
Vietnam’s inflation was abnormal (a sudden increase to 19% in 2011 and then
declining), bad debts became a serious problem and getting worse. Vietnamese
enterprises were directly affected by the crisis, the number of enterprises reporting
losses was increasing and many businesses were forced to dissolve. In that context,
cash holdings were paid more attention, since cash management is the key to a success
business as accessing capital markets is difficult. For effective cash management, the
first problem is what factors affect the firm's cash holdings.
Prior literature has widely studied the effects of cash flow on cash holdings and got
certain conclusions. Almeida et al. (2004), Khurana et al. (2006) found cash flow
sensitivity was positive. Meanwhile, Riddick and Whited (2009), Bao, Chan and
Zhang (2012) found that cash flow sensitivity was negative.
The study of cash flow sensitivity of cash holdings may help firms proposing a better
cash management model, thereby firms use cash more efficiently. However, in
Vietnam, the effect of cash flow sensitivity on cash holdings has yet to be studied
extensively, and there are disputations on this problem in the world. For this reason,
the author chose the research topic "The Effect of Cash Flow Sensitivity on Cash
Holdings: Evidence from Vietnam", examining whether or not the effect of cash flow
sensitivity on cash holdings in Vietnamese enterprises.
1
1.2
The research objectives
The main purpose is examing the effect of cash flow sensitivity on cash holdings, the
paper includes two basic objectives:
- Examining the effect of cash flow sensitivity on cash holdings in Vietnamese
enterprises
- Verifying the nonlinear relationship between cash flow sensitivity and cash holdings.
To accomplish two research objectives, the paper will solve the following research
problems:
- Is there any evidence in the world about the effect of cash flow sensitivity on cash
holdings?
- Which method is appropriate to test the effect of cash flow sensitivity on cash
holdings in Vietnam?
- What factors affects the cash flow sensitivity on cash holdings?
- What is the effect of cash flow sensitivity on cash holdings in case the firm has
positive cash flow and negative cash flow?
1.3
Research contribution
Research on the effect of cash flow sensitivities has a very important meaning,
especially for firms. Financially, cash flow sensitivity can represent a company's risk,
because cash flow sensitivity is the level of change in the company's cash when cash
flow changes. If a company has high cash flow sensitivity, this can affect corporate
financial policies such as dividends and capital structure. A company with high cashflow sensitivity is difficult to maintain a capital structure with high debt ratios due to
insecure liquidity and the company is hard to implement a good dividend policy when
cash always has instability. Thus, finding the impact of cash flow sensitivity can help
firms understand how cash flow affects their cash holdings, so they can provide better
cash management and better implementation of dividend payment and capital
mobilization policies. The results of the study will also contribute to the global debate
on how cash flow sensitivity affects cash holdings.
2
1.4
The thesis structure
The research is organized in the following chapters:
Chapter 1: Introduction. This chapter presents the reasons for choosing topics,
research objectives, research methods, research contribution and thesis structure.
Chapter 2: Overview of previous studies on the impact of cash flow sensitivity on cash
holdings. This chapter presents the results of the previous study on the effect of cash
flow sensitivity on cash holdings, findings, arguments and limited issues in these
studies.
Chapter 3: Research Methods. This chapter will detail the research model, variables in
the model, data as well as expectations about the research results.
Chapter 4: Research Results. This chapter presents and discusses the results of the
study on the effect of cash flow sensitivity on cash holdings of firms in Vietnam, the
results of examination with financial constraints and agency problem.
Chapter 5: Conclusions and limitations of the study. This chapter presents the
contributions of the research, the next research direction, and the limitations.
3
CHAPTER 2: LITERATURE REVIEW
2.1
Introduction
There are many reasons for the company to hold cash. The most basic reason is that
the company holds cash to pay off debts and finance its investments. When a company
is not limited to accessing a capital market, the company's cash holdings will be less.
But the mobilization of external funding is often associated with high capital
expenditure. Thus, firms always give priority to using cash held by the company itself
to avoid the burden of costs. One of the important cash-flowing channels for the
company is through cash flow from its revenues. The change in this cash flow will
cause the change in the company's cash holdings. Some researchers have focused on
this aspect when studying cash holdings.
2.2
Studies on the effects of cash flow sensitivity on cash holdings
2.2.1 The impact of change in cash flow on cash holdings
Almeida et. al. introduced a model of a firm’s liquidity demand that formalizes
Keynes’ intuition. The model hypothesizes that firms with capital constraints tend to
have cash holdings from cash inflows. Almeida et al argue that firms that were not
constrained in their access to funding would not show cash incentives, when the firm’s
cash flow changed, their cash holdings would not be affected while financially
constrained firms would be affected by changes in cash flow.
To test their hypotheses, Almeida et. al. used a database of manufacturing firms
between 1971 and 2000, and used OLS regression to estimate the model. The
hypothesis of the model predicted that a change in cash holdings would correspond to
the cash flow shock. The hypothesis also predicted that the cash holdings of
financially constrained firms would be affected by the attraction of future investment
opportunities. Therefore, Almeida et. al. use the Q variable to capture unobserved
information about the value of long-term growth options.
The OLS regression showed that for the limited-capital-access firms, when the cash
flow was positive, the firm would increase cash holdings and vice versa. Variable Q
had a positive and significant coefficient for financially constrained firms. With future
4
investment opportunities, the limited capital access firms would increase their cash
holdings.
Riddick and Whited (2009) validated cash flow sensitivity with different theories and
models from Almeida et. al. Riddick and Whited argued that in the Almeida model the
cash flow was positive because Almeida thought that an increase in cash flow did not
correspond to higher yield of fixed assets. So, when a company has a positive cash
flow, the company will not have incentive to transfer its highly liquid assets to fixed
assets, so the company will use increased cash flow to supplement its cash holdings.
The results of Riddick and Whited differed from the results of Almeida et. al. It was
caused by correction of the measurement error in the Tobin's Q variable. Greene
(1997, p. 440) argued that the measurement error in Tobin's Q variable could affect
cash flow variable because of the measurement error. In a regression variable it affects
all coefficients of variables in regression if this regression variable correlates with
other variables.
Riddick and Whited used the fourth-order GMM estimation to overcome the problem
of measurement errors in Tobin's Q. The results showed that when a company has
positive cash flow, its cash reserves would fall. This happens because when there was
a positive yield shock that increased cash flow and margin profit of capital, the
substitution effect would cause the company to use cash reserves to purchase more
productive tangible assets and use cash to invest, so their cash reserves will decrease.
Bao, Chan and Zhang (2012) also used the GMM4 estimation with additional
empirical model to confirm the results of Riddick and Whited. Bao, Chan and Zhang
added to the experimental model of Riddick and Whited several limited control
variables such as firm size, capital expenditure, non-cash flow, and short-term debt.
The results confirmed the results of Riddick and Whited that the relationship between
cash flow sensitivity and cash holdings is negatively correlated.
At the same time as testing the impact of cash flow sensitivity on cash holdings,
researchers also concern that the relationship between cash flow and cash flow
sensitivity is linear or nonlinear. The linear relationship between a change in cash flow
and cash flows suggests that regardless the cash flow change is positive or negative,
5
the magnitude of change in cash reserves is unchanged. According to Faulkender and
Wang (2006), lacking cash would diversify the company's cash reserves. This
suggests that there are grounds to believe that the impact of cash flow sensitivity on
cash flow will be different in the two cases where the firm has positive cash flow and
the company has negative cash flow.
Research results from Almeida et al. (2004) indicated that firms were limited in their
abilities to access funding, i.e. the firms that were financially constrained, had positive
cash flow sensitivity, but did not show the difference in the effect of cash-flow
sensitivity on cash flow in two cases: the firm has positive cash flow and the firm has
negative cash flow.
Riddick and Whited (2009, p. 1793) also pointed out briefly that medium and large
firms exhibit negative nonlinear relationships in cash flow sensitivity, however, the
study of Riddick and Whited did not focus on the nonlinear relationship between cash
flow and cash flow sensitivity. Riddick and Whited pointed out firms with an increase
in cash flow tended to hold cash on investments because positive cash flow was the
evidence that tangible assets were more productive. In addition, as cash flows
increased, firms used cash reserves to invest in highly profitable projects. Conversely,
when a company had negative cash flow, this indicated that the tangible fixed assets
were of low productivity, or the company had projects with negative NPV. Then the
company would immediately stop these projects to save cash. Hence, according to
Riddick and Whited, whether a company has a positive or negative cash flow, the
relationship between cash flow sensitivity and cash holdings remains negative.
Bao, Chan and Zhang (2012) argued that a company could not immediately stop the
negative NPVs projects when the company has negative cash flow for three reasons.
First, some projects were accompanied by binding contracts and the company could
not stop these projects immediately, this was common when these were tender
projects. The second reason was indicated by Kothari et. al. (2009) that managers had
an incentive to hide bad information. If a company immediately terminates a bad
project, then maybe the market will realize the problem in that company. So, some
managers may choose to keep bad projects to minimize bad news. By delaying the
6
release of bad news, managers expect to be able to extend the time until there is good
information to neutralize the impact of bad news. Therefore, when a company faces
negative cash flow, the company may not end up ineffective projects. The third was
the agency problem, Jensen and Meckling (1976), Jensen (1986) pointed out that
managers had an incentive to invest excessively and therefore they could keep some
projects with negative NPV to maximize personal profit. This is similar to the risk
transfer in case of financial exhaustion, so when the company has negative cash flow,
the cash reserves of the company may not increase but may decrease as managers
continue to bring cash to invest in projects with negative NPV.
Because of three above reasons, a company facing negative cash flow may not
immediately stop all bad projects, when the company has negative cash flow, the
company's cash reserves may not increase. Using the samples of manufacturing firms
from 1972 to 2006, Bao, Chan and Zhang examined animpact of cash flow sensitivity
on cash flows including the viability of the nonlinear relationship corresponding to a
change in cash holdings between the two cases where the firm had positive cash flow
and the firm has negative cash flow. Empirical evidence suggested that cash flow
sensitivity would be negative when the firm had positive cash flow, in line with
Riddick and Whited (2009), but the sensitivity of cash flow would be positive when
the firm had a positive cash flow, this supports the hypothesis of Bao, Chan and
Zhang that the influence of cash flow sensitivity on cash holdings is asymmetrical.
2.2.2 Relationship between financial constraints and cash holdings of a company
Two areas of important research in corporate finance are the impact of financial
constraints on corporate policy and how firms manage finance. These two areas have a
close relationship. If a company has unlimited access external funding, which means
the firm is not financially constrained, the company does not need to have cash
reserves for future investment. On the contrary, if a company is limited in accessing
external funding because of high cost, cash reserves are necessary to cover the needs
of the company.
According to Kaplan and Zingales (1997), the most accurate and most widely used
definition of financial constraints firms was that these firms distinguish the internal
7
and external capital expenditure. However, by definition, every company seems to be
financially constrained. A small transaction cost of using external funding is sufficient
to rank the company into financial constraints. Fazzari, Hubbard and Petersen (1988)
and many other researchers considered that the cash-flow sensitivity of the higher
investment was the evidence for larger financial constraints.
In their study, Almeida et. al. (2004) demonstrated that the relationship between
financial constraints and the company's payment needs could help determine whether
financial constraints were an important determinant of corporate behavior or not.
Almeida argued that holding cash was expensive, as higher cash savings would
require cuts from profitable investment projects. Therefore, financially constrained
firms choose an optimal cash policy to balance the returns of present and future
investment projects. This policy is the opposite of firms that are not financially
constrained: firms which are not financially constrained neither use cash nor face the
cost of cash holdings.
Almeida uses five methods to classify firms into two group of financially constrained
and un-constrained firms: dividend payment policy, asset size, bond ratio, percentage
of commercial papers and KZ (based on Kaplan and Zingales (1997)).
Almeida et. al. (2004) concluded that changes in cash flow affected cash holdings
only when firms were constrained in access to capital, for firms with no financial
constraints, changing cash flows would not affect cash holdings. This may be caused
by financially constrained firms tending to hold cash, because of the limited capital
access, while financially un-constrained firms do not.
Riddick and Whited (2009) predicted that firms with higher external capital
expenditure would have a greater negative correlation coefficient. The results of the
regression of Riddick and Whited did not support the opinion of Almeida et al. in
which financial constraint firms did not have cash flow sensitivities of holding cash,
and even did not support Riddick and Whited’s prediction stated above.
The research results of Bao, Chan and Zhang (2012) supported Riddick and Whited
(2009) that cash-flow sensitivity was stronger for medium- and large-sized firms
because these firms had no financial constraints.
8
2.3
Summary of previous findings
Although previous studies use different empirical models and methods, most of the
studies conclude that cash flow sensitivity has an effect on cash holdings. The
discussed problem is how this effect tends to be. Almeida et. al. (2004) used the OLS
method for data taken from US manufacturing firms in the period 1971-2000. The
positive relationship between changes in cash holding and cash flow indicates that
firms decrease (or increase) cash reserves when they have negative (or positive) cash
flows. A change of cash flow only affects cash holdings for firms with financial
constraints. Almeida et. al. found that their findings were consistent with their
argument and argued that only financially constrained firms, because of their
restricted access to external capital markets, saved cash out of cash flow, while
unconstrained firms did not. In the same direction of research with Almeida, Khurana
et al. (2006) also drew the same conclusion.
In normal intuition, the conclusion of Almeida et al. seems to be right, when a firm
has a positive cash flow i.e. profitable business operations, the firm will bring that
profit back into its cash reserves. However, some researchers disagree with Almeida's
argument. Riddick and Whited (2009) argued that the results of Almeida showed
positive cash flow sensitivity because in Almeida's model, the increase in cash flow
did not correspond to the increase in productivity of physical assets. Riddick and
Whited contended that a firm with an increase in cash flow tended to turn cash
reserves into investments because the positive cash flow shock indicated higher
productivity of physical assets. Riddick and Whited thought the positive cash flow
sensitivity was not appropriate because of the OLS method. Riddick and Whited
pointed out that due to the measuring error of Tobin's Q variable, using the OLS
method would affect the coefficient of other variables in the estimation, especially the
cash flow variable. Hence, Riddick and Whited used a general method of moment
(GMM) estimation, proposed by Erickson and Whited (2000), to estimate the model.
The results were consistent with Riddick and Whited's original hypothesis, the cash
flow sensitivity was negative, which meant that firms with an increase in cash flow
tended to turn cash reserves into investments, reducing firm's cash holdings. On the
other hand, the results of Riddick and Whited also rejected other conclusion by
9
Almeida et al.. Almeida said that firms were not financially constrained, their cash
was not affected by changes in cash flow, Riddick and Whited proved that firms
without financial constraints had cash flow sensitivity, and even the cash flow
sensitivity of these firms was greater than that of financially constrained firms.
Sharing the same empirical method with Riddick and Whited (2009), suggesting that
the fourth-order GMM (GMM4) was more suitable than OLS, Bao, Chan and Zhang
(2012) performed a reassessment of the effect of cash flow sensitivity on cash
holdings and the research results support the outcome of Riddick and Whited.
However, Bao, Chan, and Zhang went further than Riddick and Whited to pay
attention to a nonlinear relationship between cash flow sensitivity and cash holdings.
Bao, Chan and Zhang argued that cash flow sensitivity was not negative in all cases,
particularly when the firm had negative cash flow. Riddick and Whited argued that
when a firm had negative cash flow it meant the productivity of the firm's physical
assets was decreasing or the firm was investing in ineffective projects. Then the firm
would stop funding projects or stop procuring assets, which would increase the firm's
cash. Bao, Chan and Zhang in their study gave some main reasons why the firm could
not immediately stop ineffective projects, therefore, when firm had negative cash
flow, the negative cash flow sensitivity may not be sustainable. The empirical results
confirmed the predictions of Bao, Chan and Zhang.
Besides the studies on the effects of cash flow sensitivity on cash holdings, studies on
impacts of agent costs on the effect of cash flow sensitivity on cash holdings had
certain results. Dittmar, Mahrt-Smith, and Servaes (2003) argued that if firms have a
larger agency problem, firms would hold more cash. Bao, Chan and Zhang (2012)
found a link between external control and the effect of cash flow sensitivity on cash
holdings. If the firm's shares were held by institutional investors, i.e. the firm had a
large external control and a lower agency, the effect of cash flow sensitivity on cash
holdings would be smaller.
10
CHAPTER 3: RESEARCH METHODOLOGY
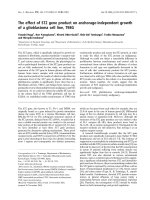
3.1
The analytical framework
Increasing
investment
Firm
performance
Increasing tangible
assets
Agency problem
The sensitivity
of Cash flow
Cash holdings
Cost of holding
money
Financial
constraint
Investment
opportunities
The difficulties in
accessing capital
External capital
cost
13
3.2
The econometric models
Based on research objectives, the paper has three problems to clarify. The first is the
influence of cash flow sensitivity on cash holdings, the second is the impact of
financial constraints the last is the agency cost. Therefore, the research paper uses
three models to solve the above problems.
3.2.1 Model the effect of cash flow sensitivity on cash holdings
Based on the model of Bao, Chan and Zhang (2012), the paper uses the following
model to test the hypothesis that cash flow sensitivity affects cash holdings and this
effect is different in case the firm has negative and positive cash flow:
ΔCashHoldingsit = α0 + α1CashFlowit + α2Negit + α3Cashflowit * Negit + α4Qit +
α5Sizeit + α6Expenditureit + α7Acquisitionit + α8ΔNCWCit + α9ShortDebtit-1 + εit
(1)
Where:
CashHoldings: is calculated as the cash in company divided by total asset.
ΔCashHoldings: the difference of cash between year t and year t−1 over total assets
CashFlow: is the profit after interest, dividends and taxes payments plus depreciation
over total assets.
Neg: is the indicator variable. Neg equals zero if in that year the firm has positive cash
flow and one otherwise.
Q: represents the market capitalization of the company. Q is calculated by total of the
market value of the capital and the book value of assets minus the book value of the
capital and divided by the book value of assets.
Size: represents the scope of the company, calculated as the natural logarithm of total
assets.
Expenditure: the ratio of capital expenditures to total assets.
Acquisition: the indicator variable. If the company has no acquisition in that year,
Acquisition equals one and zero otherwise.
14
NCWC: is calculated as net non-cash working capital which equals working capital
minus cash divided by total assets.
ΔNCWC: is the difference of NCWC between year t and year t−1.
ShortDebt: is the debt in short-term weighted by total assets.
i and t refers to firm and year respectively, ε is random error term.
3.2.2 The effect of cash flow sensitivity on cash holdings is under financial constraints
After examining the effect of cash flow sensitivity on cash holdings, the study
examines how cash flow sensitivity varies between financially constrained and unconstrained firms. For that purpose, the paper uses three measures to divide the
sample into two groups.
Firstly, the paper uses the KZ index, which is based on the results of Kaplan and
Zingales (1997). The study uses the KZ index as the data for this metric corresponds
to the data in Vietnam. The KZ index is calculated as follows:
KZindex = -1.002 x CashFlow + 0.283 x Q + 3.139 x Leverage - 39.368 x Dividends 1.315 x CashHoldings
Where:
CashFlow: is the profit after interest, dividends and taxes payments plus depreciation
over total assets.
Q: represents the market capitalization of the company. Q is calculated by total of the
market value of the capital and the book value of assets minus the book value of the
capital and divided by the book value of assets.
Leverage: represents the capital structure of the firm which is calculated as the ratio of
the total debt and total assets.
Dividends: represents the dividend policy of the company which is calculated as the
cash dividends divided by total assets.
CashHoldings: is calculated as the cash in company divided by total asset.
15
The study evaluates firms via the KZ index based on Almeida et al. (2004), within a
year, firms ranked among the 33% of the highest KZ index are considered as in the
financial constraint group.
Secondly, the study uses an additional index to assess the financial constraints among
firms. This index is based on the research by Whited and Wu (2006) and is called the
WW index. Bao, Chan, and Zhang (2012) argued that the WW was more appropriate
than the KZ as firm’s characteristics in the WW were more related to the firm's
financial constraints than the KZ. The WW is more relevant than the KZ since the
WW does not include Tobin's Q. The data for calculating the WW are also consistent
with the data in Vietnam. The WW index is calculated as follows:
WWindex = -0.091 x CashFlowit - 0.062 x DIVPOSit + 0.021 x TLTDit – 0.044 x Sizeit
+ 0.102ISGit – 0.035 x SGit
Where:
CashFlow: is the profit after interest, dividends and taxes payments plus depreciation
over total assets.
DIVPOS: the indicator variable. If firm i pays dividend by cash in year t, DIVPOS is
consider as one and zero otherwise.
TLTD: is the debt in long-term weighted by total assets.
Size: represents the scope of the company, calculated as the natural logarithm of total
assets.
ISG: the industry's revenue growth rate.
SG: the growth rate of the company.
According to Bao, Chan and Zhang (2012), in a year, firms in the top 25% of the
highest WW index were considered as firms in the financial constraint group.
Finally, the study assesses whether firm is assigned to the financially constrained
group or not based on dividend payments. If a firm does not pay dividends during the
year, then the firm is considered financially constrained firms and vice versa.
16
After dividing the sample into two groups, the equation (1) is adjusted to examine the
effect of financial constraints on the firm's cash holdings. The study is modified
equation (1) into equation (2) as follows:
ΔCashHoldingsit = β0 + β1CashFlowit + β2Negit + β3Cashflowit * Negit +
β4Constraintit + β5CashFlowit * Constraintit + β6Constraintit * Negit + β7CashFlowit *
Constraintit * Negit + β8Qit + β9Sizeit + β10Expenditureit + β11Acquisitionit +
β12ΔNCWCit + β13ShortDebtit-1 + εit
(2)
The variables in equation (2) are defined as in equation (1)
In equation (2), there is a constraint dummy variable (value of one if the firm is
considered financially constrained) and Constraint's interactive variables with
CashFlow variable, Neg dummy variable.
3.2.3 The effect of cash flow sensitivity on cash holdings is in the agency problem
To consider the impact of the agency problem, the study uses the following model:
ΔCashHoldingsit = γ0 + γ1CashFlowit + γ2Negit + γ3Cashflowit * Negit + γ4Instit +
γ5CashFlowit * Instit + γ6Instit * Negit + γ7CashFlowit * Instit * Negit + γ8Qit + γ9Sizeit
+ γ10Expenditureit + γ11Acquisitionit + γ12ΔNCWCit + γ13ShortDebtit-1 + εit
(3)
Where: Inst equals one if the number of shares held by institutional shareholders is in
the top 10% of the company.
The variables in the model are calculated as follows:
Cash holdings, in the study of Almeida et al. (2004) on cash flow sensitivity, Almeida
et al. defined the firm's cash holdings including cash and marketable securities divided
by total assets. Bao, Chan and Zhang (2012) defined cash as the firm’s total cash
holdings divided by total assets. With data taken from Vietnameses firm’s financial
statements, the study calculates cash holdings as cash and cash equivalents on the
balance sheet, i.e. the largest liquid asset item, divided by the total assets of the firm.
𝐶𝑎𝑠ℎ𝐻𝑜𝑙𝑑𝑖𝑛𝑔 =
𝐶𝑎𝑠ℎ 𝑎𝑛𝑑 𝑐𝑎𝑠ℎ 𝑒𝑞𝑢𝑖𝑣𝑎𝑙𝑒𝑛𝑡𝑠
𝑇𝑜𝑡𝑎𝑙 𝑎𝑠𝑠𝑒𝑡𝑠
17
CashHoldings: is calculated as the cash in company divided by total asset.
Cash flow, Almeida et al. (2004), Bao, Chan and Zhang (2012) defined the firm’s cash
flow as earnings before extraordinary items and depreciation divided by total assets. .
Extraordinary items or expenses are stated in the income statement. However, with
data collected in Vietnam, there are no extraordinary items in the firms' income
statement. Therefore, the study takes the variable definition according to Bates et al.
(2009), in which CashFlow variable is the profit after interest, dividends and taxes
payments plus depreciation. By this definition, the CashFlow variable is calculated as
follows:
𝐶𝑎𝑠ℎ𝐹𝑙𝑜𝑤 =
𝑃𝑟𝑜𝑓𝑖𝑡 𝑎𝑓𝑡𝑒𝑟 𝑡𝑎𝑥 𝑝𝑙𝑢𝑠 𝑑𝑒𝑝𝑟𝑒𝑐𝑖𝑎𝑡𝑖𝑜𝑛
𝑇𝑜𝑡𝑎𝑙 𝑎𝑠𝑠𝑒𝑡𝑠
Where: depreciation is taken from the depreciation of fixed assets on the indirect cash
flow statement.
Price to book value, known as the margin value q, was developed by Tobin (1969). In
this study, Tobin defined the margin value q as the ratio between the market value and
the replacement value of the asset. However, since the margin value q can not be
observed, the study uses the value of Tobin's Q to replace the margin value Q, which
is used in many empirical studies in the world such as Bates et al. (2009), Bao, Chan
and Zhang (2012). The value of Tobin's Q is calculated by comparing the firm’s
market capilization value with the respective book value.
𝑄=
𝑀𝑎𝑟𝑘𝑒𝑡 𝑐𝑎𝑝𝑖𝑙𝑖𝑧𝑎𝑡𝑖𝑜𝑛 + 𝐵𝑜𝑜𝑘 𝑣𝑎𝑙𝑢𝑒 𝑜𝑓 𝑑𝑒𝑏𝑡𝑠
𝑇𝑜𝑡𝑎𝑙 𝑏𝑜𝑜𝑘 𝑣𝑎𝑙𝑢𝑒 𝑜𝑓 𝑎𝑠𝑠𝑒𝑡𝑠
Book value of debts is taken from liabilities item on balance sheet.
Market capilization equals P/B multiplied by book value of the capital ie equals
outstanding shares multiplied by price at that time.
Total book value of assets is taken from total assets item on balance sheet.
18
Capital expenditure, Riddick and Whited (2009) argued that as firm's cash flow
increased, it corresponds to an increase in the productivity of firm's tangible fixed
assets. Firms do not accumulate cash, they return cash to invest. It means firms use
cash to purchase more fixed assets when they have positive cash flow. The amount of
money a firm spending on procuring fixed assets for investment projects is called
capital expenditure, which suggests that capital expenditures may represent
investment opportunities. Based on this argument, the study calculates capital
expenditures as the difference between the firm's fixed assets in year t and t -1 plus the
fixed asset depreciation in year t and t - 1.
𝐸𝑥𝑝𝑒𝑛𝑑𝑖𝑡𝑢𝑟𝑒 =
𝐷𝑖𝑓𝑓𝑒𝑟𝑒𝑛𝑐𝑒 𝑜𝑓 𝑓𝑖𝑥𝑒𝑑 𝑎𝑠𝑠𝑒𝑡𝑠 + 𝐷𝑖𝑓𝑓𝑒𝑟𝑒𝑛𝑐𝑒 𝑜𝑓 𝑑𝑒𝑝𝑟𝑒𝑐𝑖𝑎𝑡𝑖𝑜𝑛
𝑇𝑜𝑡𝑎𝑙 𝑎𝑠𝑠𝑒𝑡𝑠
Non-cash working capital, based on the definition of Bao, Chan and Zhang (2012),
non-cash working capital is calculated as working capital minus cash divided by total
assets. Working capital equals short-term assets minus short-term debts. Cash
holdings equal cash and cash equivalents.
𝑁𝐶𝑊𝐶 =
𝑆ℎ𝑜𝑟𝑡 𝑡𝑒𝑟𝑚 𝑎𝑠𝑠𝑒𝑡𝑠 − 𝑆ℎ𝑜𝑟𝑡 𝑡𝑒𝑟𝑚 𝑑𝑒𝑏𝑡𝑠 − Cash and cash equivalents
𝑇𝑜𝑡𝑎𝑙 𝑎𝑠𝑠𝑒𝑡𝑠
ΔNCWC: is the difference of NCWC between year t and year t−1.
Short-term liabilities, according to Bao, Chan and Zhang (2012), ShortDebt variable is
calculated by taking short-term debts in year t-1 divided by total assets in year t.
𝑆ℎ𝑜𝑟𝑡𝐷𝑒𝑏𝑡 =
𝑆ℎ𝑜𝑟𝑡 𝑡𝑒𝑟𝑚 𝑑𝑒𝑏𝑡𝑠 𝑝𝑟𝑒𝑣𝑖𝑜𝑢𝑠 𝑦𝑒𝑎𝑟
𝑇𝑜𝑡𝑎𝑙 𝑎𝑠𝑠𝑒𝑡𝑠
Size, Bates et al. (2009) argued that there was economic benefit to the size of cash
holdings. In this study, Bates defined firm size as the natural logarithm of the firm's
total assets. This definition is also used in many other studies, such as Almeida et al.
(2004), Bao, Chan and Zhang (2012).
𝑆𝑖𝑧𝑒 = ln(𝑇𝑜𝑡𝑎𝑙 𝑎𝑠𝑠𝑒𝑡𝑠)
19
3.3
The data
Based on previous studies on cash holdings, the study selected data including 274
firms from the Hanoi Stock Exchange (HNX) and Hochiminh Stock Exchange
(HOSE). Selected firms are non-financial. The study excludes firms in the financial
sector, such as the real estate, securities and banking, insurance due to special
accounting standards, according to Shadi Farshadfar and Reza Monem (2013).
Sampling period is from 2009 to 2015. The data is presented panel data with 1918
observations. Data is collected from the financial statements of the firms which are
taken from Vietstock, CafeF.
3.4
Fixed Effects and Random Effects
The study uses the OLS regression method for the data panel as Fixed effects and
Random effects. The study ran two quantitative methods simultaneously with the
collected data. After running the regression, the study will use the Hausman test to
examine the results from the two methods to find the better results.
Hausman's test examines the results between the two regression models Fixed effects
and Random effects by examining the difference in the regression coefficient and the
null hypothesis assuming that the difference is not systematic. That is, if accepting the
hypothesis H0, the random effects are better. In contrast, rejecting the null hypothesis,
the Fixed effects are better.
If the Hausman test‘results indicated that FEM is better REM, the study will use the
results of the FE model. However, to eliminate the heteroskedasticity, the study will
use Robust and Cluster for the FE model.
Robust, when there is the heteroskedasticity, OLS estimation is still an unbiased
estimator. However, estimates are no longer effective because the variance is no
longer the smallest. Furthermore, the variance estimates will be biased, so that
significance level and confidence interval tests based on t and F are no longer reliable.
Derived from the idea that the OLS estimation when there is the heteroskedasticity,
the regression coefficient is correct, only the standard error is deviated, with the
20