Xây dựng dự án đầu tư nhà máy sản xuất ván gỗ MDF của công ty SAHABAKe
Bạn đang xem bản rút gọn của tài liệu. Xem và tải ngay bản đầy đủ của tài liệu tại đây (551.91 KB, 29 trang )
Project investment MDF manufacture of SAHABAK JSC
CHAPTER I.OVERVIEW OF PROJECT : OBJECTIVES,
PRODUCTS, MARKET
I. LEGAL DOCUMENTS
The legal documents of project
II. PROJECT OBJECTIVES
Vietnam's economy is growing strongly, driving demand for investment in building
infrastructure for the country is also increasing. The craze of building materials including
artificial boards, especially MDF still occur every year, as the demand is huge. Although
manufacturing industry of our country based panels have the remarkable developments in
statistics but a large MDF still has to import large quantities each year.
Through market research shows that our country's annual import MDF from
Malaysia, Thailand, China, Indonesia, New Zealand. Etc.
The project SAHABAK Corporation founded with the goal of:
Building MDF manufacturing plant with advanced prices reasonable for the
industrialization and modernization of the country.
Page 1 / 29
Creating materials for interior decoration industry, instead of natural wood,
contributing to reduce deforestation.
Creating valuable goods, contributing to local economic development, creating jobs
for local workers
III. PRODUCTS AND TARGET MARKET OF PROJECT
1. Main products of project and purpose of using
MDF (Medium Density Board) of wood artificially high mechanical strength, large
size, suitable for furniture production technology in the interior tropical climates.
Fibreboard is widely used in many fields of manufacturing furniture, interior decoration
and construction.
MDF is produced through the process of shredded wood fibers pressed, crushed and
mixed glue, the proportion of 520-850kg/m3, depending on quality requirements, raw
material, thickness. On the market there are 3 main types: plain, water-resistant, melamine.
plain MDF is the most common type, often using veneer, paint or PU coating.
Also waterproof MDF belong plain MDF category, water-resistant adhesive is mixed
in the production process, often used in areas where exposure to water or high humidity
such as doors, indoor furniture, melamine kitchen cabinets ... MDF: MDF sides are coated
with melamine to create beauty, moisture and scratches..
2. Specification of products
Dimensions: (W x L): 1,220 x 2,440 mm Thickness: From 9 → 22 mm
Product was achieved by Vietnam standards and European standards (Euro MDF Board
(EMB) Standard, 1995, the Third Edition). The standards board E1, E2, CARB.
3. Segment market of products:
The project's main client is the furniture manufacturing business, especially
companies need high-quality MDF, consistent standards for the production of furniture
exports.
Client projects include importers MDF in regional markets such as Japan, Korea,
India ...
Page 2 / 29
IV. ESTIMATED PRESENT MARKET SIZE AND FORECAST FUTURE
DEMAND
1. Domestic Market Assessment:
2013
According to statistical data, in 6/2013 on imports of MDF Vietnam reached 34
thousand m3, valued at $ 9.1 million, down 16.2% in volume and 24.5% in value
compared the previous month. Overall, in the first 6 months of 2013, imports of MDF in
Vietnam reached 193.4 thousand m3, valued at USD 55.1 million, down 24.8% in volume
and 32.6% in value compared the same period in 2012. Prices of imported MDF Vietnam
average 6 months USD/m3 at 285.2, down 32.92 USD/m3 compared to the same period in
2012.
Through data analysis above shows that the demand for MDF in the domestic market
is huge and keeps growing. Moreover, the ability to meet the needs of the business market
in the country is not enough. SAHABAK Company firmly believes that the company's
products will have a place in the market. Firstly, the market is so large that domestic firms
do not produce enough. Second, the company's products superior in quality, have increased
resistance to moisture and fire through the application of state–of–the–art technology, the
most advanced available today.
2. Analysis of competition of domestic: :
a) MDF GERUCO Quangtri Company
Capacity: 70,000 m3
Lines and equipment purchased by the German group Metso supply, installation and
technology transfer. The average selling price in 2007: 245 USD/m3
b) MDF Kim Tin Factory
Capacity: 160,000 m3. Equipment lines: China. 50% active power
c) Vina Eco Board Co. (VECO)
Capacity: 250,000 m3. Lines of Dieffenbacher from Germany, 80% active power.
Page 3 / 29
d) Ý Mỹ JSC MDF
Capacity: 120,000 m3. Lines: Dieffenbacher Germany, is preparing production.
There's also a number of other plants are also in the process of implementing the
project as forestry company in May in Nghe An, Hoa Binh Tan An Factory ...
Page 4 / 29
CHAPTER II.
TECHNOLOGY AND PRODUCTION
PROCESS:
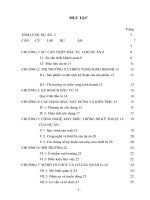
I. SUMMARY CHART PROCESS TECHNOLOGY:
Page 5 / 29
Layout of technology
II. CAPACITY OF LINE:
Page 6 / 29
The total line capacity of 360 m3/day (108,000 m3 per year with 300 working days)
and are perfect for the game with the thickness of 16mm, operating 3 shifts / day (7.5 hours
per shift) , with a minimum operating time of the day is 22.5 hours. Capacity of lines
depends on the thickness of each product, and is calculated as follows
Thickness
Final board (mm)
Rough boar (mm)
9,0
10,0
12,0
16,0
19,0
22,0
10,9
11,9
13,9
18,1
21,1
24,2
Density
kg/m3
780 – 820
770 – 810
760 – 800
740 – 780
735 – 765
720 - 760
Capacity
m3/day
300
330
350
360
320
300
III. EQUIPMENT LIST: (Summary of Main categories)
Amount
No
1
2
3
4
5
6
7
Name of Equipments
Wood chip preparing systems
Wood fiber prepare systems
Mat former system
Hot press system
Cutting and Sanding systems
Energy Center Systems
Adhesive Metering system
Auxiliary system: dust, compressed air,
( USD)
954,457
8,766,820
5,407,075
9,514,958
1,586,531
2,044,863
634,613
pumping, transporting, storage tanks,
8
electrical cabinets ....
Total
6,419,459
35,328,775
V. THE TOTAL VALUE OF EQUIPMENTS :
(Reference: Quotation equipment supplier Dieffenbacher)
The total value of equipment: 35,328,775
USD.
EXCHANGE RATE : 21.200 VNĐ/USD
The total value of equipment in VND : 748,970,030 ( x1000) (a)
IV. SPECIFICATION OF MATERIALS, ENERGY:
1. Main Material:
Page 7 / 29
CHAPTER I. Specification timber:
Type of wood: Log timber
Density: 650 to 1.000 kg/m3
Moisture contents: 60% Minimum - Maximum 100%
Dimensions: Length: 1,000 mm Minimum - Maximum 3.000 mm
Diameter: Min 40 mm - 160 mm Maximum
Other conditions: No mixed metal, stones and other impurities.
CHAPTER II. Supplier:
Factory is expected to put in Thanh Binh Industrial Zone, Cho Moi District,
Bac Kan province, bordering the province of Thai Nguyen, Cao Bang, Tuyen
Quang, this is an area of planted forest area (acacia leaf eucalyptus ... ) of the
country's largest.
Plant material is located in the active material advantage and transportation
costs of raw materials
2. Resin and Additives:
CHAPTER I. Resin :
Using liquid urea-formaldehyde glue. In the first phase, the plant using UF glue of of
domestic suppliers. Second phase will invest in plant production system to actively glue.
CHAPTER II. Additives: Using Ammonium sulfate (sulfate Anmoni) (NH4)
22SO4 decomposition in water.
CHAPTER III.
Hexamethylen Tetramine and/or Urea:
Chemical buffering agent to decompose in water quality depends on the speakers
using glue and pH levels in the water. Chemical formula of hexamethylen Tetramine:
(CH2) 6N4
Page 8 / 29
CHAPTER IV. Paraffin: Wax special, maximum oil rate of 3%.
CHAPTER V. Supplier: The resins and additives mentioned above are
the chemical companies in Vietnam to import the timber industry to
serve.
3. Energy :
CHAPTER I. Electricity : 380/200 V/ 50 (+/-1) Hz
Electrical power is provided by the zone and ensure the electrical requirements for
the project. To maintain continuity of operation of the project, the investor is also fitted
with backup generators.
CHAPTER II. Water: Pressure: 2x10⁵ Pa, Water quality: pH 6.5 - 8.5
Water provides water use by industrial parks have satisfactory properties
of the chain.
4. Consumption raw materials, energy projects:
For ease of calculation, the project needs energy, material thickness of projects with
the most commonly used product is 16mm, and 760 kg/m3, 360 m3/day Capacity of
factory.
Equivalent to approximately 108,000 m3 (approximately 300 working days)
Equivalent to approximately 82,080,000 kg / year (760 kg/m3)
Based on standard material consumption, energy suppliers, consumption is
calculated as follows:
Materials
Logs
Urea formaldehyde
Ammonium Chloride
Chemical buffer
Paraffin
Electricity
Water
Energy
Consumption
Total consumption
For 1m3 product
For 108,000 m3 product
760
110
3
3
15
350
1
1,520,000
kg
kg
kg
kg
kg
kW
M3
Kcal
82,080
8,360
228
228
1,140
37,800,000
108,000
164,160
Tons
Tons
Tons
Tons
Tons
KW
M3
Megacal
Page 9 / 29
VI. FACTORY BUILDING SOLUTIONS
5. Locations description:
Factory will be built in Thanh Binh Industrial Park located in Cho Moi District, Bac
Kan Province. This location is very convenient in terms of road, 130km from Hanoi and
located close to Highway 3, Factory will be built according to the approved design
requirements to ensure the needs of MDF factory moderns; will meet the requirements of
environmental, scenic, and aesthetic. Area of 80,000 m2 will be used.
6. Construction of main sections
No
1
2
3
4
5
6
7
8
9
10
11
12
13
14
15
16
Sections
Main workshop
Warehouse
Outdoor warehouse
Office
Cantin, worker campus
Auxiliary Zone
Garage
Transformer stations
Security house
Water supply tower
Protect Fence
Area for loading goods
Tree and grass mat
Main Power and lighting
Water supplier and drain
Communications systems
UNIT
Q’TY
U.PRICE
AMOUNTS
m2
m2
m2
m2
m2
m2
m2
m2
m2
m2
m
m2
m2
Set
Set
Set
20,000
5,000
3,000
1,600
500
400
150
25
50
1
1200
1,000
10,000
1
1
1
3,500
2,500
1,000
4,500
4,000
2,500
2,000
3,000
1,800
150,000
2,500
1,300
250
4,000,000
3,500,000
1,500,000
70,000,000
12,500,000
3,000,000
7,200,000
2,000,000
1,000,000
300,000
75,000
90,000
150,000
3,000,000
1,300,000
2,500,000
4,000,000
3,500,000
1,500,000
Lightning protection +
17
Firefighting
Cost of survey, design and
Set
1
2,000,000
2,000,000
18
evaluation
Total
1
3,423,450
3,423,450
117,538,450
Total construction cost
(b)
The company will build the plant in accordance with standards, including the main
items of the approved design
Page 10 / 29
CHAPTER III.
ORGANIZATION PROJECT
IMPLEMENTATION MANAGEMENT
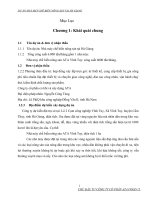
I. MANAGERMENT BOARD
The following table shows the structure of the company's management, which
reflects the relationship between the production department, and business leaders:
Page 11 / 29
Management Structure - Monitor: Board is the highest authority of the proposed
development company policies, through the planning and implementation of the report to
its supervisory function. Also can organize the appropriate parts of the process according to
the company's development and production situation specific.
II. DEMAND FOR MANPOWER:
Position
1. Direct labor
Technical
Teamleader
Directly worker
Total :
2. Indirect labor
Lab staff
QC staff
Accountance staff
Sales staff
Admin officer
Driver
Securities
Cleaner
Total :
3. Manager
General manager
Vice General Manager
Managers
Management divisions
Total :
TOTAL OF PAYROLL
Above is the capacity needs
Q’ty
Salary
Total payroll
ĐV: x1000 VND
16
20
200
236
6,500
4,500
3,200
104,000
90,000
640,000
834,000
6
8
10
30
10
10
10
5
89
3,800
4,200
4,500
5,500
3,800
3,500
3,000
2,800
22,800
33,600
45,000
165,000
38,000
35,000
30,000
14,000
383,400
1
20,000
20,000
1
15,000
15,000
4
12,000
48,000
15
10,000
150,000
21
233,000
346
(c)
1,450,400
projected for the first year when the plant went into
operation. From year 2 onwards, depending on the business development company that
plans to recruit more suitable. In addition to maintaining the competitiveness of products in
the market, to apply new technologies, diversification of products. The company attaches
great importance to the issue of training, improve staff skills for their employees, and will
take a significant investment for overseas training, not only production but also on the
management, qualified international business.
Page 12 / 29
CHAPTER IV.
FINANCIAL ANALYSIS
I. DETERMINATION OF TOTAL CAPITAL INVESTMENT
7. Calculate Fixed capitals:
ITEMS
I. EQUIPMENT (a1)
1. Equipment for MDF line (a)
2. Cost of transport to delivery to factory site
3. Cost of insurance when transports (0,22% x 110% total)
4. Cost of insurance when installation (0,3% x 110% total)
5. Cost of testing (0,2% x Total)
II. CONSTRUCTION (b1)
1. Total of construction, design, testing
III. OFFICE EQIPMENT (d1)
1. Furniture
2. Computer and network
3. ERP software
IV. VEHICLE (v1)
1. Forklift, 4 pcs
2. Excavator, 2 pcs
3. Hino Van 13 T: 5 pc
4. SUV car: 01 pcs
Total (= a1+b1+d1+v1)
AMOUNTS
(ĐVT: x1000 VND)
760,027,388
748,970,030
5,500,000
1,812,507
2,246,910
1,497,940
117,538,450
117,538,450
2,750,000
650,000
500,000
1,600,000
2,600,000
800,000
400,000
500,000
900,000
882,915,838
8. Calculate the annual depreciation:
Cost of production equipment: depreciated steadily over 08 years.
Construction costs: depreciation is for 8 years.
The cost of office equipment: 4 years, means of transport: are amortized in 05 years.
Page 13 / 29
Table calculating depreciation: (Unit: x1000 VND)
Items
The total value of fixed
capital beginning of period
Depreciation of equipment
are linear in 8 years
Depreciation of construction
are linear in 8 years
Depreciation
of
office
equiment
are linear in 4 years
Depreciation of vehicle
are linear in 5 years
Total depreciation
Total end of period value of
fixed capital
Year 1
Year 2
Year 3
Year 4
Year 5
Year 6
Year 7
Year 8
882,915,838
772,012,609
661,109,380 550,206,151 439,302,922 329,087,193 219,391,464 109,695,735
95,003,423
95,003,423
95,003,423
95,003,423
95,003,423
95,003,423
95,003,423
95,003,423
14,692,306
14,692,306
14,692,306
14,692,306
14,692,306
14,692,306
14,692,306
14,692,306
687,500
687,500
687,500
687,500
520,000
520,000
520,000
520,000
110,903,229
110,903,229
110,903,229
109,695,72
9
109,695,72
109,695,729
9
772,012,609
661,109,380
550,206,151 439,302,922 329,087,193 219,391,464 109,695,735
520,000
110,903,229 110,215,729
Page 14 / 29
0
9. Calculate working capital:
Pursuant to the the cost of production and the annual production plan, calculate
the demand for working capital and working capital minimum amount necessary to
ensure the company's operations are not hampered as demand for reserves follows:
ITEMS
Materials stock (1 month)
Spare part stock (2 months)
Products in stock (1 months total cost)
Backup receivables ( 4% sales )
Cash (1 month payroll)
Total
AMOUNT
X 1000 VND
10,345,500
2,747,520
26,280,961.63
12,821,760
2,111,541
54,307,282
Total working capital for the project is necessary calculations : 54,307,282
10. Total Capitals Investment
Content
A. Fixed capital
B. Working capital
C. Total
Amount (x1000 VND)
882,915,838
54,307,282
937,223,120
II. CAPITAL RESOURCE
TABLE OF CAPITAL RESOURCE
No
1
2
3
Capital resource
Amout
Fixed Capital
882,915,838
Loan
750,478,462
Equity
132,437,376
Working capital
54,307,282
Loan
0
Equity
54,307,282
Total capital
937,223,120
Ratio
85%
15%
100%
0%
Equity:
- Fixed capital: 132,437,376 (x1000 VND) accounts for 15% of fixed capital
- Working capital: 54,307,282 (x1000 VND) accounts for 15% of working capital
Page 15 / 29
Loan:
Loans Vietnam Development Bank and commercial banks with the Bank's guarantee
development, Tenor 8 years, Total VNĐ 750,478,462 (x1000 VND), of which:
- Bank loans growth rate 6.9% / year: loan 529,749,503 (x1000 VND), 60% of fixed
capital.
- Loans from commercial banks at an interest rate of 10.5% / year: loan 220,728,959
(x1000 VND), 25% of fixed capital.
Page 16 / 29
DEBT REPAYMENT PLANNING TABLE:
Unit (x1000 VNĐ)
Year
Value initial
Loans in the period
- % Per Total Fixed
Capital
Interest rates
Payment
Original debt
Interest
Value end of period
Year 0
- % Per Total Fixed
Capital
Interest rates
Payment
Original debt
Interest
Value end of period
Total original debt
Total interest
Year 2
Year 3
Year 4
Year 5
Year 6
Year 7
Year 8
529,749,503
463,530,815
397,312,127
331,093,439
264,874,751
198,656,064
132,437,376
66,218,688
102,771,404
66,218,688
36,552,716
463,530,815
98,202,314
66,218,688
31,983,626
397,312,127
93,633,225
66,218,688
27,414,537
331,093,439
89,064,135
66,218,688
22,845,447
264,874,751
84,495,046
66,218,688
18,276,358
198,656,064
79,925,956
66,218,688
13,707,268
132,437,376
75,356,867
66,218,688
9,138,179
66,218,688
70,787,777
66,218,688
4,569,089
(0)
220,728,960
193,137,840
165,546,720
137,955,600
110,364,480
82,773,360
55,182,240
27,591,120
-
-
-
-
-
-
-
-
50,767,661
27,591,120
23,176,541
193,137,840
93,809,808
59,729,256
47,870,593
27,591,120
20,279,473
165,546,720
93,809,808
52,263,099
44,973,525
27,591,120
17,382,406
137,955,600
93,809,808
44,796,942
42,076,458
27,591,120
14,485,338
110,364,480
93,809,808
37,330,785
39,179,390
27,591,120
11,588,270
82,773,360
93,809,808
29,864,628
36,282,323
27,591,120
8,691,203
55,182,240
93,809,808
22,398,471
33,385,255
27,591,120
5,794,135
27,591,120
93,809,808
14,932,314
30,488,188
27,591,120
2,897,068
93,809,808
7,466,157
529,749,502
60%
6.9%
0
0
529,749,502
Value initial
Loans in the period
Year 1
220,728,959
.50
25%
10.50%
0
0
220,728,959
Page 17 / 29
III. FINANCIAL CALCULATE TABLE
1. Planned revenue
Reference price and the price of imported, MDF Quang Tri, MDF Gia Lai in the past
6 years, can determine the average price over the year as follows:
2007: From 220-230 USD/m3 2008: From 230-250 USD/m3
2009: From 260-280 USD/m3 2010: From 270-290 USD/m3
2011: From 290-320 USD/m3 2012: From 295-320 USD/m3
From early 2013 until now with the impact of global economic recession, the average
price decreased MDF (15%) compared with the same period in 2012. MDF average import
price from 280-295 USD/m3
Unless the inflation rate, product price assumptions carefully project is 280 USD/m3
(as in the case of economic slowdown lasts), exchange rate 21,200 VND/USD, equivalent
to 5,936, 000 VND/m3.
The average occupancy rate of the plant is 108,000 m3. By carefully, assuming the
project is only running 50% capacity in the first year, and 20% more capacity for the next
year. Table 5 of revenue for the first year of operation:
Year
Capacity forecast (m3)
Performance (%)
Price (x1000 VNĐ/m3)
Revenue (x1000 VNĐ)
1
54,000
50%
5,936
320,544,000
2
3
75,600
97,200
70%
90%
5,936
5,936
448,761,600 576,979,200
4
108,000
100%
5,936
641,088,000
5
108,000
100%
5,936
641,088,000
2. Planed cost of Production :
a) Material Cost:
Material, Fuel
Unit
Consumption for
108,000
m3
products
Unit price
Amount
Log
Ton
82,080
900
73,872,000
Urea formaldehyde
Ton
8,360
7,600
63,536,000
Ammonium Chloride
Ton
228
12,000
2,736,000
Chemical buffer
Ton
228
12,000
2,736,000
Page 18 / 29
Paraffin
Ton
1,140
22,000
25,080,000
Electricity
KW
37,800,000
1.680
63,504,000
Water
M3
108,000
4
432,000
Fuel
Mega Cal
164,160
100
16,416,000
Total material, fuel cost for 108.000 m3 products
248,312,000
Total material, fuel cost for 1 m3 products
2,299.19
b) Table of material and fuel cost:
Year 1
Output (m3)
Price x1000 VNĐ/m3
Amounts (x1000 VNĐ)
Year 2
Year 3
Year 4
Year 5
54,000
75,600
97,200
108,000
108,000
2,299
2,299
2,299
2,299
2,299
173,818,400
223,480,800
124,156,000
248,312,000 248,312,000
c) Payroll, Training cost
Monthly wages (refer to table HR needs): total monthly salary in year 1 is 1,450,400
(x1000 VND). Salary increases above is consistent with the expansion of business over the
years. However, growth rates are in line with the growth of production and wage costs are
lower in cost estimates. Assertions such salary increases are possible and acceptable.
According to estimates, the wage bill increased by 10% / year.
Calculating payroll Annual Fund the annual salary is 13 times the salary of the
month. This represents the minimum salary demands required in the development of
human resources:
Salary expenses in year 1 = 1,450,400 x 13 = 18,855,200 (thousand)
Insurance + 1 year = 18,855,200 x 19% = 3,582,488 (thousand)
Cost of annual training: training cost depends on the business of the Company and
expected market development. Estimated cost of training as follows:
Training costs in the country: 60% of monthly salary fund:
1,450,400 x 60% = 870,240 (thousand VND)
The cost of training abroad: 40% of monthly salary fund.
1,450,400 x 40% = 580 160 (thousand VND)-
Page 19 / 29
Table of salary and training cost:
Unit: (x1000 VND)
Insurance
Year 1
1,450,400
18,855,200
3,582,488
Year 2
1,595,440
20,740,720
3,940,737
Year 3
1,754,984
22,814,792
4,334,810
Year 4
1,930,482
25,096,271
4,768,292
Year 5
2,123,531
27,605,898
5,245,121
Training cost
- Domestic
- Aboard
Total
870,240
580,160
25,338,488
957,264
638,176
27,872,337
1,052,990
701,994
30,659,570
1,158,289
772,193
33,725,528
1,274,118
849,412
37,098,080
Monthly salary
Annual salary
d) Other cost
Output (m3)
remaining value(x1000 VND)
Revenue (x1000 VND)
Spare part: USD 1,2 / m3
(X1000 VND)
Maintenance costs, equipment
maintenance, plant
= 2%
Remaining value
Packaging cost: $US 2,2 / m3
(x1000 VND)
Marketing, delivery cost,
10% sale first year, 7% for 2nd
year and 5% for next year)
Insurance
factory
remaining value
0,4%
Year 1
Year 2
54,000
75,600
772,012,609 661,109,380
320,544,000 448,761,600
Year 3
Year 4
Year 5
97,200
108,000
108,000
550,206,151 439,302,922 329,087,193
576,979,200 641,088,000 641,088,000
1,373,760
1,923,264
2,472,768
2,747,520
2,747,520
15,440,252
13,222,188
11,004,123
8,786,058
6,581,744
2,518,560
3,525,984
4,533,408
5,037,120
5,037,120
32,054,400
31,413,312
28,848,960
32,054,400
32,054,400
3,088,050
2,644,438
2,200,825
1,757,212
1,316,349
Other cost: 1% the total cost including the cost of travel, telephone, reception,
stationery. etc…
Page 20 / 29
Total cost of production: (Unit: x1000 VND)
YEAR 1
Cost of Material, fuel
Salary, training cost
Spare part cost
Maintenance cost
Packaging cost
Marketing and delivery cost
Insurance factory
Depreciation
Interest
Land rent
Infrastructure IP cost
Other 1%
Total
2
3
4
5
6
7
124,146,000 173,804,400 223,462,800 248,292,000 248,292,000 248,292,000 248,292,000
25,338,488
27,872,337
30,659,570
33,725,528
37,098,080
40,807,888
44,888,677
1,373,760
1,923,264
2,472,768
2,747,520
2,747,520
2,747,520
2,747,520
15,440,252
13,222,188
11,004,123
8,786,058
6,581,744
4,387,829
2,193,915
2,518,560
3,525,984
4,533,408
5,037,120
5,037,120
5,037,120
5,037,120
32,054,400
31,413,312
28,848,960
32,054,400
32,054,400
32,054,400
32,054,400
3,088,050
2,644,438
2,200,825
1,757,212
1,316,349
877,566
438,783
110,903,229 110,903,229 110,903,229 110,903,229 110,215,729 109,695,729 109,695,729
59,729,256
52,263,099
44,796,942
37,330,785
29,864,628
22,398,471
14,932,314
339,200
339,200
339,200
339,200
339,200
339,200
339,200
169,600
169,600
169,600
169,600
169,600
169,600
169,600
3,751,008
4,180,811
4,593,914
4,811,427
4,737,164
4,668,073
4,607,893
378,851,804 422,261,861 463,985,339 485,954,079 478,453,534 471,475,397 465,397,150
Page 21 / 29
8
248,292,000
49,377,544
2,747,520
5,037,120
32,054,400
109,695,729
7,466,157
339,200
169,600
4,551,793
459,731,063
3. Estimated profit and loss:
The company's net profit is depreciation and repayment priority. The financial ratio that the business will become more efficient,
because in the later stage the business has achieved stability, reducing indirect costs, increase production and reduce interest costs.
Investment projects in the "List of preferential investment fields" as follows:
Corporate Income Tax: free 03 years and 50% of the tax for the next 05 years.
Unit (x1000 VNĐ)
YEAR
Total revenue
Total cost
Income tax
Profit after tax
1
320,544,000
378,851,804
(58,307,804)
2
448,761,600
422,261,861
26,499,739
3
576,979,200
463,985,339
112,993,861
4
641,088,000
485,954,079
19,391,740
135,742,181
5
641,088,000
478,453,534
20,329,308
142,305,158
6
641,088,000
471,475,397
21,201,575
148,411,028
7
641,088,000
465,397,150
21,961,356
153,729,494
8
641,088,000
459,731,063
22,669,617
158,687,320
Income gross
Mandatory reserve fund
Benefits and bonus fund
(58,307,804)
(58,307,804)
26,499,739
132,499
132,499
264,997
25,969,744
112,993,861
564,969
564,969
1,129,939
110,733,984
155,133,921
678,711
678,711
1,357,422
133,027,337
162,634,466
711,526
711,526
1,423,052
139,459,055
169,612,603
742,055
742,055
1,484,110
145,442,807
175,690,850
768,647
768,647
1,537,295
150,654,904
181,356,937
793,437
793,437
1,586,873
155,513,573
24%
16%
82%
25%
17%
85%
Business Development fund
Retained Earnings
Financial ratio
Return on Sale (ROS)
Return on Assets
Return on Equity
-18%
-6%
-31%
6%
3%
14%
20%
12%
61%
21%
14%
73%
Page 22 / 29
22%
15%
76%
23%
16%
79%
4. Project cash flow and financial indicator
1
NO
I
1
2
2
3
4
CASH FROM OPERATION
TOTAL INCOME : CASH FROM
SALES
TOTAL OUT
-
320,544,000
448,761,600
576,979,200
641,088,000
Expenses goods sold
-
378,851,804
422,261,861
463,985,339
485,954,079
-
(58,307,804)
26,499,739
112,993,861
155,133,921
-
-
-
-
-
NET
CASH
OPERATION
FLOW
II
CASH FROM INVESTMENT
1
TOTAL INCOME
FROM
5
641,088,00
0
478,453,53
4
162,634,46
6
-
6
641,088,000
471,475,397
169,612,603
-
7
641,088,00
0
465,397,15
0
175,690,85
181,356,93
0
7
-
-
TOTAL OUT
882,915,838
-
54,307,282
-
(937,223,120)
LOAN
Shareholder
Working capital
NET
CASH
INVESTMENT
1
459,731,06
3
54,307,282
Fixed assets
III
641,088,00
0
Received from working capital
2
8
FLOW
FROM
-
-
-
-
-
-
-
-
-
-
-
-
-
-
54,307,282
750,478,462
-
-
-
-
-
-
-
-
132,437,376
-
-
-
-
-
-
-
CASH FROM FINANCING
TOTAL INCOME
Depreciation
110,903,229
110,903,229
110,903,229
110,903,229
Page 23 / 29
110,215,72
9
109,695,729
109,695,72
9
109,695,72
9
2
TOTAL OUT
Original debts
-
93,809,808
93,809,808
93,809,808
93,809,808
93,809,808
93,809,808
93,809,808
93,809,808
Income tax
-
-
-
-
19,391,740
20,329,308
21,201,575
21,961,356
22,669,617
Cash FLOW from financing
882,915,838
17,093,421
17,093,421
17,093,421
(2,298,319)
(3,923,387)
(5,315,654)
(6,075,435)
(6,783,696)
IV
CASH ON BEGINNING of period
(54,307,282)
(54,307,282)
(95,521,665)
78,158,777
230,994,380
389,705,459
554,002,408
723,617,823
V
CASH ON ENDING of period
(54,307,282)
(95,521,665)
(51,928,505)
230,994,380
389,705,459
554,002,408
723,617,823
952,498,346
(51,928,505
)
78,158,777
Page 24 / 29
IV. CALCULATION OF EFFECTIVE RATIOS
1. Average cost of capital and inflation consideration
Average cost of financial resources used:
Weigh/total
Capital from shareholder
Loan
- Long term VDP
- Long term
Cost
Cost/total
19.93%
14.00%
2.79%
6,90%
56.52%
6.90%
3.90%
10,50%
23.55%
10.50%
2.47%
Average cost of capital
100,00%
9.16%
Capital raised from shareholders discounted at the cost of capital is 15% / year. The
cost is consistent with common opportunity cost in Vietnam.
Cost of long-term loans discounted at the interest rate of the bank respectively 6.9% /
year and 10.5% / year.
Average cost of capital is calculated using the weighted average formula.
However, in analyzing financial performance - economics of the project will use a
discount factor of K = 14%. The difference of 14% - 9:16% = 4.84% to compensate for
factors of exchange rate movements and inflation
2. Net Present Value of Project,
Year
Year 0
Year 1
Year 2
Year 3
Year 4
Year 5
Year 6
Year 7
Year 8
Capital
Net return
-937,223,120
-95,521,665
-51,928,505
78,158,777
230,994,380
389,705,459
554,002,408
723,617,823
952,498,346
Discount
factor
NPV
14% 1,089,355,108
0.877192982
(83,790,934)
0.769467528
(39,957,298)
0.674971516
52,754,948
0.592080277
136,767,217
0.519368664
202,400,804
0.455586548
252,396,044
0.399637323
289,184,689
0.350559055
333,906,920
We observe that NPV and IRR of the project is very high that investment is very
effective.
3. Payback period with discounted: