- Trang chủ >>
- Khoa Học Tự Nhiên >>
- Vật lý
Remote sensing and GIS integration
Bạn đang xem bản rút gọn của tài liệu. Xem và tải ngay bản đầy đủ của tài liệu tại đây (11.03 MB, 433 trang )
Remote Sensing and
GIS Integration
Theories, Methods,
and Applications
Qihao Weng, Ph.D.
New York Chicago San Francisco
Lisbon London Madrid Mexico City
Milan New Delhi San Juan
Seoul Singapore Sydney Toronto
Copyright © 2010 by The McGraw-Hill Companies, Inc. All rights reserved. Except as permitted under the
United States Copyright Act of 1976, no part of this publication may be reproduced or distributed in any
form or by any means, or stored in a database or retrieval system, without the prior written permission of
the publisher.
ISBN: 978-0-07-160654-7
MHID: 0-07-160654-8
The material in this eBook also appears in the print version of this title: ISBN: 978-0-07-160653-0, MHID:
0-07-160653-X.
All trademarks are trademarks of their respective owners. Rather than put a trademark symbol after every
occurrence of a trademarked name, we use names in an editorial fashion only, and to the benefit of the
trademark owner, with no intention of infringement of the trademark. Where such designations appear in
this book, they have been printed with initial caps.
McGraw-Hill eBooks are available at special quantity discounts to use as premiums and sales promotions,
or for use in corporate training programs. To contact a representative please e-mail us at
Information contained in this work has been obtained by The McGraw-Hill Companies, Inc.
(“McGraw-Hill”) from sources believed to be reliable. However, neither McGraw-Hill nor its authors
guarantee the accuracy or completeness of any information published herein, and neither McGraw-Hill nor
its authors shall be responsible for any errors, omissions, or damages arising out of use of this information.
This work is published with the understanding that McGraw-Hill and its authors are supplying information
but are not attempting to render engineering or other professional services. If such services are required,
the assistance of an appropriate professional should be sought.
TERMS OF USE
This is a copyrighted work and The McGraw-Hill Companies, Inc. (“McGraw-Hill”) and its licensors
reserve all rights in and to the work. Use of this work is subject to these terms. Except as permitted under
the Copyright Act of 1976 and the right to store and retrieve one copy of the work, you may not decompile,
disassemble, reverse engineer, reproduce, modify, create derivative works based upon, transmit, distribute,
disseminate, sell, publish or sublicense the work or any part of it without McGraw-Hill’s prior consent. You
may use the work for your own noncommercial and personal use; any other use of the work is strictly
prohibited. Your right to use the work may be terminated if you fail to comply with these terms.
THE WORK IS PROVIDED “AS IS.” McGRAW-HILL AND ITS LICENSORS MAKE NO GUARANTEES OR WARRANTIES AS TO THE ACCURACY, ADEQUACY OR COMPLETENESS OF OR
RESULTS TO BE OBTAINED FROM USING THE WORK, INCLUDING ANY INFORMATION THAT
CAN BE ACCESSED THROUGH THE WORK VIA HYPERLINK OR OTHERWISE, AND EXPRESSLY DISCLAIM ANY WARRANTY, EXPRESS OR IMPLIED, INCLUDING BUT NOT LIMITED TO
IMPLIED WARRANTIES OF MERCHANTABILITY OR FITNESS FOR A PARTICULAR PURPOSE.
McGraw-Hill and its licensors do not warrant or guarantee that the functions contained in the work will
meet your requirements or that its operation will be uninterrupted or error free. Neither McGraw-Hill nor
its licensors shall be liable to you or anyone else for any inaccuracy, error or omission, regardless of cause,
in the work or for any damages resulting therefrom. McGraw-Hill has no responsibility for the content of
any information accessed through the work. Under no circumstances shall McGraw-Hill and/or its
licensors be liable for any indirect, incidental, special, punitive, consequential or similar damages that result
from the use of or inability to use the work, even if any of them has been advised of the possibility of such
damages. This limitation of liability shall apply to any claim or cause whatsoever whether such claim or
cause arises in contract, tort or otherwise.
Contents
Foreword . . . . . . . . . . . . . . . . . . . . . . . . . . . . . . . . . . .
ix
Preface . . . . . . . . . . . . . . . . . . . . . . . . . . . . . . . . . . . . . xiii
Acknowledgments . . . . . . . . . . . . . . . . . . . . . . . . . . . xvii
1
2
Principles of Remote Sensing and Geographic
Information Systems (GIS) . . . . . . . . . . . . . . . . . . . .
1.1 Principles of Remote Sensing . . . . . . . . . . . . . .
1.1.1 Concept of Remote Sensing . . . . . . . .
1.1.2 Principles of Electromagnetic
Radiation . . . . . . . . . . . . . . . . . . . . . . . .
1.1.3 Characteristics of Remotely
Sensed Data . . . . . . . . . . . . . . . . . . . . .
1.1.4 Remote Sensing Data Interpretation
and Analysis . . . . . . . . . . . . . . . . . . . . .
1.2 Principles of GIS . . . . . . . . . . . . . . . . . . . . . . . .
1.2.1 Scope of Geographic Information
System and Geographic
Information Science . . . . . . . . . . . . . . .
1.2.2 Raster GIS and Capabilities . . . . . . . .
1.2.3 Vector GIS and Capabilities . . . . . . . .
1.2.4 Network Data Model . . . . . . . . . . . . .
1.2.5 Object-Oriented Data Model . . . . . . .
References . . . . . . . . . . . . . . . . . . . . . . . . . . . . . . . . . .
Integration of Remote Sensing and Geographic
Information Systems (GIS) . . . . . . . . . . . . . . . . . . . .
2.1 Methods for the Integration between
Remote Sensing and GIS . . . . . . . . . . . . . . . . .
2.1.1 Contributions of Remote
Sensing to GIS . . . . . . . . . . . . . . . . . . .
2.1.2 Contributions of GIS to Remote
Sensing . . . . . . . . . . . . . . . . . . . . . . . . .
2.1.3 Integration of Remote Sensing
and GIS for Urban Analysis . . . . . . . .
2.2 Theories of the Integration . . . . . . . . . . . . . . . .
2.2.1 Evolutionary Integration . . . . . . . . . .
2.2.2 Methodological Integration . . . . . . . .
2.2.3 The Integration Models . . . . . . . . . . . .
2.3 Impediments to Integration
and Probable Solutions . . . . . . . . . . . . . . . . . . .
1
1
1
2
5
8
21
21
23
25
29
30
31
43
43
44
46
49
51
51
52
53
57
iii
iv
Contents
2.3.1
Conceptual Impediments
and Probable Solutions . . . . . . . . . . . .
2.3.2 Technical Impediments
and Probable Solutions . . . . . . . . . . . .
2.4 Prospects for Future Developments . . . . . . . .
2.4.1 Impacts of Computer, Network, and
Telecommunications Technologies . . . .
2.4.2 Impacts of the Availability of
Very High Resolution Satellite
Imagery and LiDAR Data . . . . . . . . . .
2.4.3 Impacts of New Image-Analysis
Algorithms . . . . . . . . . . . . . . . . . . . . . .
2.5 Conclusions . . . . . . . . . . . . . . . . . . . . . . . . . . . .
References . . . . . . . . . . . . . . . . . . . . . . . . . . . . . . . . . .
3
4
Urban Land Use and Land Cover Classification . . . .
3.1 Incorporation of Ancillary Data for
Improving Image Classification Accuracy . . .
3.2 Case Study: Landsat Image-Housing Data
Integration for LULC Classification
in Indianapolis . . . . . . . . . . . . . . . . . . . . . . . . . .
3.2.1 Study Area . . . . . . . . . . . . . . . . . . . . . .
3.2.2 Datasets Used . . . . . . . . . . . . . . . . . . . .
3.2.3 Methodology . . . . . . . . . . . . . . . . . . . .
3.2.4 Accuracy Assessment . . . . . . . . . . . . .
3.3 Classification Result by Using Housing
Data at the Pre-Classification Stage . . . . . . . .
3.4 Classification Result by Integrating
Housing Data during the Classification . . . . .
3.5 Classification Result by Using Housing
Data at the Post-Classification Stage . . . . . . .
3.6 Summary . . . . . . . . . . . . . . . . . . . . . . . . . . . . . . .
References . . . . . . . . . . . . . . . . . . . . . . . . . . . . . . . . . .
Urban Landscape Characterization
and Analysis . . . . . . . . . . . . . . . . . . . . . . . . . . . . . . . . .
4.1 Urban Landscape Analysis with
Remote Sensing . . . . . . . . . . . . . . . . . . . . . . . . .
4.1.1 Urban Materials, Land Cover,
and Land Use . . . . . . . . . . . . . . . . . . . .
4.1.2 The Scale Issue . . . . . . . . . . . . . . . . . . .
4.1.3 The Image “Scene Models” . . . . . . . .
4.1.4 The Continuum Model of Urban
Landscape . . . . . . . . . . . . . . . . . . . . . . .
4.1.5 Linear Spectral Mixture Analysis
(LSMA) . . . . . . . . . . . . . . . . . . . . . . . . .
57
61
68
68
71
73
78
78
91
92
95
95
96
98
105
105
109
111
112
114
117
118
118
120
121
121
123
Contents
4.2
Case Study: Urban Landscape Patterns
and Dynamics in Indianapolis . . . . . . . . . . . .
4.2.1 Image Preprocessing . . . . . . . . . . . . . .
4.2.2 Image Endmember Development . . .
4.2.3 Extraction of Impervious Surfaces . . . .
4.2.4 Image Classification . . . . . . . . . . . . . .
4.2.5 Urban Morphologic Analysis Based
on the V-I-S Model . . . . . . . . . . . . . . . .
4.2.6 Landscape Change and the V-I-S
Dynamics . . . . . . . . . . . . . . . . . . . . . . .
4.2.7 Intra-Urban Variations and the V-I-S
Compositions . . . . . . . . . . . . . . . . . . . .
4.3 Discussion and Conclusions . . . . . . . . . . . . . .
References . . . . . . . . . . . . . . . . . . . . . . . . . . . . . . . . . .
5
6
Urban Feature Extraction . . . . . . . . . . . . . . . . . . . . . .
5.1 Landscape Heterogeneity and Per-Field
and Object-Based Image Classifications . . . .
5.2 Case Study: Urban Feature Extraction
from High Spatial-Resolution Satellite
Imagery . . . . . . . . . . . . . . . . . . . . . . . . . . . . . . . .
5.2.1 Data Used . . . . . . . . . . . . . . . . . . . . . . .
5.2.2 Image Segmentation . . . . . . . . . . . . . .
5.2.3 Rule-Based Classification . . . . . . . . . .
5.2.4 Post-Classification Refinement
and Accuracy Assessment . . . . . . . . .
5.2.5 Results of Feature Extraction . . . . . . .
5.3 Discussion . . . . . . . . . . . . . . . . . . . . . . . . . . . . . .
5.4 Conclusions . . . . . . . . . . . . . . . . . . . . . . . . . . . .
References . . . . . . . . . . . . . . . . . . . . . . . . . . . . . . . . . .
Building Extraction from LiDAR Data . . . . . . . . . .
6.1 The LiDAR Technology . . . . . . . . . . . . . . . . . .
6.2 Building Extraction . . . . . . . . . . . . . . . . . . . . . .
6.3 Case Study . . . . . . . . . . . . . . . . . . . . . . . . . . . . .
6.3.1 Datasets . . . . . . . . . . . . . . . . . . . . . . . . .
6.3.2 Generation of the Normalized
Height Model . . . . . . . . . . . . . . . . . . . .
6.3.3 Object-Oriented Building
Extraction . . . . . . . . . . . . . . . . . . . . . . .
6.3.4 Accuracy Assessment . . . . . . . . . . . . .
6.3.5 Strategies for Object-Oriented
Building Extraction . . . . . . . . . . . . . . .
6.3.6 Error Analysis . . . . . . . . . . . . . . . . . . . .
6.4 Discussion and Conclusions . . . . . . . . . . . . . .
References . . . . . . . . . . . . . . . . . . . . . . . . . . . . . . . . . .
125
125
125
127
130
130
134
139
157
160
165
166
169
169
169
170
171
173
173
178
179
183
185
186
188
188
189
192
196
197
201
205
206
v
vi
Contents
7
8
9
Urban Land Surface Temperature Analysis . . . . . .
7.1 Remote Sensing Analysis of Urban
Land Surface Temperatures . . . . . . . . . . . . . . .
7.2 Case Study: Land-Use Zoning and LST
Variations . . . . . . . . . . . . . . . . . . . . . . . . . . . . . .
7.2.1 Satellite Image Preprocessing . . . . . .
7.2.2 LULC Classification . . . . . . . . . . . . . . .
7.2.3 Spectral Mixture Analysis . . . . . . . . . .
7.2.4 Estimation of LSTs . . . . . . . . . . . . . . . .
7.2.5 Statistical Analysis . . . . . . . . . . . . . . . .
7.2.6 Landscape Metrics Computation . . .
7.2.7 Factors Contributing
to LST Variations . . . . . . . . . . . . . . . . .
7.2.8 General Zoning, Residential Zoning,
and LST Variations . . . . . . . . . . . . . . .
7.2.9 Seasonal Dynamics
of LST Patterns . . . . . . . . . . . . . . . . . . .
7.3 Discussion and Conclusions: Remote
Sensing–GIS Integration in Urban
Land-Use Planning . . . . . . . . . . . . . . . . . . . . . .
References . . . . . . . . . . . . . . . . . . . . . . . . . . . . . . . . . .
209
210
211
211
212
213
215
218
219
225
234
237
240
242
Surface Runoff Modeling and Analysis . . . . . . . . .
8.1 The Distributed Surface Runoff Modeling . . .
8.2 Study Area . . . . . . . . . . . . . . . . . . . . . . . . . . . . .
8.3 Integrated Remote Sensing–GIS Approach
to Surface Runoff Modeling . . . . . . . . . . . . . . .
8.3.1 Hydrologic Parameter Determination
Using GIS . . . . . . . . . . . . . . . . . . . . . . .
8.3.2 Hydrologic Modeling
within the GIS . . . . . . . . . . . . . . . . . . .
8.4 Urban Growth in the Zhujiang Delta . . . . . . .
8.5 Impact of Urban Growth on
Surface Runoff . . . . . . . . . . . . . . . . . . . . . . . . . .
8.6 Impact of Urban Growth on Rainfall-Runoff
Relationship . . . . . . . . . . . . . . . . . . . . . . . . . . . .
8.7 Discussion and Conclusions . . . . . . . . . . . . . .
References . . . . . . . . . . . . . . . . . . . . . . . . . . . . . . . . . .
247
248
251
Assessing Urban Air Pollution Patterns . . . . . . . . .
9.1 Relationship between Urban Air Pollution
and Land-Use Patterns . . . . . . . . . . . . . . . . . . .
9.2 Case Study: Air Pollution Pattern
in Guangzhou, China, 1980–2000 . . . . . . . . . .
9.2.1 Study Area: Guangzhou, China . . . . .
9.2.2 Data Acquisition and Analysis . . . . .
267
253
253
257
257
259
261
263
264
268
270
270
272
Contents
10
11
9.2.3 Air Pollution Patterns . . . . . . . . . . . . .
9.2.4 Urban Land Use and Air Pollution
Patterns . . . . . . . . . . . . . . . . . . . . . . . . .
9.2.5 Urban Thermal Patterns
and Air Pollution . . . . . . . . . . . . . . . . .
9.3 Summary
..............................
9.4 Remote Sensing–GIS Integration for Studies
of Urban Environments . . . . . . . . . . . . . . . . . .
References . . . . . . . . . . . . . . . . . . . . . . . . . . . . . . . . . .
275
Population Estimation . . . . . . . . . . . . . . . . . . . . . . . .
10.1 Approaches to Population Estimation
with Remote Sensing–GIS Techniques . . . . . .
10.1.1 Measurements of Built-Up Areas . . . .
10.1.2 Counts of Dwelling Units . . . . . . . . .
10.1.3 Measurement of Different Land-Use
Areas
..........................
10.1.4 Spectral Radiance . . . . . . . . . . . . . . . .
10.2 Case Study: Population Estimation Using
Landsat ETM+ Imagery . . . . . . . . . . . . . . . . . .
10.2.1 Study Area and Datasets . . . . . . . . . .
10.2.2 Methods . . . . . . . . . . . . . . . . . . . . . . . .
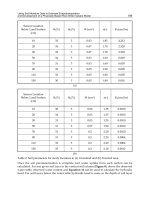
10.2.3 Result of Population Estimation
Based on a Non-Stratified Sampling
Method . . . . . . . . . . . . . . . . . . . . . . . . .
10.2.4 Result of Population Estimation
Based on Stratified Sampling
Method . . . . . . . . . . . . . . . . . . . . . . . . .
10.3 Discussion . . . . . . . . . . . . . . . . . . . . . . . . . . . . .
10.4 Conclusions . . . . . . . . . . . . . . . . . . . . . . . . . . . .
References . . . . . . . . . . . . . . . . . . . . . . . . . . . . . . . . . . .
295
Quality of Life Assessment . . . . . . . . . . . . . . . . . . . .
11.1 Assessing Quality of Life . . . . . . . . . . . . . . . . .
11.1.1 Concept of QOL . . . . . . . . . . . . . . . . . .
11.1.2 QOL Domains and Models . . . . . . . .
11.1.3 Application of Remote Sensing
and GIS in QOL Studies . . . . . . . . . . .
11.2 Case Study: QOL Assessment in Indianapolis
with Integration of Remote Sensing
and GIS . . . . . . . . . . . . . . . . . . . . . . . . . . . . . . . .
11.2.1 Study Area and Datasets . . . . . . . . . .
11.2.2 Extraction of Socioeconomic
Variables from Census Data . . . . . . .
11.2.3 Extraction of Environmental
Variables . . . . . . . . . . . . . . . . . . . . . . . .
283
288
291
291
292
296
296
299
300
301
303
303
303
308
313
320
321
322
327
328
328
329
330
331
331
332
332
vii
viii
Contents
11.2.4
Statistical Analysis and Development
of a QOL Index . . . . . . . . . . . . . . . . . .
11.2.5 Geographic Patterns of Environmental
and Socioeconomic Variables . . . . . .
11.2.6 Factor Analysis Results . . . . . . . . . . .
11.2.7 Result of Regression Analysis . . . . . .
11.3 Discussion and Conclusions . . . . . . . . . . . . . .
References . . . . . . . . . . . . . . . . . . . . . . . . . . . . . . . . . . .
12
13
Urban and Regional Development . . . . . . . . . . . . .
12.1 Regional LULC Change . . . . . . . . . . . . . . . . . .
12.1.1 Definitions of Land Use
and Land Cover . . . . . . . . . . . . . . . . . .
12.1.2 Dynamics of Land Use and Land
Cover and Their Interplay . . . . . . . . .
12.1.3 Driving Forces in LULC Change . . .
12.2 Case Study: Urban Growth
and Socioeconomic Development
in the Zhujiang Delta, China . . . . . . . . . . . . . .
12.2.1 Urban Growth Analysis . . . . . . . . . . .
12.2.2 Driving Forces Analysis . . . . . . . . . . .
12.2.3 Urban LULC Modeling . . . . . . . . . . .
12.2.4 Urban Growth in the Zhujiang
Delta, 1989–1997 . . . . . . . . . . . . . . . . .
12.2.5 Urban Growth and Socioeconomic
Development . . . . . . . . . . . . . . . . . . . .
12.2.6 Major Types of Urban Expansion . . .
12.2.7 Summary . . . . . . . . . . . . . . . . . . . . . . .
12.3 Discussion: Integration of Remote Sensing
and GIS for Urban Growth Analysis . . . . . . .
References . . . . . . . . . . . . . . . . . . . . . . . . . . . . . . . . . . .
Public Health Applications . . . . . . . . . . . . . . . . . . . .
13.1 WNV Dissemination and Environmental
Characteristics . . . . . . . . . . . . . . . . . . . . . . . . . .
13.2 Case Study: WNV Dissemination
in Indianapolis, 2002–2007 . . . . . . . . . . . . . . . .
13.2.1 Data Collection and Preprocessing . . .
13.2.2 Plotting Epidemic Curves . . . . . . . . .
13.2.3 Risk Area Estimation . . . . . . . . . . . . .
13.2.4 Discriminant Analysis . . . . . . . . . . . .
13.2.5 Results . . . . . . . . . . . . . . . . . . . . . . . . .
13.3 Discussion and Conclusions . . . . . . . . . . . . . .
References . . . . . . . . . . . . . . . . . . . . . . . . . . . . . . . . . . .
Index
.......................................
333
334
335
341
342
343
345
345
346
346
348
350
350
350
351
352
355
357
359
359
360
363
364
365
365
368
368
368
369
377
379
383
Foreword
W
hen Qihao Weng asked me to write a foreword to his book,
I had two immediate reactions. I was, of course, at first
flattered and honored by his invitation but when I read
further in his letter I shockingly realized that 20 years had gone by
since Geoffrey Edwards, Yvan Bédard, and I published our paper
on the integration of remote sensing and GIS in Photogrammetric
Engineering & Remote Sensing (PE&RS). Twenty years is a long time
in a fast-moving field such as ours that is concerned with geospatial
data collection, management, analysis, and dissemination. I am very
excited that Qihao had the enthusiasm, the stamina, and, last but not
the least, the time to compile a comprehensive summary of the status
of GIS/remote sensing integration today.
When Geoff, Yvan, and I wrote our paper it was not only the first
partially theoretical article on the integration of the two very separate
technologies at that time, but it was also meant to be a statement for
the forthcoming National Center for Geographic Information and
Analysis (NCGIA) Initiative 12: Integration of Remote Sensing and
GIS. The leading scientists for this initiative—Jack Estes, Dave
Simonett, Jeff Star, and Frank Davis—were all from the University of
California at Santa Barbara NCGIA site, so I thought that we had to
do something to prove our value to this group of principal scientists.
To my delight, we achieved the desired result.
Actually, the making of this paper started to some degree by
accident. Geoff Edwards discovered that he and I had both submitted
papers with very similar titles and content to the GIS National
Conference in Ottawa and asked me if we could combine our efforts.
I immediately agreed and saw the chance to publish a research article
in the upcoming special PE&RS issue on GIS. Geoff and Yvan worked
at Laval University in Quebec, I was at the University of Maine in
Orono, and, at this very important time, we all worked with
Macintoshes and sent our files back and forth through the Internet
without being concerned with data conversion issues.
When I look back upon those times, I ponder the research questions
that we thought were the most pressing ones 20 years ago. How many
ix
x
Foreword
of them have been solved by now, how many of them still exist, and
how many new ones have appeared in the meantime? Is there still a
dichotomy between GIS and remote sensing/image processing? Are
the scientific communities that are concerned with the development of
GIS and remote sensing still separated? Are data formats, conversion,
and the lack of standards still the most pressing research questions? Is
it not that we are used to switch from map view to satellite picture to
bird’s eye view or street view by a simple click in our geobrowser?
Has not Google Earth taught us a lesson that technology can produce
seamless geospatial databases from diverse datasets including, and
relying on, remote sensing images that act as the backbone for geographic orientation? Do we not expect to be linked to geospatial
databases through UMTS, wireless LAN, or hotspots wherever we
are? Have we not seen a sharp increase in the use of remotely sensed
data with the advent of very high resolution satellites and digital aerial
cameras? In one sentence: Have we solved all problems that are
associated with the integration of remote sensing and GIS?
It is here that Qihao Weng’s book takes up this issue at a scientific
level. His book presents the progress that we have made with respect to
theories, methods, and applications. He also points out the shortcomings
and new research questions that have arisen from new technologies and
developments. Twenty years ago, we did not mention GPS, LiDAR, or
the Internet as driving forces for geospatial progress. Now, we have to
rethink our research questions, which often stem from new technologies
and applications that always seem to be ahead of theories and thorough
methodological analyses. Especially, the application part of this book
looks at case studies that are methodically arranged into certain areas. It
reveals how many applications are nowadays based on the cooperation
of remote sensing with other geospatial data. As a matter of fact, it is
hard to see any geospatial analysis field that does not benefit from
incorporating remotely sensed data. On the other hand, it is also true
that the results of automated interpretation of remotely sensed images
have greatly been improved by an integrated analysis with diverse
geospatial and attribute data managed in a GIS.
In 1989, when Geoff Edwards, Yvan Bédard, and I wrote our
paper on the integration of remote sensing and GIS, these two
technologies were predominantly separated from, or even antagonistic
to, each other. Today, this dichotomy no longer exists. GISs incorporate
remotely sensed images as an integral part of their geospatial databases
and image processing systems incorporate GIS analysis capabilities
in their processing software. I even doubt that the terms GIS (for data
processing) and remote sensing (for data collection) hold the same
importance now as they did 20 years ago. We have seen over the last
10 to 15 years the emergence of a new scientific discipline that
encompasses these two technologies. Whether we refer to this field as
geospatial science, geographic information science, geomatics, or geoinformatics, one thing is consistent: remote sensing, image analysis,
and GIS are part of this discipline.
Foreword
I congratulate Qihao Weng on accomplishing the immense task
that he undertook in putting this book together. We now have the
definitive state-of-the-art book on remote sensing/GIS integration.
Twenty years from now, it will probably serve as the reference point
from which to start the next scientific progress report. I will certainly
use his book in my remote sensing and GIS classes.
Manfred Ehlers
University of Osnabrück
Osnabrück, Germany
xi
This page intentionally left blank
Preface
O
ver the past three to four decades, there has been an explosive increase in the use of remotely sensed data for various
types of resource, environmental, and urban studies. The
evolving capability of geographic information systems (GIS) makes it
possible for computer systems to handle geospatial data in a more
efficient and effective way. The attempt to take advantage of these
data and modern geospatial technologies to investigate natural and
human systems and to model and predict their behaviors over time
has resulted in voluminous publications with the label integration.
Indeed, since the 1990s, the remote sensing and GIS literature witnessed a great deal of research efforts from both the remote sensing
and GIS communities to push the integration of these two related
technologies into a new frontier of scientific inquiry.
Briefly, the integration of remote sensing and GIS is mutually
beneficial for the following two reasons: First, there has been a
tremendous increase in demand for the use of remotely sensed data
combined with cartographic data and other data gathered by GIS,
including environmental and socioeconomic data. Products derived
from remote sensing are attractive to GIS database development
because they can provide cost-effective large-coverage data in a
raster data format that are ready for input into a GIS and convertible
to a suitable data format for subsequent analysis and modeling
applications. Moreover, remote sensing systems usually collect data
on multiple dates, making it possible to monitor changes over time
for earth-surface features and processes. Remote sensing also can
provide information about certain biophysical parameters, such as
object temperature, biomass, and height, that is valuable in assessing
and modeling environmental and resource systems. GIS as a modeling
tool needs to integrate remote sensing data with other types of geospatial data. This is particularly true when considering that cartographic data produced in GIS are usually static in nature, with most
being collected on a single occasion and then archived. Remotely sensed
data can be used to correct, update, and maintain GIS databases. Second,
it is still true that GIS is a predominantly data-handling technology,
whereas remote sensing is primarily a data-collection technology.
xiii
xiv
Preface
Many tasks that are quite difficult to do in remote sensing image
processing systems are relatively easy in a GIS, and vice versa. In a
word, the need for the combined use of remotely sensed data and
GIS data and for the joint use of remote sensing (including digital
image processing) and GIS functionalities for managing, analyzing,
and displaying such data leads to their integration.
This year marks the twentieth anniversary of the publishing of
the seminal paper on integration by Ehlers and colleagues (1989), in
which the perspective of an evolutionary integration of three stages
was presented. In December 1990, the National Center for Geographic
Information and Analysis (NCGIA) launched a new research initiative,
namely, Initiative 12: Integration of Remote Sensing and GIS. The
initiative was led by Drs. John Estes, Frank Davis, and Jeffrey Star
and was closed in 1993. The objectives of the initiative were to
identify impediments to the fuller integration of remote sensing and
GIS, to develop a prioritized research agenda to remove those
impediments, and to conduct or facilitate research on the topics of
highest priority. Discussions were concentrated around five issues:
institutional issues, data structures and access, data processing flow,
error analysis, and future computing environments. (See www.ncgia.
ucsb.edu/research/initiatives.html.) The results of the discussions
were published in a special issue of Photogrammetric Engineering &
Remote Sensing in 1991 (volume 57, issue 6).
In nearly two decades, we witnessed many new opportunities
for combining ever-increasing computational power, modern telecommunications technologies, more plentiful and capable digital
data, and more advanced analytical algorithms, which may have
generated impacts on the integration of remote sensing and GIS for
environmental, resource, and urban studies. It would be interesting
to examine the progress being made by, problems still existing for,
and future directions taken by the current technologies of computers,
communications, data, and analysis. I decided to put together such
a book to reflect part of my work over the past 10 years and found
it challenging, at the beginning, to determine what, how, and why
materials should or should not be engaged.
This book addresses three interconnected issues: theories, methods,
and applications for the integration of remote sensing and GIS. First,
different theoretical approaches to integration are examined. Specifically, this book looks at such issues as the levels, methodological
approaches, and models of integration. The review then goes on to
investigate practical methods for the integrated use of remote sensing
and GIS data and technologies. Based on theoretical and methodological issues, this book next examines the current impediments, both
conceptually and technically, to integration and their possible solutions.
Extensive discussions are directed toward the impact of computers,
networks, and telecommunications technologies; the impact of the
availability of high-resolution satellite images and light detection and
Preface
ranging (LiDAR) data; and, finally, the impact of new image-analysis
algorithms on integration. The theoretical discussions end with my
perspective on future developments. A large portion of this book is
dedicated to showcasing a series of application areas involving the
integration of remote sensing and GIS. Each application area starts
with an analysis of state-of-the-art methodology followed by a detailed
presentation of a case study. The application areas include urban landuse and land-cover mapping, landscape characterization and analysis,
urban feature extraction, building extraction with LiDAR data, urban
heat island and local climate analysis, surface runoff modeling and
analysis, the relationship between air quality and land-use patterns,
population estimation, quality-of-life assessment, urban and regional
development, and public health.
Qihao Weng, Ph.D.
xv
This page intentionally left blank
Acknowledgments
M
y interest in the topic of the integration of remote sensing
and GIS can be traced back to the 1990s when I studied at
the University of Georgia under the supervision of the late
Dr. Chor-Pang Lo. He strongly encouraged me to take this research
direction for my dissertation. I am grateful for his encouragement
and continued support until he passed away in December 2007. In
the spring of 2008, I was granted a sabbatical leave. A long-time
collaborator, Dr. Dale Quattrochi, invited me to come to work with
him, but the NASA fellowship did not come in time for my leave. Just
at the moment of relaxation, a friend at McGraw-Hill, Mr. Taisuke
Soda, sent me an invitation to write a book on the integration of
remote sensing and GIS.
I wish to extend my most sincere appreciation to several recent
Indiana State University graduates who have contributed to this book.
Listed in alphabetical order, they are: Ms. Jing Han, Dr. Xuefei Hu,
Dr. Guiying Li, Dr. Bingqing Liang, Dr. Hua Liu, and Dr. Dengsheng
Lu. I thank them for data collection and analysis and for drafting
some of the chapters. My collaborator, Dr. Xiaohua Tong of Tongji
University at Shanghai, contributed to the writing of Chapters 2
and 6. Drs. Paul Mausel, Brain Ceh, Robert Larson, James Speer,
Cheng Zhao, and Michael Angilletta, who are or were on the faculty
of Indiana State University, reviewed earlier versions of some of the
chapters.
My gratitude further goes to Professor Manfred Ehlers, University
of Osnabrück, Germany, who was kind enough to write the Foreword
for this book. His seminal works on the integration of remote sensing
and GIS have always inspired me to pursue this evolving topic.
Finally, I am indebted to my family, to whom this book is dedicated,
for their enduring love and support.
It is my hope that the publication of this book will provide
stimulation to students and researchers to conduct more in-depth work
and analysis on the integration of remote sensing and GIS. In the course
of writing this book, I felt more and more like a student again, wanting
to focus my future study on this very interesting topic.
xvii
About the Author
Qihao Weng is a professor of
geography and the director
of the Center for Urban and
Environmental Change at
Indiana State University. He
is also a guest/adjunct professor at Wuhan University
and Beijing Normal University,
and a guest research scientist
at the Beijing Meteorological
Bureau. From 2008 to 2009, he
visited NASA as a senior research fellow. He earned a
Ph.D. in geography from the University of Georgia. At
Indiana State, Dr. Weng teaches courses on remote
sensing, digital image processing, remote sensing–GIS
integration, and GIS and environmental modeling. His
research focuses on remote sensing and GIS analysis of
urban ecological and environmental systems, land-use
and land-cover change, urbanization impacts, and
human-environment interactions. In 2006 he received
the Theodore Dreiser Distinguished Research Award,
Indiana State’s highest faculty research honor. Dr. Weng
is the author of more than 100 peer-reviewed journal
articles and other publications.
CHAPTER
1
Principles of
Remote Sensing
and Geographic
Information
Systems (GIS)
T
his chapter introduces to the principles of remote sensing and
geographic information systems (GIS). Because there are many
textbooks of remote sensing and GIS, the readers of this book
may take a closer look at any topic discussed in this chapter if interested. It is my intention that only the most recent pertinent literature
is included. The purpose for these discussions on remote sensing and
GIS principles is to facilitate the discussion on the integration of
remote sensing and GIS set forth in Chap. 2.
1.1
Principles of Remote Sensing
1.1.1
Concept of Remote Sensing
Remote sensing refers to the activities of recording, observing, and perceiving (sensing) objects or events in far-away (remote) places. In
remote sensing, the sensors are not in direct contact with the objects
or events being observed. Electromagnetic radiation normally is used
as the information carrier in remote sensing. The output of a remote
sensing system is usually an image representing the scene being
observed. A further step of image analysis and interpretation is
required to extract useful information from the image. In a more
restricted sense, remote sensing refers to the science and technology of
acquiring information about the earth’s surface (i.e., land and ocean)
1
2
Chapter One
and atmosphere using sensors onboard airborne (e.g., aircraft or balloons) or spaceborne (e.g., satellites and space shuttles) platforms.
Depending on the scope, remote sensing may be broken down
into (1) satellite remote sensing (when satellite platforms are used),
(2) photography and photogrammetry (when photographs are used
to capture visible light), (3) thermal remote sensing (when the thermal infrared portion of the spectrum is used), (4) radar remote sensing (when microwave wavelengths are used), and (5) LiDAR remote
sensing (when laser pulses are transmitted toward the ground and
the distance between the sensor and the ground is measured based
on the return time of each pulse).
The technology of remote sensing evolved gradually into a scientific subject after World War II. Its early development was driven
mainly by military uses. Later, remotely sensed data became widely
applied for civil applications. The range of remote sensing applications includes archaeology, agriculture, cartography, civil engineering, meteorology and climatology, coastal studies, emergency
response, forestry, geology, geographic information systems, hazards,
land use and land cover, natural disasters, oceanography, water
resources, and so on. Most recently, with the advent of high spatialresolution imagery and more capable techniques, urban and related
applications of remote sensing have been rapidly gaining interest in
the remote sensing community and beyond.
1.1.2
Principles of Electromagnetic Radiation
Remote sensing takes one of the two forms depending on how the
energy is used and detected. Passive remote sensing systems record
the reflected energy of electromagnetic radiation or the emitted
energy from the earth, such as cameras and thermal infrared detectors. Active remote sensing systems send out their own energy and
record the reflected portion of that energy from the earth’s surface,
such as radar imaging systems.
Electromagnetic radiation is a form of energy with the properties of a wave, and its major source is the sun. Solar energy traveling in the form of waves at the speed of light (denoted as c and
equals to 3 × 10⁸ ms–1) is known as the electromagnetic spectrum. The
waves propagate through time and space in a manner rather like
water waves, but they also oscillate in all directions perpendicular
to their direction of travel. Electromagnetic waves may be characterized by two principal measures: wavelength and frequency. The
wavelength λ is the distance between successive crests of the
waves. The frequency μ is the number of oscillations completed
per second. Wavelength and frequency are related by the following equation:
C=λ×μ
(1.1)
Principles of Remote Sensing and GIS
red
blue
UV
green
0.4 0.5 0.6 0.7(μm)
Near-infrared
Visible
Wavelength
(μm) 10–6 10–5 10–4 10–3 10–2 10–1
1
10
102
(1 mm)
103 104
105
Wavelength (μm)
(1 m)
106 107 108 109
icr
e
av
ow
ys
ra
n
io
vis
le
Te nd
a dio
ra
M
ys
ra
ys
ra
ic
IR
al
m
er
Th -IR
id
M r-IR
a
V)
Ne le t (U
sib le
Vi avio
tr
ul
x-
y-
sm
Co
FIGURE 1.1 Major divisions of the electromagnetic spectrum.
The electromagnetic spectrum, despite being seen as a continuum
of wavelengths and frequencies, is divided into different portions by
scientific convention (Fig. 1.1). Major divisions of the electromagnetic
spectrum, ranging from short-wavelength, high-frequency waves to
long-wavelength, low-frequency waves, include gamma rays, x-rays,
ultraviolet (UV) radiation, visible light, infrared (IR) radiation, microwave radiation, and radiowaves.
The visible spectrum, commonly known as the rainbow of colors
we see as visible light (sunlight), is the portion of the electromagnetic
spectrum with wavelengths between 400 and 700 billionths of a meter
(0.4–0.7 μm). Although it is a narrow spectrum, the visible spectrum
has a great utility in satellite remote sensing and for the identification
of different objects by their visible colors in photography.
The IR spectrum is the region of electromagnetic radiation that
extends from the visible region to about 1 mm (in wavelength). Infrared waves can be further partitioned into the near-IR, mid-IR, and
far-IR spectrum, which includes thermal radiation. IR radiation can
be measured by using electronic detectors. IR images obtained by
sensors can yield important information on the health of crops and
can help in visualizing forest fires even when they are enveloped in
an opaque curtain of smoke.
Microwave radiation has a wavelength ranging from approximately 1 mm to 30 cm. Microwaves are emitted from the earth, from
objects such as cars and planes, and from the atmosphere. These
microwaves can be detected to provide information, such as the temperature of the object that emitted the microwave. Because their wavelengths are so long, the energy available is quite small compared with
visible and IR wavelengths. Therefore, the fields of view must be large
enough to detect sufficient energy to record a signal. Most passive
microwave sensors thus are characterized by low spatial resolution.
Active microwave sensing systems (e.g., radar) provide their own
source of microwave radiation to illuminate the targets on the ground.
3
4
Chapter One
A major advantage of radar is the ability of the radiation to penetrate
through cloud cover and most weather conditions owing to its long
wavelength. In addition, because radar is an active sensor, it also can
be used to image the ground at any time during the day or night.
These two primary advantages of radar, all-weather and day or night
imaging, make radar a unique sensing system.
The electromagnetic radiation reaching the earth’s surface is partitioned into three types by interacting with features on the earth’s surface. Transmission refers to the movement of energy through a surface.
The amount of transmitted energy depends on the wavelength and is
measured as the ratio of transmitted radiation to the incident radiation,
known as transmittance. Remote sensing systems can detect and record
both reflected and emitted energy from the earth’s surface. Reflectance
is the term used to define the ratio of the amount of electromagnetic
radiation reflected from a surface to the amount originally striking the
surface. When a surface is smooth, we get specular reflection, where all
(or almost all) of the energy is directed away from the surface in a single direction. When the surface is rough and the energy is reflected
almost uniformly in all directions, diffuse reflection occurs. Most features of the earth’s surface lie somewhere between perfectly specular
or perfectly diffuse reflectors. Whether a particular target reflects specularly or diffusely or somewhere in between depends on the surface
roughness of the feature in comparison with the wavelength of the
incoming radiation. If the wavelengths are much smaller than the surface variations or the particle sizes that make up the surface, diffuse
reflection will dominate. Some electromagnetic radiation is absorbed
through electron or molecular reactions within the medium. A portion
of this energy then is reemitted, as emittance, usually at longer wavelengths, and some of it remains and heats the target.
For any given material, the amount of solar radiation that reflects,
absorbs, or transmits varies with wavelength. This important property of matter makes it possible to identify different substances or features and separate them by their spectral signatures (spectral curves).
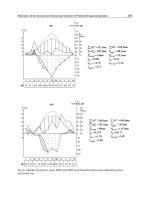
Figure 1.2 illustrates the typical spectral curves for three major terrestrial features: vegetation, water, and soil. Using their reflectance differences, we can distinguish these common earth-surface materials.
When using more than two wavelengths, the plots in multidimensional space tend to show more separation among the materials. This
improved ability to distinguish materials owing to extra wavelengths
is the basis for multispectral remote sensing.
Before reaching a remote sensor, the electromagnetic radiation has
to make at least one journey through the earth’s atmosphere and two
journeys in the case of active (i.e., radar) systems or passive systems
that detect naturally occurring reflected radiation. Each time a ray
passes through the atmosphere, it undergoes absorption and scattering. Absorption is mostly caused by three types of atmospheric gasses,
that is, ozone, carbon dioxide, and water vapor. The electromagnetic
Principles of Remote Sensing and GIS
Vegetation
% Reflectance
40
Soil
20
Water
0.5
1.0
2.0
Wavelength (μm)
FIGURE 1.2 Spectral signatures of water, vegetation, and soil.
radiation is absorbed and reradiated again in all directions and probably over a different range of wavelengths. Scattering is mainly caused
by N2 and O2 molecules, aerosols, fog particles, cloud droplets, and
raindrops. The electromagnetic radiation is lost by being redirected
out of the beam of radiation, but wavelength does not change. In either
case, the energy is attenuated in the original direction of the radiation’s propagation. However, there are certain portions of the electromagnetic spectrum that can pass through the atmosphere with little or
no attenuation. The four principal windows (by wavelength interval)
open to effective remote sensing from above the atmosphere include
(1) visible–near-IR (0.4–2.5 μm), (2) mid-IR (3–5 μm), (3) thermal IR
(8–14 μm), and (4) microwave (1–30 cm).
1.1.3
Characteristics of Remotely Sensed Data
Regardless of passive or active remote sensing systems, all sensing
systems detect and record energy “signals” from earth surface features and/or from the atmosphere. Familiar examples of remotesensing systems include aerial cameras and video recorders. More
complex sensing systems include electronic scanners, linear/area
arrays, laser scanning systems, etc. Data collected by these remote
sensing systems can be in either analog format (e.g., hardcopy aerial
photography or video data) or digital format (e.g., a matrix of
“brightness values” corresponding to the average radiance measured within an image pixel). Digital remote sensing images may be
input directly into a GIS for use; analog data also can be used in GIS
through an analog-to-digital conversion or by scanning. More often,
remote sensing data are first interpreted and analyzed through various methods of information extraction in order to provide needed
data layers for GIS. The success of data collection from remotely
5
6
Chapter One
sensed imagery requires an understanding of four basic resolution
characteristics, namely, spatial, spectral, radiometric, and temporal
resolution (Jensen, 2005).
Spatial resolution is a measurement of the minimum distance between
two objects that will allow them to be differentiated from one another in
an image and is a function of sensor altitude, detector size, focal size,
and system configuration (Jensen, 2005). For aerial photography, spatial
resolution is measured in resolvable line pairs per millimeter, whereas
for other sensors, it refers to the dimensions (in meters) of the ground
area that falls within the instantaneous field of view (IFOV) of a single
detector within an array or pixel size (Jensen, 2005). Spatial resolution
determines the level of spatial details that can be observed on the earth’s
surface. Coarse spatial resolution data may include a large number of
mixed pixels, where more than one land-cover type can be found within
a pixel. Whereas fine spatial resolution data considerably reduce the
mixed-pixel problem, they may increase internal variation within the
land-cover types. Higher resolution also means the need for greater
data storage and higher cost and may introduce difficulties in image
processing for a large study area. The relationship between the geographic scale of a study area and the spatial resolution of the remotesensing image has been explored (Quattrochi and Goodchild, 1997).
Generally speaking, on the local scale, high spatial-resolution imagery,
such as that employing IKONOS and QuickBird data, is more effective.
On the regional scale, medium-spatial-resolution imagery, such as that
employing Landsat Thematic Mapper/Enhanced Thematic Mapping
Plus (TM/ETM+) and Terra Advanced Spaceborne Thermal Emission
and Reflection Radiometer (ASTER) data, is used most frequently. On
the continental or global scale, coarse-spatial-resolution imagery, such
as that employing Advanced Very High Resolution Radiometer
(AHVRR) and Moderate Resolution Imaging Spectrometer (MODIS)
data, is most suitable.
Each remote sensor is unique with regard to what portion(s) of
the electromagnetic spectrum it detects. Different remote sensing
instruments record different segments, or bands, of the electromagnetic spectrum. Spectral resolution of a sensor refers to the number
and size of the bands it is able to record (Jensen, 2005). For example,
AVHRR, onboard National Oceanographic and Atmospheric Administration’s (NOAAs) Polar Orbiting Environmental Satellite (POES)
platform, collects four or five broad spectral bands (depending on
the individual instrument) in the visible (0.58–0.68 μm, red), near-IR
(0.725–1.1 μm), mid-IR (3.55–3.93 μm), and thermal IR portions
(10.3–11.3 and 11.5–12.5 μm) of the electromagnetic spectrum. AVHRR,
acquiring image data at the spatial resolution of 1.1 km at nadir, has
been used extensively for meteorologic studies, vegetation pattern analysis, and global modeling. The Landsat TM sensor collects seven spectral bands, including (1) 0.45–0.52 μm (blue), (2) 0.52–0.60 μm (green),
(3) 0.63–0.69 μm (red), (4) 0.76–0.90 μm (near-IR), (5) 1.55–1.75 μm