Intermediate algebra 4th edition by sullivan struve solution manual
Bạn đang xem bản rút gọn của tài liệu. Xem và tải ngay bản đầy đủ của tài liệu tại đây (7.14 MB, 64 trang )
Intermediate Algebra 4th edition by Michael Sullivan III, Katherine R.
Struve Solution Manual
Link full download solution manual: />
Chapter 2
2
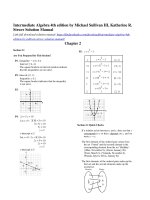
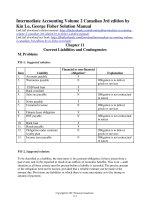
P5. y = x − 3
Section 2.1
Are You Prepared for This Section?
P1. Inequality: − 4 ≤ x ≤ 4
Interval: [−4, 4]
The square brackets in interval notation indicate
that the inequalities are not strict.
P2. Interval: [2, ∞)
Inequality: x ≥ 2
The square bracket indicates that the inequality
is not strict.
x
2
y=x −3
(x, y)
−2
2
y = (−2) − 3 = 1
(−2, 1)
−1
2
y = (−1) − 3 = −2
(−1, −2)
0
2
y = (0) − 3 = −3
(0, −3)
2
y = (1) − 3 = −2
2
y = (2) − 3 =
1
1
y
P3.
2
(1, −2)
(2, 1)
4
y
−4
4
x
(–2,
−4
1)
(2,
1)
1
x
1
(–1, –2)
P4. 2x + 5 y = 10
(0, –3)
Let x = 0 : 2 0 + 5y = 10
0 + 5y = 10
5y = 10
y=2
y-intercept is 2.
Let y = 0 : 2x + 5 0 = 10
2x + 0 = 10
2x = 10
x=5
x-intercept is 5.
y
6
−2
6
(5, 0)
Section 2.1 Quick Checks
If a relation exists between x and y, then say that x
corresponds to y or that y depends on x, and we
write x → y.
The first element of the ordered pair comes from
the set „Friend‟ and the second element is the
corresponding element from the set „Birthday‟.
{(Max, November 8), (Alesia, January 20),
(Trent, March 3), (Yolanda, November 8),
(Wanda, July 6), (Elvis, January 8)}
The first elements of the ordered pairs make up the
first set and the second elements make up the
second set.
(0, 2)
−2
(1, –2)
x
Domain
1
5
8
10
Range
3
4
13
ISM: Intermediate Algebra
Chapter 2: Relations, Functions, and More Inequalities
The domain of a relation is the set of all inputs of
the relation. The range is the set of all outputs of
the relation.
The domain is the set of all inputs and the range
is the set of all outputs. The inputs are the
elements in the set „Friend‟ and the outputs are
the elements in the set „Birthday‟.
Domain:
{Max, Alesia, Trent, Yolanda, Wanda, Elvis}
Range:
{January 20, March 3, July 6, November 8,
January 8}
To find the range, first determine the y-values for
which the graph exists. The graph exists for all yvalues on a real number line. Thus, the range is
y | y is any real number , or (−∞, ∞)
in interval notation.
y = 3x − 8
x
y = 3x − 8
x , y
− 1 y = 3 − 1 − 8 = − 11 − 1, − 11
y = 3 0 − 8 = − 8 0, − 8
0
1
y=31 −8=−5
1, − 5
y = 3 2 − 8 = − 2 2, − 2
2
The domain is the set of all inputs and the range
is the set of all outputs. The inputs are the first
elements in the ordered pairs and the outputs are
the second elements in the ordered pairs.
Domain:
Range:
{1, 5, 8, 10}
{3, 4, 13}
First notice that the ordered pairs on the graph
are (−2, 0), (−1, 2), (−1, −2), (2, 3), (3, 0), and
(4, −3).
The domain is the set of all x-coordinates and the
range is the set of all y-coordinates.
Domain:
Range:
{−2, −1, 2, 3, 4}
{−3, −2, 0, 2, 3}
True
4
−2
x
4
−8
Domain: x | x is any real number or −∞, ∞
To find the range, first determine the y-values
for which the graph exists. The graph exists for
all y-values between −2 and 2, inclusive. Thus,
the range is y | −2 ≤ y ≤ 2 , or [−2, 2] in
interval notation.
To find the domain, first determine the xvalues for which the graph exists. The graph
exists for all x-values on a real number line.
Thus, the domain is x | x is any real
number , or (−∞, ∞) in interval notation.
Range: y | y is any real number or −∞, ∞
2
y=x −8
−3
the domain is x | − 2 ≤ x ≤ 4 , or [−2, 4] in
interval notation.
3, 1
y
2
x , y
y=x −8
To find the domain, first determine the x-values
for which the graph exists. The graph exists for
all x-values between −2 and 4, inclusive. Thus,
y=3 3 −8=1
3
x
False
y=
−3
2
2
−2
y = −2 − 8 = −4
0
y = 0 − 8 = − 8
2
y = 2 − 8 = − 4
3
y= 3
2
2
2
−8=1
−8 =1
−3, 1
−2, − 4
0, − 8
2, − 4
3, 1
y
2
−
4
x
4
−8
Domain:
Range:
Copyright © 2018 Pearson Education, Inc.
x | x is any real number or (−∞, ∞)
y | y ≥ −8 or [−8, ∞)
121
Chapter 2: Relations, Functions, and More Inequalities
2
ISM: Intermediate Algebra
24.
x=y +1
2
−3
−3
0
0
3
3
x , y
− 2 x = − 2 + 1 = 5 5, − 2
− 1 x = −1 2 + 1 = 2 2, − 1
0 x = 0 2 + 1 = 1 1, 0
2
1 x = 1 + 1 = 2 2, 1
x=y
y
+1
2
Domain: {−3, 0, 3}
Range: {−3, 0, 3}
2
= +
2
x
2
1
=
5
5, 2
y
Domain: {−3, −2, −1, 1, 3}
Range: {−3, −1, 0, 1, 3}
⸀Ā ⸀
4
Ā ⸀
omain: x | − 3 ≤ x ≤ 3 or [−3, 3]
−2
Range: y | −2 ≤ y ≤ 4 or [−2, 4]
x
4
−4
Domain:
Domain: x | − 5 ≤ x ≤ 3 or [−5, 3]
x|x≥1
or [1, ∞)
Range: y | −1 ≤ y ≤ 3 or [−1, 3]
Range: y | y is any real number or (−∞, ∞)
Domain: x | x ≥ −2 or [−2, ∞)
Range: y | y ≥ −1 or [−1, ∞)
2.1 Exercises
{(30, $9), (35, $9), (40, $11), (45, $17)}
Domain: {30, 35, 40, 45}
Range: {$9, $11, $17}
{(Northeast, $59,210), (Midwest, $54,267),
(South, $49,655), (West, $57,688)} Domain:
{Northeast, Midwest, South, West} Range:
{$49,655, $54,267, $57,688, $59,210}
y = −4x + 2
x
−2
−1
y = − 4x + 2
y = − 4 −2 + 2 = 10
y = − 4 −1 + 2 = 6
0
1
y = −4 0 + 2 = 2
y = − 4 1 + 2 = −2
2
y = − 4 2 + 2 = −6
x , y
−2, 10
−1, 6
0, 2
1, − 2
2, − 6
y
20.
−2
−1
0
1
6
10
3
0
−3
2
Domain: {−2, −1, 0, 1, 2}
Range: {−3, 0, 3, 6}
22.
−2
−1
0
1
2
x
−5
5
−10
Domain: x | x is a real number or (−∞, ∞)
Range: y | y is a real number or (−∞, ∞)
−8
−1
0
1
8
Domain: {−2, −1, 0, 1, 2}
Range: {−8, −1, 0, 1, 8}
122
Copyright © 2018 Pearson Education, Inc.
Ā ⸀
ISM: Intermediate Algebra
y=−
Chapter 2: Relations, Functions, and More Inequalities
1
2
y=x −2
x+
22
1
x
y= − 2x+2
−4
y = − 2 − 4 + 2 = 4
−2
y = − 2 −2 + 2 = 3
1
1
1
0 + 2 =
0
y=−2
2
y = − 2 2 + 2 = 1
1
1
4
2
4 + 2 =
y=−2
0
x , y
−4, 4
−2, 3
0, 2
2, 1
2
x
y=x −2
−3
y = − 3 − 2 = 7
−2
y = −2 − 2 = 2
0
y = 0 − 2 = − 2
2
y = 2 − 2 = 2
3
y = 3 − 2 = 7
2
2
2
2
2
x , y
−3, 7
−2, 2
0, − 2
2, 2
3, 7
y
4, 0
y
5
5
−5
5
x
−5
x
5
Domain: x | x is a real number or (−∞, ∞)
−5
Domain: x | x is a real number or (−∞, ∞)
Range: y | y is a real number or (−∞, ∞)
Range: y | y ≥ −2 or [−2, ∞)
2
y = −2x + 8
x
3x+y=9
= −3 x + 9
−2
2
y = −2x + 8
2
y = − 2 − 2 + 8 = 0
2
y = − 2 −1 + 8 = 6
2
y = − 2 0 + 8 = 8
2
y = −2 1 + 8 = 6
2
y = −2 2 + 8 = 0
x
y=−3x+9
x , y
−1
−1
0
1
2
3
y = −3 −1 + 9 = 12
y=−30+9=9
y = −3 1 + 9 = 6
y=−32+9=3
y = −3 3 + 9 = 0
− 1, 12
0, 9
1, 6
2, 3
3, 0
0
1
2
−1, 6
0, 8
1, 6
2, 0
y
10
−5
5
x
−10
x
−5
y
8
x , y
−2, 0
5
Domain: x | x is a real number or (−∞, ∞)
−4
Domain: x | x is a real number or (−∞, ∞)
Range: y | y ≤ 8 or (−∞, 8]
Range: y | y is a real number or (−∞, ∞)
Copyright © 2018 Pearson Education, Inc.
123
Chapter 2: Relations, Functions, and More Inequalities
y= x−2
x
−4
−2
0
2
4
ISM: Intermediate Algebra
y=−x
x, y
−4, 2
−2, 0
0, − 2
2, 0
4, 2
y= x −2
y = −4 − 2 = 2
y= −2 − 2= 0
y= 0 −2=−2
y= 2 −2=0
y= 4 −2=2
y=−x
−3
y = − − 3 = 27
−2
y=−−2 =8
3
3
−1
5
3
y=−
3
−1, 1
3
y=−0 =0
0
0, 0
= −1
1
y=− 1
2
y = − 2 = −8
3
y = − 3 = − 27
3
3
1, − 1
2, − 8
3, − 27
y
x
−5
15
Domain: x | x is a real number or (−∞, ∞)
−4
Range: y | y ≥ −2 or [−2, ∞)
x , y
−4, − 4
−2, − 2
0, 0
2, − 2
4, − 4
y = −x
x
−4 y=− −4 = −4
−2 y=− −2 = − 2
y= − 0= 0
0
y=−2=−2
2
y=−4=−4
4
y
5
Domain: x | x is a real number or (−∞, ∞)
Range: y | y is a real number or (−∞, ∞)
3
y=x −2
3
x
y=x −2
−3
y = − 3 − 2 = − 29
−2
y = −2 − 2 = −10
3
3
5
x
4
−15
y=−x
−5
x, y
−3, 27
−2, 8
−1 =1
5
3
x
y
−5
3
y= −1
0
y = 0 − 2 = − 2
− 2 = −3
3
Domain: x | x is a real number or (−∞, ∞)
−1
x
−5
3
3
x , y
−3, − 29
− 2, − 10
− 1, − 3
0, − 2
−2=−1
1
y=1
2
y = 2 − 2 = 6
3
y = 3 − 2 = 25
3
3
1, − 1
2, 6
3, 25
y
Range: y | y ≤ 0 or (−∞, 0]
30
−5
5
x
−30
Domain: x | x is a real number or (−∞, ∞)
Range: y | y is a real number or (−∞, ∞)
124
Copyright © 2018 Pearson Education, Inc.
ISM: Intermediate Algebra
2
x
+y=5
Chapter 2: Relations, Functions, and More Inequalities
According to the graph: Domain: x |
x ≥ 0 or [0, ∞] Range: y | −4 < y
≤ 10 or (−4, 10]
2
=−x +5
2
x
y=−x +5
−3
y=−−3 +5=−4
x , y
− 3, − 4
2
2
−2
y = − −2
+5=1
−2, 1
0
y=−0 +5=5
0, 5
2
y=− 2
3
y=−3 +5=−4
2
2
Actual graphs will vary but each graph should be a
vertical line.
The four methods for describing a relation are
maps, ordered pairs, graph, and equations.
Ordered pairs are appropriate if there is a finite
number of values in the domain. If there is an
infinite (or very large) number of elements in the
domain, a graph is more appropriate.
+5=1
2, 1
2
3, − 4
y
5
Section 2.2
Are You Prepared for This Section?
−5
5
x
P1. a.
Let x = 1:
2x
−5
Domain: x | x is a real number or (−∞, ∞)
2
− 5x = 21
216 − 20
32 − 20
12
2
x=y +2
2
x=y +2
−2
x = −2 + 2 = 6
2
2
x, y
6, − 2
x = −1
0
x = 0 + 2 = 2
1
x= 1 +2=3
3, 1
2
x = 2 + 2 = 6
6, 2
2
+ 2= 3
2
2x
2
3, − 1
− 5x = 2 −3
y
2
− 5 −3
2 9 + 15
18 + 15
33
2, 0
2
c. Let x = −3:
−1
− 51 = 2 − 5 = −3
Let x = 4:
2
2
2x − 5x = 2 4 − 5 4
Range: y | y ≤ 5 or (−∞, 5]
y
2
3
P2.
2x + 1
3
3
3
1
2 − 2 + 1 = − 1+ 1 = 0 is undefined.
5
−
−
P3. Inequality: x ≤ 5
Interval: (−∞, 5]
x
5
2
P4. Interval: (2, ∞)
5
Domain: x | x ≥ 2 or [2, ∞)
Range: y | y is a real number or (−∞, ∞)
According to the graph: Domain: x |
0 ≤ x ≤ 6 or [0, 6] Range: y | 0 ≤
y ≤ 196 or [0, 196]
Set notation: x | x > 2
The inequality is strict since the parenthesis
was used instead of a square bracket.
Section 2.2 Quick Checks
A function is a relation in which each element in
the domain of the relation corresponds to exactly
one element in the range of the relation.
Copyright © 2018 Pearson Education, Inc.
125
Chapter 2: Relations, Functions, and More Inequalities
False
ISM: Intermediate Algebra
f(x) = 3x + 2
f(−2) = 3(−2) + 2 = −6 + 2 = −4
The relation is a function because each element
in the domain (Friend) corresponds to exactly
one element in the range (Birthday).
Domain: {Max, Alesia, Trent, Yolanda, Wanda,
Elvis}
Range: {January 20, March 3, July 6,
November 8, January 8}
The relation is not a function because there is an
element in the domain, 210, that corresponds to
more than one element in the range. If 210 is
selected from the domain, a single sugar content
cannot be determined.
The relation is a function because there are no
ordered pairs with the same first coordinate but
different second coordinates.
Domain: {−3, −2, −1, 0, 1}
Range: {0, 1, 2, 3}
The relation is not a function because there are
two ordered pairs, (−3, 2) and (−3, 6), with the
same first coordinate but different second
coordinates.
y = −2x + 5
The relation is a function since there is only one
output than can result for each input.
y = ±3x
The relation is not a function since a single input
for x will yield two output values for y. For
example, if x = 1, then y = ±3.
2
y = x + 5x
The relation is a function since there is only one
output than can result for each input.
True
The graph is that of a function because every
vertical line will cross the graph in at most one
point.
2
g (x ) = −2x
+x+3
2
g( − 3) = − 2( − 3) + ( −3) + 3
− 2( 9) − 3 + 3
− 18 − 3 + 3
−18
g ( x ) = −2 x
g(1) = −2(1)
2
2
+x+3
+1+3
−2(1) + 1 + 3
−2 + 1 + 3
2
2
In the function H ( q ) = 2 q − 5 q + 1, H is
called the dependent variable, and q is called
the independent variable or argument.
f(x)=2x−5
( x − 2) = 2( x − 2) − 5
2x−4−5
2x−9
f ( x ) − f (2) = [2 x − 5] − [2(2) − 5]
2 x − 5 − ( −1)
2x−5+1
2x−4
When only the equation of a function f is given,
the domain of f is the set of real numbers x for
which f(x) is a real number.
2
f(x)=3x +2
The function squares a number x, multiplies it by
3, and then adds 2. Since these operations can be
performed on any real number, the domain of f is
the set of all real numbers. The domain can be
written as
x | x is any real number , or (−∞, ∞) in
interval notation.
The graph is not that of a function because a
vertical line can cross the graph in more than one
point.
f (x ) = 3x + 2 f (x)
= 3(4) + 2
12 + 2
14
126
h x =
x+1
−3
The function h involves division. Since division
by 0 is not defined, the denominator x − 3 can
never be 0. Therefore, x can never equal 3. The
domain of h is {x|x ≠ 3}.
Copyright © 2018 Pearson Education, Inc.
Chapter 2: Relations, Functions, and More Inequalities
ISM: Intermediate Algebra
2
A r = πr
Since r represents the radius of the circle, it must
take on positive values. Therefore, the domain is
{r|r > 0}, or (0, ∞) in interval notation.
a. Independent variable: t (number of days)
Dependent variable: A (square miles)
2
A t = 0.25πt
2
A 30 = 0.25π 30 ≈ 706.86 sq. miles
After oil has been leaking for 30 days, the
circular oil slick will cover about 706.86
square miles.
2.2 Exercises
Function. Each animal in the domain
corresponds to exactly one gestation period in
the range.
Domain: Cat, Dog, Goat, Pig, Rabbit
Range: {31, 63, 115, 151}
Not a function. The domain element A for the
exam grade corresponds to two different study
times in the range.
Domain: {A, B, C, D}
Range: {1, 3.5, 4, 5, 6}
6x − 3y = 12
−3y = − 6x + 12
= −6x + 12
y
−3
= 2x − 4
Since there is only one output y that can result
from any given input x, this relation is a
function.
2
y = ±2x
Since a given input x can result in more than one
output y, this relation is not a function.
3
y=x −3
Since there is only one output y that can result
from any given input x, this relation is a
function.
2
y =x
Since a given input x can result in more than one
output y, this relation is not a function. For
2
example, if x = 1 then y = 1 which means that
= 1 or y = −1.
Not a function. The graph fails the vertical line
test so it is not the graph of a function.
Function. There are no ordered pairs that have
the same first coordinate, but different second
coordinates.
Domain: {−1, 0, 1, 2}
Range: {−2, −5, 1, 4}
Not a function. The graph fails the vertical line
test so it is not the graph of a function.
Not a function. Each ordered pair has the same
first coordinate but different second coordinates.
Domain: −2
Range: {−3, 1, 3, 9}
Not a function. The graph fails the vertical line
test so it is not the graph of a function.
Function. The graph passes the vertical line test
so it is the graph of a function.
a. f(0) = 3(0) + 1 = 0 + 1 = 1
f(3) = 3(3) + 1 = 9 + 1 = 10
Function. There are no ordered pairs that have
the same first coordinate but different second
coordinates.
Domain: {−5, −2, 5, 7}
Range: {−3, 1, 3}
y = −6x + 3
Since there is only one output y that can result
from any given input x, this relation is a
function.
f(−2) = 3(−2) + 1 = −6 + 1 = −5
a. f(0) = −2(0) − 3 = 0 − 3 = −3
f(3) = −2(3) − 3 = −6 − 3 = −9
f(−2) = −2(−2) − 3 = 4 − 3 = 1
58. a.
2
f (0) = 2(0) + 5(0) = 2(0) + 0 = 0
Copyright © 2018 Pearson Education, Inc.
127
Chapter 2: Relations, Functions, and More Inequalities
2
f (3) = 2(3) + 5(3)
2(9) + 5(3)
18 + 15
33
72. h q =
2
2
+ 2(3) − 5 = −9 + 6 − 5 = −8
2
f ( −2) = −( − 2) + 2( − 2) − 5
−4 − 4 − 5
−13
a. f(−x) = 4(−x) + 3 = −4x + 3
f ( x + 2) = 4( x + 2) + 3 = 4 x + 8 + 3 = 4 x + 11
f(2x) = 4(2x) + 3 = 8x + 3
−f(x) = −(4x + 3) = −4x − 3
f(x + h) = 4(x + h) + 3 = 4x + 4h + 3
a. f(−x) = 8 − 3(−x) = 8 + 3x
f(x + 2) = 8 − 3(x + 2) = 8 − 3x − 6 = 2 − 3x
q+2
G x = − 8x + 3
Since each operation in the function can be
performed for any real number, the domain of
the function is all real numbers.
Domain: x | x is a real number or (−∞, ∞)
H x =
x+5
2x + 1
The function involves division by 2x + 1. Since
division by 0 is not defined, the denominator can
never equal 0.
2x + 1 = 0
2x = −1
x=− 1
2
1
Domain: x x ≠ −
2
2
78. s t = 2t − 5t + 1
Since each operation in the function can be
performed for any real number, the domain of
the function is all real numbers.
Domain: t | t is a real number or (−∞, ∞)
1
f(2x) = 8 − 3(2x) = 8 − 6x
H q =
−f(x) = −(8 − 3x) = −8 + 3x
The function involves division by 6q + 5. Since
division by 0 is not defined, the denominator can
never equal 0.
6q + 5 = 0
6q = −5
f(x + h) = 8 − 3(x + h) = 8 − 3x − 3h
f x = − 2x
2
+x+1
2
− 3 = − 2 − 3 + −3 + 1
− 2 9 − 3 + 1
−20
gh=−h
2
6q
+5
q=−
5
6
Domain: q
q≠−
5
6
+ 5h − 1
2
g4=−4 +54−1
−16 + 20 − 1
3
Gz=2z+5
G −6 = 2 − 6 + 5 = 2 − 1 = 2 ⋅ 1 = 2
128
2
2
+ 2( 0) − 5 = 0 + 0 − 5 = −5
f (3) = −( 3)
3q
h 2 = 3 2 = 3 4 = 3
2+2
4
2
f ( −2) = 2( −2) + 5( −2)
2( 4) + 5( −2)
8 + ( −10)
−2
a. f ( 0) = −( 0)
ISM: Intermediate Algebra
82. f x = − 2x
2
+ 5x + C ; f − 2 = −15
2
− 15 = − 2 −2 + 5 − 2 + C
− 15 = − 2 4 − 10 + C
− 15 = − 8 − 10 + C
− 15 = − 18 + C
3=C
Copyright © 2018 Pearson Education, Inc.
ISM: Intermediate Algebra
84.
Chapter 2: Relations, Functions, and More Inequalities
f x = − x + B ; f 3 = −1
A h =
x−5
−1=
−3+B
3−5
Domain: h | h > 0 or (0, ∞)
−2
2 = −3 + B
5=B
1
h
2
Since the height must have a positive length, the
domain is all positive real numbers.
−1=−3+B
A=
5
G p = 350 + 0.12 p
Since price will not be negative and there is no
necessary upper limit, the domain is all non-
bh 2
If b = 8 cm, we have A h =
1
negative real numbers, or p | p ≥ 0 or [0, ∞).
8 h = 4h.
2
A 5 = 4 5 = 20 square centimeters
Let p = price of items sold, and
G = gross weekly salary.
Answers may vary. For values of p that are
greater than $200, the revenue function will be
negative. Since revenue is nonnegative, values
greater than $200 are not in the domain.
a. f x = 3x + 7
G p = 250 + 0.15 p
G 10,000 = 250 + 0.1510,000 = 1750
Roberta‟s gross weekly salary is $1750.
x + h = 3 x + h + 7 = 3x + 3h + 7
x + h − f x = 3x + 3h + 7 − 3x + 7
h
a. The dependent variable is the number of
housing units, N, and the independent
variable is the number of rooms, r.
2
N 3 = − 1.33 3 + 14.68 3 − 17.09
− 11.97 + 44.04 − 17.09
14.98
In 2015, there were 14.98 million housing
units with 3 rooms.
N(0) would be the number of housing units
with 0 rooms. It is impossible to have a
housing unit with no rooms.
a. The dependent variable is the trip length, T, and
the independent variable is the number of
years since 1969, x.
2
T 35 = 0.01 35 − 0.12 35 + 8.89
12.25 − 4.2 + 8.89
16.94
In 2004 (35 years after 1969), the average
vehicle trip length was 16.94 miles.
2
T 0 = 0.01 0 − 0.12 0 + 8.89
8.89
In 1969, the average vehicle trip length was
8.89 miles.
h
3x + 3h + 7 − 3x − 7
=
h
3h
=3
=
h
f x = − 2x + 1
f x + h = − 2 x + h + 1 = − 2x − 2h + 1
x + h − f x = − 2x − 2h + 1 − − 2x + 1
h
h
−2x − 2h + 1+ 2x − 1
=
h
−2h
= −2
=
h
Not all relations are functions because a relation
can have a single input corresponding to two
different outputs, whereas functions are a special
type of relation where no single input
corresponds to more than one output.
A vertical line is a graph comprising a single xcoordinate. The x-coordinate represents the
value of the independent variable in a function.
If a vertical line intersects a graph in two (or
more) different places, then a single input (xcoordinate) corresponds to two different
outputs (y-coordinates), which violates the
definition of a function.
Copyright © 2018 Pearson Education, Inc.
129
Chapter 2: Relations, Functions, and More Inequalities
The word “independent” implies that the x-variable
is free to be any value in the domain of the
function. The choice of the word “dependent”
for y makes sense because the value of y depends
on the value of x from the domain.
f x = − 2x
2
ISM: Intermediate Algebra
2
P2. y = x
y=x
2
x
y = −2 = 4
2
− 1 y = −1 = 1
2
y=0 =0
0
2
1
y= 1 =1
2
2 y=2 =4
−2
+x+1
( x, y)
2
−2, 4
−1, 1
0, 0
− 3 = −20
1, 1
2, 4
y
Gz=2z+5
(–2,
4)
(2,
4
4)
2
(–1, 1)
(1, 1)
x
(0, 0) 1
G −6 = 2
112. g h = 2h + 1
Section 2.3 Quick Checks
When a function is defined by an equation in x
and y, the graph of the function is the set of all
ordered pairs (x, y) such that y = f(x).
g 4 = 3
If f(4) = −7, then the point whose ordered pair is
(4, −7) is on the graph of y = f(x).
2
hq
= 1.2q
f x = −2 x + 9
2.8q
y= fx=−2x+9
x
−2
0
2
4
h(2) = 1
f − 2 = −2 − 2 + 9 = 13
f0=−20+9=9
f 2 = −2 2 + 9 = 5
f 4 = −2 4 + 9 = 1
f6=−26+9=−3
6
Section 2.3
y
Are You Prepared for This Section?
P1.
3 x − 12 = 0
3 x − 12 + 12 = 0 + 12
3 x = 12
3 x = 12
3
8
−2−
4
4
=4
The solution set is {4}.
130
Copyright © 2018 Pearson Education, Inc.
x
x , y
−2, 13
0, 9
2, 5
4, 1
6, − 3
ISM: Intermediate Algebra
Chapter 2: Relations, Functions, and More Inequalities
2
fx=x +2
2
y= fx=x +2
2
f −3 = − 3 + 2 = 11
2
f − 1 = −1 + 2 = 3
2
f0=0 +2=2
2
f 1 = 1 + 2 = 3
2
f 3 = 3 + 2 = 11
x
−3
−1
0
1
3
If the point (3, 8) is on the graph of a function f,
then f(3) = 8. f(−2) = 4, then (−2, 4) is a point on
the graph of g.
x , y
−3, 11
−1, 3
0, 2
1, 3
3, 11
y
a. Since (−3, −15) and (1, −3) are on the graph
of f, then f(−3) = −15 and f(1) = −3.
To determine the domain, notice that the
graph exists for all real numbers. Thus, the
domain is x | x is any real number , or
(−∞, ∞) in interval notation.
To determine the range, notice that the
function can assume any real number. Thus,
the range is y | y is any real number , or
(−∞, ∞) in interval notation.
8
−4
−4
The intercepts are (−2, 0), (0, 0), and (2, 0).
The x-intercepts are (−2, 0), (0, 0), and (2,
0). The y-intercept is (0, 0).
x
4
fx= x−2
y= fx= x−2
x
− 2 f − 2 =− 2 − 2 = 4
0
f 0 =0 − 2 = 2
2
f 2 =2 − 2 = 0
4
f 4 =4 − 2 = 2
f 6 =6 − 2 = 4
6
x , y
−2, 4
0, 2
2, 0
4, 2
6, 4
y
4
−2
4
x
Since (3, 15) is the only point on the graph
where y = f(x) = 15, the solution set to
f x = 15 is {3}.
a. When x = −2, then
x = −3x + 7
− 2 = −3 − 2 + 7
6+7
13
Since f(−2) = 13, the point (−2, 13) is on the
graph. This means the point (−2, 1) is not on
the graph.
If x = 3, then
x = − 3x + 7
−4
3 = − 3 3 + 7
a. The arrows on the ends of the graph indicate that
the graph continues indefinitely. Therefore,
the domain is
x | x is any real number , or (−∞, ∞) in
interval notation.
The function reaches a maximum value of 2,
but has no minimum value. Therefore, the
range is y | y ≤ 2 , or (−∞, 2] in interval
notation.
The intercepts are (−2, 0), (0, 2), and (2, 0).
The x-intercepts are (−2, 0) and (2, 0), and
the y-intercept is (0, 2).
−9+7
−2
The point (3, −2) is on the graph.
If f(x) = −8, then
f x = −8
− 3x + 7 = −8
− 3x = −15
x=5
If f(x) = −8, then x = 5. The point (5, −8)
is on the graph.
f (x ) = 2x + 6
f (−3) = 2 − 3 + 6 = − 6 + 6 = 0
Yes, −3 is a zero of f.
Copyright © 2018 Pearson Education, Inc.
131
Chapter 2: Relations, Functions, and More Inequalities
g(x)=x
2
ISM: Intermediate Algebra
y
−2x−3
10
2
g(1) = 1 − 2 1 − 3 = 1 − 2 −
3 = −4 No, 1 is not a zero of g.
h(z)=−z
3
+ 4z
3
h(2) = − 2 + 4 2 = − 8
+ 8 = 0 Yes, 2 is a zero of h.
(block
s)
Clara‟s distance from home is a function of time
so we put time (in minutes) on the horizontal
axis and distance (in blocks) on the vertical axis.
Starting at the origin (0, 0), draw a straight line
to the point (5, 5). The ordered pair (5, 5)
represents Clara being 5 blocks from home after
5 minutes. From the point (5, 5), draw a straight
line to the point (7, 0) that represents her trip
back home. The ordered pair (7, 0) represents
Clara being back at home after 7 minutes. Draw
a line segment from (7, 0) to (8, 0) to represent
the time it takes Clara to find her keys and lock
the door. Next, draw a line segment from (8, 0)
to (13, 8) that represents her 8 block run in
5 minutes. Then draw a line segment from
(13, 8) to (14, 11) that represents her 3 block run
in 1 minute. Now draw a horizontal line from
(14, 11) to (16, 11) that represents Clara‟s
resting period. Finally, draw a line segment from
(16, 11) to (26, 0) that represents her walk home.
(14,11)
(16,11)
Distanc
e
5
10
15
x
−2
y=Fx=x
20
x, y
F − 2 = − 2 + 1 = 5 −2, 5
2
−1
F −1 =
2
F 0 =0
1
F 1 =1 +1=2
2
F2=2
2
+1=1
2
132
−1 = −3 − 1 + 5 = 8
g 0 = −3 0 + 5 = 5
g 1= − 31 + 5 = 2
g 2 = −3 2 + 5 = − 1
g
−5
5
x
−5
Hx= x+1
y=Hx= x+1
x , y
x
− 5 H − 5 = − 5 + 1 = 4 −5, 4
−3 H −3 = − 3 + 1 = 2 −3, 2
−1 H − 1 = −1 + 1 = 0
−1, 0
1
H 1 = 1+1 = 2
1, 2
H 3 = 3+1 = 4
3, 4
3
−1, 8
0, 5
1, 2
2, − 1
2, 5
+1=5
5
−5
−1
0
1
2
1, 2
y
Copyright © 2018 Pearson Education, Inc.
4
−5
5
0, 1
2.3 Exercises
−1, 2
0
Time (minutes)
2
y
x
y = g x = −3 x + 5 x, y
− 2 g −2 = − 3 −2 + 5 = 11 −2, 11
+1
−1 +1=
25
g x = −3 x + 5
2
2
(26,0)
0
2
Fx=x +1
(13,8)
(8,0)
(5,5)
(7,0)
5
2
−10
The zeros of the function are the x-intercepts: −2
and 2.
10
x
−2
x
ISM: Intermediate Algebra
Chapter 2: Relations, Functions, and More Inequalities
3
hx=x −3
y=hx=x
x
−1
x , y
−3
−2 − 3= − 11
−2 h −2 =
3
3
h −1 = − 1 − 3 = −4
h0=0
0
−2, − 11
3
3
3
− 1, − 4
0, − 3
− 3 = −3
h 1=1 −3=−2
1
1, − 2
3
h2=2 −3=5
2
The intercepts are (−1, 0), (2, 0), and (0, 4).
The x-intercepts are (−1, 0) and (2, 0), and
the y-intercept is (0, 4).
2, 5
y
8
32. a. Domain: x | x ≤ 2
Range: y | y ≤ 3
or (−∞, 2]
or (−∞, 3]
The intercepts are (−2, 0), (2, 0), and (0, 3).
The x-intercepts are (−2, 0) and (2, 0), and
the y-intercept is (0, 3).
Zeros: −2, 2
x
−2
Zeros: −1, 2
2
a. g − 3 = −2
g 5 = 2
−12
a. Domain: x | x is a real number or (−∞, ∞)
Range: y | y is a real number or (−∞, ∞)
The intercepts are (0, −1) and (3, 0). The
x-intercept is (3, 0) and the y-intercept is
(0, −1).
g 6 = 3
g −5 is positive since the graph is above
the x-axis when x = −5.
g x = 0 for {−4, 3}
Zero: 3
a. Domain: x | x is a real number or (−∞, ∞)
Range: y | y ≤ 4 or (−∞, 4]
The intercepts are (−1, 0), (3, 0), and (0, 3).
The x-intercepts are (−1, 0) and (3, 0), and
the y-intercept is (0, 3).
f. Domain:
x | − 6 ≤ x ≤ 6 or [−6, 6]
Range: y | −3 ≤ y ≤ 4 or [−3, 4]
The x-intercepts are (−4, 0) and (3, 0).
The y-intercept is (0, −3).
g x = −2 for {−3, 2}
Zeros: −1, 3
a. Domain: x | x is a real number or (−∞, ∞)
Range: y | y is a real number or (−∞, ∞)
The intercepts are (−2, 0), (1, 0), and (4, 0).
The x-intercepts are (−2, 0), (1, 0), and (4,
0), and the y-intercept is (0, 2).
g x = 3 for {−5, 6}
The zeros are –4 and 3.
a. From the table, when x = 3 the value of the
function is 8. Therefore, G 3 = 8
From the table, when x = 7 the value of the
Zeros: −2, 1, 4
a. Domain: x | x is a real number or (−∞, ∞)
Range: y | y ≥ 0 or [0, ∞)
function is 5. Therefore, G 7 = 5
From the table, G x = 5 when x = 0 and
when x = 7 .
Copyright © 2018 Pearson Education, Inc.
133
Chapter 2: Relations, Functions, and More Inequalities
The x-intercept is the point for which the
function value is 0. From the table,
G x = 0 when x = −4 . Therefore,
the x-intercept is (−4, 0).
ISM: Intermediate Algebra
fx=x
3
y= fx=x
−2
y = −2 = − 8
a. f − 2 = 3 − 2 + 5 = −6 + 5 = −1
Since f(−2) = −1, the point (−2, 1) is not
on the graph of the function.
f 4 = 3 4 + 5 = 12 + 5 = 17
The point (4, 17) is on the graph.
3x + 5 = −4
3x = −9
x = −3
The point (−3, −4) is on the graph.
f − 2 = 3 − 2 + 5 = −6 + 5 = −1
−2 is not a zero of f.
−1
H 6 = 6 − 4 = 4 − 4
=03
The point (6, 0) is on the graph.
x − 4 = −4
x=0
=0
The point (0, −4) is on the graph.
H6= 6−4=4−4
=03
is a zero of H.
Constant function, (a)
Identity function, (f)
Linear function, (b)
134
=−1
−1, − 1
3
y=0 =0
0
3
0, 0
=1
1
y= 1
2
y=2 =8
1, 1
3
2, 8
y
10
(2, 8)
(0, 0)
(−1, −1)
(1, 1)
−5
x
5
(−2, −8) −10
f(x) = 4
x
−2
0
2
y = f (x ) = 4
y=4
y=4
y=4
(x, y)
(−2, 4)
(0, 4)
(2, 4)
y
(−2, 4)
(2, 4)
(0, 4)
x
−
−
a. Graph (II). Temperatures generally fluctuate
during the year from very cold in the winter
to very hot in the summer. Thus, the graph
oscillates.
3
2
3
2
2
y = −1
2
a. H 3 = 3 − 4 = 2 − 4 = −2 3
Since H(3) = −2, the point (3, −2) is on the
graph of the function.
x, y
− 2, − 8
3
The y-intercept is the point for which x = 0.
From the table, when x = 0 the value of the
function is 5. Therefore, the y-intercept is
(0, 5).
3
x
Graph (I). The height of a human increases
rapidly at first, then levels off. Thus, the
graph increases rapidly at first, then levels
off.
Graph (V). Since the person is riding at a
constant speed, the distance increases at a
constant rate. The graph should be linear
with a positive slope.
Graph (III). The pizza cools off quickly
when it is first removed from the oven. The
rate of cooling should slow as time goes on
as the pizza temperature approaches the
room temperature.
Copyright © 2018 Pearson Education, Inc.
ISM: Intermediate Algebra
Chapter 2: Relations, Functions, and More Inequalities
Graph (IV). The value of a car decreases
rapidly at first and then more slowly as time
goes on. The value should approach 0 as
time goes on (ignoring antique autos).
Height (1,000 ft)
h
The x-intercepts of the graph of a function are
the same as the zeros of the function.
Putting the Concepts Together (Sections 2.1−2.3)
The relation is a function because each element
in the domain corresponds to exactly one
element in the range.
{(−2, 1), (−1, 0), (0, 1), (1, 2), (2, 3)}
Time (min)
t
Answers will vary. One possibility:
T
2. a.
3
y = x − 4x is a function because any
specific value of x (input) yields exactly one
value of y (output).
(
F)
y = ±4x + 3 is not a function because with
Temperature
Temp. from oven
Serving temp.
Freezer temp.
4
Yes, the graph represents a function.
Domain: {−4, −1, 0, 3, 6}
Range: {−3, −2, 2, 6}
t
8 12 16 20
This relation is a function because it passes the
vertical line test.
Time (min)
Answers will vary. One possibility: For the first
100 days, the depth of the lake is fairly constant.
Then there is a increase in depth, possibly due to
spring rains, followed by a large decrease,
possibly due to a hot summer. Towards the end
of the year the depth increases back to its
original level, possibly due to snow and ice
accumulation.
Answers will vary. One possibility:
y
5
−5
the exception of 0, any value of x can yield
two values of y. For instance, if x = 1, then
y = 7 or y = −1.
5
f 5 = −6
The zero is 4.
a. f 4 = − 5 4 + 3 = −20 + 3 = −17
2
g −3 = −2 − 3 + 5 −3 − 1
−2 9 − 15 − 1
−18 − 15 − 1
−34
f x − f 4 = − 5x + 3 − −17
−5x + 3 + 17
−5x + 20
x
−5
The domain of a function is the set of all values of
the independent variable such that the output of
the function is a real number and “makes sense.”
It is this aspect of “making sense” that leads to
finding domains in applications. Domains in
applications are often found based on
determining reasonable values of the variable.
For example, the length of a side of a rectangle
must be positive.
f x − 4 = − 5 x − 4 + 3
−5 x − −5 4 + 3
− 5x + 20 + 3
− 5x + 23
7. a. Domain:
Copyright © 2018 Pearson Education, Inc.
h | h is a real number or (−∞, ∞)
135
Chapter 2: Relations, Functions, and More Inequalities
ISM: Intermediate Algebra
f x = −22
5x − 2 = −22
5x − 2 + 2 = − 22 + 2
5x = −20
Since we cannot divide by zero, we must
find the values of w which make the
denominator equal to zero.
3w + 1 = 0 3w
+ 1− 1 = 0 − 1
5x = −20
3w = −1
5
3w = −1
3
3
w=− 1
3
= −4
The point (−4, −22) is on the graph of f.
f
d.
Domain: w w ≠ − 1
2
=5
5
3
2
−2=2−2 =0
5
is a zero of f.
y= x−2
Section 2.4
−
y= x 2
x
− 4 y = −4 − 2 = 2
−2 y = −2 − 2 = 0
0 y= 0 −2=−2
y= 2 −2=0
2
y= 4 −2=2
4
x , y
−4, 2
−2, 0
0, − 2
2, 0
4, 2
Are You Prepared for This Section?
P1. y = 2x − 3
Let x = −1, 0, 1, and 2.
x = −1: y = 2(− 1) − 3
= −2 −
3 y = −5
y
= 0 : y = 2(0) − 3
y=0−3
y = −3
4
(−4, 2)
2)
(4,
−4
(−2, 0)
(0,
4
(2, 0)
−2)
x
x = 1: y = 2(1) − 3
=2−
3 y = −1
−4
a. h 2.5 = 80
The ball is 80 feet high after 2.5 seconds.
[0, 3.8]
[0, 105]
= 2 : y = 2(2) − 3
y=4−3
y=1
Thus, the points (−1, −5), (0, −3), (1, −1),
and (2, 1) are on the graph.
y
1.25 seconds
5
a. f(3) = 5(3) − 2 = 15 − 2 = 13
Since the point (3, 13) is on the graph, the
point (3, 12) is not on the graph of the
function.
f − 2 = 5 −2 − 2 = −10 − 2 = −12
The point (−2, −12) is on the graph of the
function.
136
(2, 1)
−5
(−1,−5)
Copyright © 2018 Pearson Education, Inc.
(1,−1) 5
(0,−3)
x
ISM: Intermediate Algebra
P2.
1
Chapter 2: Relations, Functions, and More Inequalities
P4. The graph of x = 5 is a vertical line with xintercept 5. It consists of all ordered pairs
whose x-coordinate is 5.
x+y=2
2
Let x = −2, 0, 2, and 4.
1
x = −2 :
y
5
−2 + y = 2
(5, 4)
− 1+ y = 2
y=3
1
=0:
−5
5
x
(5, 0)
(5, −4)
0 + y = 2
5
2
0+y=2
y=2
1
x=2:
2
7
−4−3
−7
P5. m = 3 − −1 = 4 = − 4
+ y = 2
2
1+ y = 2
y=1
=4:
1
−4
case we would interpret the slope as saying that y
will increase by 7 units if x decreases by 4 units.
In either case, the slope is the average rate of
change of y with respect to x.
4 + y = 2
2
y = 22
y=0
Thus, the points (−2, 3), (0, 2), (2, 1), and (4, 0)
are on the graph.
y
5
(−2, 3)
(0, 2)
(2, 1)
(4, 0)
5 x
−5
P6. Start by finding the slope of the line using the
two given points.
m = 9 − 3 =6 = 2
4−1 3
Now use the point-slope form of the equation of
a line:
y − y1 = m x − x1
y − 3 = 2 x − 1
y−3=2x−2
y=2x+1
The equation of the line is y = 2x + 1.
−5
P3. The graph of y = −4 is a horizontal line with
y-intercept −4.
P7.
y
Using m = −7 we would interpret the slope as
4
saying that y will decrease 7 units if x increases
by 4 units. We could also say m = 7 in which
0.5 x − 40 + 100 = 84
0.5 x − 0.5 40 + 100 = 84
5
0.5 x − 20 + 100 = 84
−5
(0, −4)
5 x
(−3, −4)
−5
0.5 x + 80 = 84
0.5 x + 80 − 80 = 84 −
80 0.5 x = 4
0.5 x = 4
(3, −4)
0.5
0.5
=8
Copyright © 2018 Pearson Education, Inc.
137
Chapter 2: Relations, Functions, and More Inequalities
P8.
ISM: Intermediate Algebra
y
4 x + 20 ≥ 32
4 x + 20 − 20 ≥ 32 − 20
4 x ≥ 12
5
(0, 4)
4 x ≥ 12
5
−5
4
(1, −1)
≥3
x | x ≥ 3
or [3, ∞)
−5
Section 2.4 Quick Checks
Comparing h x =
For the graph of a linear function f(x) = mx + b,
m is the slope and (0, b) is the y-intercept.
3
x + 1 to h(x) = mx + b, the
2
slope m is
3
and the y-intercept b is 1. Begin by 2
The graph of a linear function is called a line.
plotting the point (0, 1). Because
False
m=
For the linear function G(x) = −2x + 3, the slope
is −2 and the y-intercept is (0, 3).
5. Comparing f x = 2 x − 3 to f(x) = mx + b, the
3
obtain the graph of h x = x + 1.
2
y
5
2 ∆y Rise
== =
=
− m 2 , from the point
(0, 3)
go up 2 units and to the right 1 unit and end up at
(1, −1). Draw a line through these points and
(2, 4)
(0, 1)
−5
obtain the graph of f x = 2 x − 3 .
y
5
−5
5
5
x
−5
Comparing f x = 4 to f(x) = mx + b, the slope
m is 0 and the y-intercept b is 4. Since the slope
is 0, this is a horizontal line. Draw a horizontal
line through the point (0, 4) to obtain the graph
of f(x) = 4.
x
(1, −1)
(0, −3)
3 ∆y Rise
=
=
, from the point (0, 1) go up
2 ∆x Run
3 units and to the right 2 units and end up at
(2, 4). Draw a line through these points and
slope m is 2 and the y-intercept b is −3. Begin by
plotting the point (0, −3). Because
y
−5
5
Comparing G x = − 5 x + 4 to G(x) = mx + b,
the slope m is −5 and the y-intercept b is 4 .
Begin by plotting the point (0, 4). Because
−5
m=−5=
138
x
∆y
(0, 4)
5
−5
Rise
, from the point (0, 4)
−5
go down 5 units and to the right 1 unit and end
up at (1, −1). Draw a line through these points
and obtain the graph of G(x) = −5x + 4.
f ( x) = 0 3
x − 15 = 0
=
=
3 x = 15
x=5
5 is the zero.
Copyright © 2018 Pearson Education, Inc.
x
ISM: Intermediate Algebra
Chapter 2: Relations, Functions, and More Inequalities
C
($)
G ( x) = 0
x+4=0
Renta
Cost
l
x = −4
2
= −8
−8 is the zero.
F ( p) = 0
3
2
p+8=0
x
Number of Miles Driven
p = −8
Solve C(x) ≤ 127.50:
0.35x + 40 ≤ 127.50
3
−2 p = −24
= 12
12 is the zero.
a. The independent variable is the number of
miles driven, x. It does not make sense to
drive a negative number of miles, so the
domain of the function is x | x ≥ 0 or,
using interval notation, [0, ∞).
To determine the C-intercept, find
C(0) = 0.35(0) + 40 = 40. The C-intercept is
(0, 40).
C(80) = 0.35(80) + 40 = 28 + 40 = 68. If the
truck is driven 80 miles, the rental cost will
be $68.
Solve C(x) = 85.50:
0.35 x + 40 = 85.50
0.35 x = 45.50
= 130
If the rental cost is $85.50, then the truck
was driven 130 miles.
Plot the independent variable, number of
miles driven, on the horizontal axis and the
dependent variable, rental cost, on the
vertical axis. From parts (b) and (c), the
points (0, 40) and (80, 68) are on the graph.
Find one more point by evaluating the
function for x = 200:
C(200) = 0.35(200) + 40 = 70 + 40 = 110.
The point (200, 110) is also on the graph.
0.35x ≤ 87.50
x ≤ 250
You can drive up to 250 miles if you can
spend up to $127.50.
a. From Example 4, the daily fixed costs were
$2000 with a variable cost of $80 per
bicycle. The tax of $1 per bicycle changes
the variable cost to $81 per bicycle. Thus,
the cost function is C(x) = 81x + 2000.
C(5) = 81(5) + 2000 = 2405
So, the cost of manufacturing 5 bicycles in a
day is $2405.
C (x) = 2810
81x + 2000 = 2810
81x = 810
= 10
So, 10 bicycles can be manufactured for a
cost of $2810.
Label the horizontal axis x and the vertical
axis C.
C
Cost ($)
2
Number of Bicycles
x
a. Let C (x) represent the monthly cost of
operating the car after driving x miles, so
C(x) = mx + b. The monthly cost before the
car is driven is $250, so C(0) = 250. The
C-intercept of the linear function is 250.
Because the maintenance and gas cost is
Copyright © 2018 Pearson Education, Inc.
139
Chapter 2: Relations, Functions, and More Inequalities
C ( x) = 282.40
0.18 x + 250 = 282.40
0.18 x = 32.40
= 180
So, Roberta can drive 180 miles each month
for the monthly cost of $282.40.
Label the horizontal axis x and the vertical
axis C. From part (a) C(0) = 250, and from
part (c) C(320) = 307.6, so (0, 250) and
(320, 307.60) are on the graph.
C
Cost ($)
(
m
g
/
d
L
)
C
h
o
l
e
s
t
e
r
o
l
Number of Miles Driven
15. a.
− 180 = 2.225 x − 25 y
− 180 = 2.225 x − 55.625
y = f ( x) = 2.225 x + 124.375
C
Age
f (39) = 2.225(39) + 124.375 = 211.15
We predict that the total cholesterol of a
39-year-old male will be approximately
211 mg/dL.
The slope of the linear function is 2.225.
This means that, for males, the total
cholesterol increases by 2.225 mg/dL for
each one-year increase in age. The yintercept, 124.375, would represent the total
cholesterol of a male who is 0 years old.
Thus, it does not make sense to interpret this
y-intercept.
2.4 Exercises
20. Comparing F x = 4 x + 1 to F(x) = mx + b, the
slope m is 4 and b is 1. Begin by plotting the
point (0, 1). Because m = 4 =
Age
140
C
T
o
t
a
l
x
a. Answers will vary. Use the points (25, 180) and
(65, 269).
m = 269 − 180 = 89 = 2.225
65 − 25
40
g
/
d
L
)
C(320) = 0.18(320) + 250 = 307.6
So, the monthly cost of driving 320 miles is
$307.60.
Linear with a positive slope.
(m
function is x | x ≥ 0 , or using interval
notation [0, ∞).
Nonlinear
Cholesterol
The car cannot be driven a negative
distance, the number of miles driven, x,
must be greater than or equal to zero. In
addition, there is no definite maximum
number of miles that the car can be driven.
Therefore, the implied domain of the
The scatter diagram reveals that, as the
age increases, the total cholesterol also
increases.
Total
$0.18 per mile, the slope of the linear
function is 0.18. The linear function that
relates the monthly cost of operating the car
as a function of miles driven is C(x) =
0.18x + 250.
ISM: Intermediate Algebra
4 ∆y Rise
=
=
1 ∆x Run
,
from the point (0, 1) we go up 4 units and to the
right 1 unit and end up at (1, 5). Draw a line
through these points and obtain the graph of
F(x) = 4x + 1.
Copyright © 2018 Pearson Education, Inc.
ISM: Intermediate Algebra
Chapter 2: Relations, Functions, and More Inequalities
y
y
5
5
(1, 5)
(0, 1)
−5
x
5
5
−5
(0, −3)
−5
−2
∆y
=
Rise
=
, from the point (0, 5)
go down 2 units and to the right 1 unit and end
up at (1, 3). Draw a line through these points and
obtain the graph of G(x) = −2x + 5.
3
Comparing P x = − x − 1 to P(x) = mx + b,
5
the slope m is −
3
and b is −1. Begin by plotting 5
the point (0, −1). Because
m=−
3 − 3 ∆y Rise
=
=
=
point 5 5 ∆x Run
, from the
y
(0, −1) go down 3 units and to the right 5 units
and end up at (5, −4). Draw a line through these
8
points and obtain the graph of P x = −
3
x − 1.
5
(0, 5)
y
(1, 3)
−5
5
x
5
Comparing P x = 5 to P(x) = mx + b, the slope
m is 0 and b is 5. The graph is a horizontal line
through the point (0, 5). Draw a horizontal line
through this point and obtain the graph of
P(x) = 5.
y
(0, 5)
−5
(0, −1)
5
(5, −4)
Comparing f x =
4
x
4
x to f(x) = mx + b, the 5
and b is 0. Begin by plotting the 5
point (0, 0). Because m =
4 ∆y Rise
=
=
,
from 5 ∆x Run
the point (0, 0) go up 4 units and to the right 5
units and end up at (5, 4). Draw a line through
x
−5
these points and obtain the graph of f x =
26. Comparing f x = 1 x − 3 to f(x) = mx + b, the
3
1
slope m is
and b is −3. Begin by plotting the
3
point (0, −3). Because m = 1 = ∆y = Rise , from
3 ∆xRun
the point (0, −3) go up 1 unit and to the right
3 units and end up at (3, −2). Draw a line
through these points and obtain the graph of
1
5
−5
slope m is
5
x=
(3, −2)
−5
Comparing G x = − 2 x + 5 to G(x) = mx + b,
the slope m is −2 and b is 5. Begin by plotting
the point (0, 5). Because
m=−2=
x
4
x.
5
y
5
(5, 4)
(0, 0)
5
−5
x
−5
x − 3.
3
Copyright © 2018 Pearson Education, Inc.
141
Chapter 2: Relations, Functions, and More Inequalities
f
ISM: Intermediate Algebra
y
x = 0 3 x +
18 = 0
3 x = −18
x = −6
−6 is the zero.
H x = 0
− 4 x + 36 = 0
− 4 x = −36
x=9
9 is the zero.
46. a.
Answers will vary. Use the points (0, 0.8)
and (3.9, 5.0).
m = 5.0 − 0.8 = 4.2 ≈ 1.08
3.9 − 0 3.9
− 0.8 = 1.08 x −
0 y − 0.8 = 1.08x
y = 1.08 x + 0.8
Ft=0
t+6=0
t = −6
2
− 3t = −12
t=4
4 is the zero.
y
Linear with negative slope
Nonlinear
44. a.
y
a. 8
(0, 3)
x
Answers will vary. Use the points (2, 5.7)
and (7, 1.8).
m = 1.8− 5.7 = −3.9 = −0.78
7− 2
5
− 5.7 = −0.78 x −
2 y − 5.7 = −0.78 x +
1.56 y = −0.78 x + 7.26
142
x
q = −8
−8 is the zero.
3
y
q = −2
2
x
p q = 0
q+2=0
3
g x = 0
8x+3=0
8 x = −3
=−
3
8
Copyright © 2018 Pearson Education, Inc.
3
8
is the zero.
x
ISM: Intermediate Algebra
Chapter 2: Relations, Functions, and More Inequalities
Copyright © 2018 Pearson Education, Inc.
143
Chapter 2: Relations, Functions, and More Inequalities
Use any two points to determine the slope.
Here we use (2, 1) and (6, −1):
m = − 1− 1 = −2 = − 1
6−2 4
2
From part (d), the y-intercept is 2, so the
1
equation of the function is g (x ) = −
x + 2.
2
Solve I(s) = 45,000.
0.01s + 20,000 = 45,000
0.01s = 25,000
s = 2,500,000
For Tanya‟s income to be $45,000, her total
sales would have to be $2,500,000.
a. The independent variable is payroll, p. The
payroll tax only applies if the payroll
exceeds $189 million. Thus, the domain of T
is {p|p > 189} or, using interval notation,
(189, ∞).
a. The independent variable is total sales, s. It
would not make sense for total sales to be
negative. Thus, the domain of I is
s | s ≥ 0
ISM: Intermediate Algebra
or, using interval notation, [0, ∞).
I 0 = 0.01 0 + 20,000 = 20,000
If Tanya‟s total sales for the year are $0, her
income will be $20,000. In other words, her
base salary is $20,000.
Evaluate I at s = 500,000.
500,000 = 0.01 500,000 + 20,000
25,000
If Tanya sells $500,000 in books for the
year, her salary will be $25,000.
Evaluate T at p = 200.
T(200) = 0.175(200 − 189) = 1.925
The luxury tax for a payroll of $200 million
was $1.925 million.
Evaluate T at p = 189, 250, and 300.
T(189) = 0.175(189 − 189) = 0
T(250) = 0.175(250 − 189) = 10.675
T(300) = 0.175(300 − 189) = 19.425
Thus, the points (189, 0), (250, 10.675) and
(300, 19.425) are on the graph.
T
LuxuryTax
Evaluate I at m = 0 , 500,000, and
1,000,000.
I 0 = 0.01 0 + 20,000 = 20,000
($million)
25
500,000 = 0.01 500,000 + 20,000
Salary ($)
Total Sales ($)
s
30
0
752
052
522
20
0
75
1
I
05
1
30,000
Thus, the points (0, 20,000),
(500,000, 25,000), and (1,000,000, 30,000)
are on the graph.
5
1,000,000 = 0.011,000,000 + 20,000
15
10
25,000
20
x
Team Payroll ($ million)
Solve T(p) = 1.3
0.175( p − 189) = 1.3
0.175 p − 33.075 = 1.3
0.175 p = 34.375
≈ 196.4
For the luxury tax to be $1.3 million, the
payroll of the team would be about $196
million.
a. The independent variable is age, a. The
dependent variable is the birth rate, B.
We are told in the problem that a is
restricted from 15 to 44, inclusive. Thus, the
domain of B is a |15 ≤ a ≤ 44 or, using
interval notation, [15, 44].
144
Copyright © 2018 Pearson Education, Inc.