International trade 4th edition by feenstra taylor solution manual
Bạn đang xem bản rút gọn của tài liệu. Xem và tải ngay bản đầy đủ của tài liệu tại đây (4.83 MB, 121 trang )
International Trade 4th edition by Robert C. Feenstra, Alan M. Taylor
Solution Manual
Link full download solution manual: />Link full download test bank: />
2 Trade and Technology: The Ricardian Model
1. In this problem you will use the World Development Indicators (WDI) database from the
World Bank to compute the comparative advantage of two countries in the major sectors of
gross domestic product (GDP): agriculture, industry (which includes manufacturing,
mining, construction, electricity, and gas), and services. Go to the WDI website at
, and choose ―Online tables,‖ where you will be using the sections
on ―People‖ and on the ―Economy.‖
a. In the ―People‖ section, start with the table ―Labor force structure.‖ Choose two
countries that you would like to compare, and for a recent year write down their total
labor force (in millions) and the percentage of the labor force that is female. Then
calculate the number of the labor force (in millions) who are male and the number
who are female.
Answer:
2014
Labor Force
(million)
Female Labor
(%)
Male Labor
(million)
Female Labor
(million)
France
30.1
47
15.95
14.15
Thailand
40.1
46
18.45
21.65
b. Again using the ―People‖ section of the WDI, now go to the ―Employment by sector‖ table.
For the same two countries that you chose in part (a) and for roughly the same year, write down
the percent of male employment and the percent of female employment in each of the three
sectors of GDP: agriculture, industry, and services. (If the data are missing in this table for the
countries that you chose in part (a), use different countries.) Use these percentages along with
your answer to part (a) to calculate the number of male workers and the number of female
workers in each sector. Add together the number of male and female workers to get the total
labor force in each sector.
Answer:
2011–2014
Agriculture
Male % Female %
Industry
Male %
Female %
Service
Male %
Female %
France
4
2
31
10
65
88
Thailand
44
39
23
18
33
43
2011–2014
(million)
Agriculture
Male Female
Industry
Male Female
Service
Male
Female
France
0.64
0.28
4.95
1.42
10.37
12.45
Thailand
8.12
8.44
4.24
3.90
6.09
9.31
c. In the ―Economy‖ section, go to the table ―Structure of output.‖ There you will find
GDP (in $ billions) and the % of GDP in each of the three sectors: agriculture, industry,
and services. For the same two countries and the same year that you chose in part (a),
write down their GDP (in $ billions) and the percentage of their GDP accounted for by
agriculture, by industry, and by services. Multiply GDP by the percentages to obtain the
dollar amount of GDP coming from each of these sectors, which is interpreted as the
value-added in each sector, that is, the dollar amount that is sold in each sector minus the
cost of materials (not including the cost of labor or capital) used in production.
Answer:
2014
GDP (billion $)
Agriculture (%)
Industry (%)
Service (%)
France
2829.2
2
19
79
Thailand
404.8
20
37
53
d. Using your results from parts (b) and (c), divide the GDP from each sector by the
labor force in each sector to obtain the value-added per worker in each sector. Arrange
these numbers in the same way as the ―Sales/Employee‖ and ―Bushels/Worker‖ shown in
Table 2-2. Then compute the absolute advantage of one country relative to the other in
each sector, as shown on the right-hand side of Table 2-2. Interpret your results. Also
compute the comparative advantage of agriculture/industry and agriculture/services (as
shown at the bottom of Table 2-2), and the comparative advantage of industry/services.
Based on your results, what should be the trade pattern of these two countries if they
were trading only with each other?
Answer:
($1000)
France
Thailand
Absolute Advantage
France/Thailand Ratio
Service
97.94
13.93
7.03
Industry
84.39
18.4
4.59
Agriculture
61.50
4.89
12.58
Agriculture/ Service
0.63
0.35
Agriculture/ Industry
0.73
0.27
Industry/Service
0.86
1.33
Comparative
Advantage
Thailand has a comparative advantage in both Service and Industry. Suppose that a farmer
spends 1,000 hours per year in agriculture production. Multiplying the marginal product of
an hour of labor in agriculture by 1,000, to obtain the marginal production of labor per year
and dividing by the marginal production of labor in Service gives us the opportunity cost of
Service. In France, this ratio is 0.63, indicating that $0.63 must be foregone to obtain an extra
dollar of sales in Agriculture. In Industry, the ratio is 0.73 in France. These ratios are much
smaller in Thailand, only 0.35 for Service and 0.27 for Industry. As a result, Thailand has a
lower opportunity cost of both Industry and Service. Therefore, if assuming the two countries
are trading only with each other, France will export Agriculture while Thailand will export
Service and Industry.
2. At the beginning of the chapter, there is a brief quotation from David Ricardo; here is a
longer version of what Ricardo wrote:
England may be so circumstanced, that to produce the cloth may require the
labour of 100 men for one year; and if she attempted to make the wine, it
might require the labour of 120 men for the same time. . . . To produce the
wine in Portugal, might require only the labour of 80 men for one year, and
to produce the cloth in the same country, might require the labour of 90 men
for the same time. It would therefore be advantageous for her to export wine
in exchange for cloth. This exchange might even take
place, notwithstanding that the commodity imported by Portugal could
be produced there with less labour than in England.
Suppose that the amount of labor Ricardo describes can produce 1,000
yards of cloth or 2,000 bottles of wine in either country. Then answer the
following:
a. What is England’s marginal product of labor in cloth and in wine, and what is
Portugal’s marginal product of labor in cloth and in wine? Which country has
absolute advantage in cloth, and in wine, and why? Answer: In England, 100 men
produce 1,000 yards of cloth, so MPLC = 1,000/100 = 10. 120 men produce 2,000
bottles of wine, so MPLW = 2,000/120 =16.6. In Portugal, 90 men produce 1,000
yards of cloth, so MPL
*
C
= 1,000/90 = 11.1. Eighty (80) men produce 2,000 bottles
*
of wine, so MPL w = 2,000/80 = 25. So Portugal has an absolute advantage in both
cloth and wine, because it has higher marginal products of labor in both industries
than does England.
b. Use the formula PW/PC = MPLC/MPLW to compute the no-trade relative price of
wine in each country. Which country has comparative advantage in wine, and why?
Answer: For England, PW/PC = MPLC/MPLW = 10/16.6 = 0.6, which is the no-trade
relative price of wine (equal to the opportunity cost of producing wine). So the
opportunity cost of wine in terms of cloth is 0.6, meaning that to produce 1 bottle of
*
*
wine in England, the country gives up 0.6 yards of cloth. For Portugal, PW /PC =
*
*
MPLC /MPLW = 11.1/25 = 0.4, which is the no-trade relative price of wine (equal to
the opportunity cost of producing wine). The no-trade relative price of wine is lower
in Portugal, so Portugal has comparative advantage in wine, and England has
comparative advantage in cloth. Portugal has comparative advantage in producing
*
*
wine because it has lower opportunity cost (PW /PC = 0.4) than England in the
production of wine (PW/PC = 0.6).
3. Suppose that each worker in Home can produce two cars or three TVs. Assume
that Home has four workers.
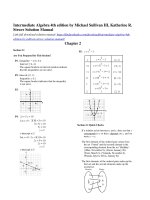
a. Graph the production possibilities frontier for
Home. Answer: See the following figure.
b. What is the no-trade relative price of cars in Home?
Answer: The no-trade relative price of cars at Home is PC/PTV = 3/2 =
MPLTV/MPC. It is the slope of the PPF curve for Home.
4. Suppose that each worker in Foreign can produce three cars or two TVs. Assume
that Foreign also has four workers.
a. Graph the production possibilities frontier for
Foreign. Answer: See following figure.
b. What is the no-trade relative price of cars in Foreign?
*
*
Answer: The no-trade relative price of cars in Foreign is P C/P TV = 2/3 =
c. Using the information provided in Problem 3 regarding Home, in which good does
Foreign have a comparative advantage, and why?
Answer: Foreign has a comparative advantage in producing televisions because it
has a lower opportunity cost than Home in the production of televisions.
5. Suppose that in the absence of trade, Home consumes two cars and nine TVs, while
Foreign consumes nine cars and two TVs. Add the indifference curve for each
country to the figures in Problems 3 and 4. Label the production possibilities
frontier (PPF), indifference curve (U1), and the no-trade equilibrium consumption
and production for each country.
Answer: See following figures.
6. Now suppose the world relative price of cars is PC/PTV = 1.
a. In what good will each country specialize? Briefly explain why.
Answer: Home would specialize in TVs, export TVs, and import cars,
whereas the Foreign country would specialize in cars, export cars, and import
TVs. The reason is because Home has a comparative advantage in TVs and
Foreign has a comparative advantage in cars.
b. Graph the new world price line for each country in the figures in Problem 5, and
add a new indifference curve (U2) for each country in the trade equilibrium.
Answer: See the following figures.
c. Label the exports and imports for each country. How does the amount of Home
exports compare with Foreign imports?
Answer: See graph in part (b). The amount of Home TV exports is equal to the
amount of Foreign TV imports. In addition, Home imports of cars equal Foreign
exports of cars. This is balanced trade, which is an essential feature of the
Ricardian model.
d. Does each country gain from trade? Briefly explain why or why not. Answer:
Both Home and Foreign benefit from trade relative to their no-trade
consumption because their utilities are both higher (consumption bundles
located on higher indifference curves).
Work It Out
Answer the following questions using the information given by the accompanying
table.
Number of bicycles
produced per hour
Home
4
Foreign
6
Number of snowboards
produced per hour
6
8
Comparative Advantage
?
?
Absolute Advantage
?
?
a. Complete the table for this problem in the same manner as Table 2-2.
Answer: See previous table.
b. Which country has an absolute advantage in the production of bicycles?
Which country has an absolute advantage in the production of snowboards?
Answer: Foreign has an absolute advantage in both production of bicycles
and snowboards, because it is able to produce more in an hour than Home.
c. What is the opportunity cost of bicycles in terms of snowboards in Home? What
is the opportunity cost of bicycles in terms of snowboards in Foreign?
Answer: The opportunity cost of one bicycle is 3/2 snowboards at Home (PB/PS =
MPLS/MPLB = 6/4 = 3/2). The opportunity cost of one bicycle is 4/3 snowboards
* *
*
*
in the Foreign country (PB /PS = MPLS /MPLB = 8/6 = 4/3).
d. Which product will Home export, and which product does Foreign export? Briefly
explain why.
Answer: The opportunity cost of one bicycle is 3/2 snowboards at Home (PB/PS =
MPLS/MPLB = 6/4 = 3/2). The opportunity cost of one bicycle is 4/3 snowboards
* *
*
*
in the Foreign country (PB /PS = MPLS /MPLB = 8/6 = 4/3). Home has a
smaller opportunity cost producing snowboards than the Foreign country. Home
will export snowboards and Foreign will export bicycles.
7. Assume that Home and Foreign produce two goods, TVs and cars, and use
the information below to answer the following questions:
In the No-Trade equilibrium:
Home
WageTV = 12
MPLTV = 4
PTV = ?
Foreign
*
Wage
WageC = ?
MPL
MPLC = ?
P
PC = 4
*
TV
TV
*
TV
=?
=?
=8
Wage
MPL
P
*
C
*
C
*
C
=6
=1
=?
a. What is the marginal product of labor for TVs and cars in Home? What is the notrade relative price of TVs in Home?
Answer: MPLC = 3, MPLTV = 4, and PTV/PC = MPLC /MPLTV = 3/4
b. What is the marginal product of labor for TVs and cars in Foreign? What is the
no-trade relative price of TVs in Foreign?
*
*
*
*
*
*
Answer: MPL C = 1, MPL TV = 3/4, and P TV/P C = MPL C/MPL TV = 4/3
c. Suppose the world relative price of TVs in the trade equilibrium is PTV/PC =
1. Which good will each country export? Briefly explain why.
Answer: Home will export TVs and Foreign will export cars
because Home has a comparative advantage in TVs whereas
Foreign has a comparative advantage in car. Each country
will specialize in the goods with lower opportunity cost.
d. In the trade equilibrium, what is the real wage in Home in terms of cars and in
terms of TVs? How do these values compare with the real wage in terms of
either good in the no-trade equilibrium?
Answer: Workers at Home are paid in terms of TVs because Home exports TVs.
Home is better off with trade because its real wage in terms of cars has increased.
MPLTV = 4 units of TV
or
Home wages with trade=
(PTV /PC ) ⋅ MPLTV = (1) ⋅ 4 = 4 units of car
MPLTV = 4 units of TV
or
/P ) ⋅ MPL = (3/4) ⋅ 4 = 3 units of car
Home wages w/o trade=
(P
TV
C
TV
e. In the trade equilibrium, what is the real wage in Foreign in terms of TVs and in
terms of cars? How do these values compare with the real wage in terms of either
good in the no-trade equilibrium?
Answer: Foreign workers are paid in terms of cars because Foreign exports cars.
Foreign gains in terms of cars with trade.
(P /P ) ⋅ MPL* = (1) ⋅ 1 = 1 units of TV
C
TV
C
or
Foreign wages with trade= MPL* = 1 units of car
C
(P /P ) ⋅ MPL = (3/4) ⋅ 1 = 3/4 unit of TV
*
C
*
TV
*
C
or
Foreign wages w/o trade= MPL* = 1 units of car
C
f. In the trade equilibrium, do Foreign’s workers earn more or less than Home’s
workers, measured in terms of their ability to purchase goods? Explain why.
Answer: Foreign workers earn less than workers at Home in terms of cars
because Home has an absolute advantage in the production of cars. Home workers
also earn more than Foreign workers in terms of TVs
8. Why do some low-wage countries, such as China, pose a threat to manufacturers
in industrial countries, such as the United States, whereas other low-wage
countries, such as Haiti, do not?
Answer: To engage in international trade, a country must have a minimal threshold
of productivity. Countries such as China have the productivity necessary to compete
successfully, but Haiti does not. China can enter the world market because it beats
other industrial countries with a lower price. Under perfect competition, price is
determined by both wage rate and productivity; that is, P = Wage/MPL. So the lower
price in China comes from both a low wage rate and high MPL. Haiti has a low wage
rate, but also low MPL. So Haiti’s price is not low enough to enter the world market.
Answer Problems 9 to 11 using the chapter information for Home and Foreign.
9. a. Suppose that the number of workers doubles in Home. What happens to the Home
PPF and what happens to the no-trade relative price of wheat?
Answer: With the doubling of the number of workers in Home, it can now
produce 200 = 4 · 50 bushels of wheat if it concentrates all resources in the
production of wheat, or it could produce 100 = 2 · 50 yards of cloth by devoting
all resources to the production of cloth. The PPF shifts out for both wheat and
cloth. The no-trade relative price of wheat remains the same because both MPLW
and MPLC are unchanged.
b. Suppose that there is technological progress in the wheat industry such that
Home can produce more wheat with the same amount of labor. What happens to
the Home PPF and what happens to the relative price of wheat? Describe what
would happen if a similar change occurred in the cloth industry.
Answer: Because the technological progress is only in the wheat industry,
Home’s production of cloth remains the same if it devotes all of its resources to
producing cloth. If instead Home produces only wheat, it is able to produce
more wheat using the same amount of labor. Home’s PPF shifts out in the
direction of wheat production. Recall that the relative price of wheat is given by
PW/PC = MPLC/MPL W. With the technological progress in wheat, the marginal
product of labor in the wheat production increases. Thus, the relative price of
wheat decreases. As shown in the graph, the relative price of wheat drops from
1/2 to 1/4.
If instead the technological progress is in the cloth industry, we would have the
opposite results. Home’s PPF would shift out in the direction of cloth
production and the relative price of wheat would increase.
10. a. Using Figure 2-5, show2 that an increase in the relative price of wheat from its world relative
price of 3 will raise Home’s utility.
Answer: The increase in the relative price of wheat from its international
equilibrium of 2/3 allows Home to consume at a higher utility, such as at point D.
b.
Using Figure 2-6, show2 that an increase in the relative price of wheat from its world relative price
of 3will lower Foreign’s utility. What is Foreign’s utility when the world relative price reaches 1,
and what happens in Foreign when the world relative price of wheat rises above that level?
Answer:2 The increase in the relative price of wheat from its international equilibrium of 3 lowers
*
*
Foreign’s utility to U 3 with consumption at D . When the
international price reaches 1, it becomes the same as Foreign’s no-trade relative price of
*
wheat. Thus, Foreign consumes at point A , the no-trade equilibrium. If the
international price rises above 1, then it would be greater than Foreign’s no-trade
relative price of wheat. In this case, Foreign would switch to exporting wheat instead of
exporting cloth. The world price line now moves inside the PPF, which will lower the
no trade relative price of wheat.
11. (This is a harder question.) Suppose that Home is much larger than Foreign. For example, suppose we
double the number of workers in Home from 25 to 50. Then, suppose that 1 Home is willing to export
up to 100 bushels of wheat at its no-trade price of PW/PC = 2, rather than 50 bushels of wheat as shown
in Figure 2-11. In the following figure, we draw a new version of Figure 2-11, with the larger Home.
a.
From this figure, what is the new world relative price of wheat (at point D)? Answer: The
intersection of the Foreign imports and Home 1 exports gives the new international equilibrium
relative price of wheat, which is 2.
b.
Using this new world equilibrium price, draw a new version of the trade equilibrium in Home
and in Foreign, and show the production point and consumption point in each country. 1
Answer: The international price of 2 is the same as Home’s no-trade relative price of
wheat. Home would consume at point A and produce at point B´. The difference
between these two points gives Home exports of wheat of 80 units. (Notice that
workers earn equal wages in the two industries, so production can occur anywhere
along the PPF.)
Because the international price of 1/2 is lower than Foreign’s no-trade relative
*
price of wheat, Foreign is able to consume at point D , which gives higher
*
gains from trade than at point C .
c. Are there gains from trade in both countries? Explain why or why not.
Answer: The Foreign country gains a lot from trade, but the home country neither
gains nor loses: Its consumption point A is exactly the same as what it would be
in the absence of trade. This shows that in the Ricardian model, a small country
can gain the most from trade, whereas a large country may not gain (although it
will not lose) because the world relative price might equal its own no-trade
relative price. So the large country does not see a terms of trade (TOT) gain. This
special result will not arise in other models that we study, but illustrates how
being small can help a country on world markets!
12. Using the results from Problem 11, explain why the Ricardian model predicts that
Mexico would gain more than the United States when the two countries signed
the North American Free Trade Agreement, establishing free trade between them.
Answer: The Ricardian model predicts that Mexico would gain more than the United
States when the two countries join the regional trade agreement because relative to
the United States in terms of economic size, Mexico is a small country. For the
United States, the world price of its exports is similar to the domestic price. Thus,
there is not much TOT gain. But for Mexico, the world price is much higher than the
domestic price of its exports, so Mexico sees a big TOT improvement.
2 Trade and Technology: The Ricardian Model
Notes to Instructor
Chapter Summary
The first chapters of this textbook address the question of why countries trade with one another. We
will find that the reasons for trade include differences in technology, resources, cost of offshoring, and
proximity to trading partners.
This chapter addresses the first item above, technology, as an explanation for trade. This reason was first
proposed by David Ricardo, a nineteenth-century economist. Thus, the model is called the Ricardian
model.
The Ricardian model is based on the level of technology in use within nations. As the use of technology
within industries varies, some goods will have a comparative advantage over other goods. Having a
comparative advantage in a good means that a country can produce some goods at a lower opportunity
cost compared with their other goods. The Ricardian model will show that a nation will trade in the good
in which it has the comparative advantage in spite of having an absolute advantage with other nations in
producing all goods.
We will also learn that although comparative advantage will determine patterns of trade, absolute
advantage will determine wages within countries. A nation will pay higher wages for the very reason
that it has an absolute advantage in all goods: If it has better technology, its workers will be more
productive and thus will be paid the value of the resulting higher marginal product.
1
The three key lessons of the Ricardian model are as follows: (1) Comparative advantage determines the
pattern of trade; (2) there are mutual gains from trade; and (3) wages are determined by absolute
advantage.
As a sidenote, the snowboard example in the beginning of the chapter serves as an introduction to all the
trade chapters (Chapters 2–7), allowing the instructor to skip Chapter 1 if desired. Keep in mind, though, that
Chapter 1 provides a good overview of who trades with whom and by how much in the real world.
It is also a good overview of the international trade topics that this book discusses. Chapter 1 provides
an excellent background and springboard for students that may help to guide them toward an
understanding of what international trade is really all about today. Too often, we assume it is only about
goods traded across borders, but much more is traded in the factors of production, like capital. And
migration has become a controversial issue as well, and this chapter makes clear why migration is
fundamentally an international trade issue. This material may also help students to connect what they
read in the news with the international trade topics covered in this text. Chapter 1 also offers a good
historical perspective, suggesting that globalization and interconnectedness are not new to the
international stage. In essence, the material in Chapter 1 will connect students to today’s international
trade issues and challenges, while providing an overview of what international trade entails and what
will be covered in this text. However, if you are short on time, this is probably the one chapter that could
be skipped.
Comments
Although most students may be familiar with the concept of comparative advantage from principles of
microeconomics, it is a good idea to reintroduce this concept because many students find it challenging.
This chapter also provides a more in-depth analysis of the Ricardian model by covering the
2
determination of relative prices as well as the relationship between wages and absolute advantage. The
latter is particularly interesting as it is not covered in most trade textbooks. A corresponding application
provides convincing evidence regarding a country’s level of technology and wages.
Lecture Notes
Introduction
Most manufactured products are traded between countries, including the snowboard. In 2014, the United
States imported 350.6 thousand snowboards worth $28.2 million from 18 different countries. The top 12
countries selling snowboards to the United States are shown in Table 2-1, with China at the top of the
list, followed by Austria, the United Arab Emirates, Taiwan, Canada, Switzerland, Germany, Slovenia,
the Netherlands, France, Tunisia, and Slovak Republic. But, why does the United States purchase
snowboards from these countries at all when it already has the resources and technology to produce the
snowboards?
3
To answer this question and understand why countries trade goods with each other, we will examine the
reasons for trade. These trade determinants include proximity (geographic distance between countries),
resources (land, labor, and capital), offshoring, and differences in level of technology.
This chapter focuses mainly on the latter reason, technological differences across countries, and will use
the ―Ricardian model‖ named for nineteenth-century economist David Ricardo to explain trade between
countries with differing levels of technology. The level of technology used by a country will determine
the pattern of trade as well as the wages paid to labor.
1 Reasons for Trade
Proximity The proximity of Canada to the United States means lower transportation costs relative to
4
trade between the United States and countries in Asia or Europe. This close distance between the two
neighboring countries may explain why Canada is not only one of the top exporters of snowboards to the
United States, but also one of its largest trading partner overall. Proximity may additionally be the
reason why Europeans countries mainly trade with each other, whereas Japan or China is the largest
trading partner for many Asian countries. Countries located in close proximity of one another often join
free-trade areas to promote trade by eliminating barriers to trade such as tariffs and quotas.
Resources Resources are another reason that helps to explain why nations trade with one another.
Consider Austria that sells some 30 times more in value to the United States than does Canada, in spite of
Canada being significantly closer. And Mexico (included in the ―All other countries‖ category) sells only
some $6,000. How do we explain why Austria and Canada sell so much more than Mexico?
The reason may lie in the fact that, in contrast to Mexico, both Austria and Canada have cold snowy
mountains ideal for snowboarding. Austria and Canada’s geographic resource provides another reason
for trade. Other resources are land, which also provides minerals; labor resources of various education
and skills; and capital, such as machinery and infrastructure. Land, labor, and capital are often referred
to as factors of production because these resources are used to produce goods and services. Favorable
geographic conditions also help to explain the appearance of some of the other top 12 exporters of
snowboards to the United States, namely, Switzerland, Germany, Slovenia, and France.
And it is important to note that a country can create a comparative advantage. Consider Germany’s
invention of ice wine, which is now also produced in the Niagara Falls region of Canada (see Side Bar:
5
Can Comparative Advantage Be Created?). The United Arab Emirates is another such example, with
a Ski Dubai indoor ski center having opened there. The country has since initiated an industry that
produces high-quality snowboards.
The lower-priced snowboards from Canada ($18) and Mexico ($14) may be indicative of companies
selling unfinished boards that require further processing. The process of trading unfinished goods and
spreading production across several countries is called offshoring. This type of trade is covered in
Chapter 7.
Absolute Advantage Although Germany also has a natural resource, the Alps on its southern border,
the reason it is the seventh largest exporter of snowboards to the United States may be better explained
by its advanced technology. As a world leader in the production of many manufactured goods, Germany
has an absolute advantage in producing snowboards because it has the best technology to produce the
good. Germany is known for producing many products, including machine tools, motor vehicles, and
steel products that require high levels of technology.
However, this raises the question as to why the United States imports about 4 times more snowboards
from China, a country with less-advanced technology relative to Germany. Indeed, it is also puzzling
why the United States, with technology equal to that of Germany, would import snowboards from
either country, rather than producing snowboards on its own.
SIDEBAR
Can Comparative Advantage Be Created? The Case of “Icewine”
By linking the production of ―icewine,‖ first developed in Germany in 1794, to the cold climate of its
6
Niagara Falls region, Canada is able to create a new comparative advantage in producing this sweet
dessert wine.
Comparative Advantage To determine trade patterns, we need to examine the relative rather than
absolute differences in technology between countries. To gain a better understanding of the topic, we
turn to the concept of comparative advantage, introduced by David Ricardo using a simple example
consisting of two countries (Portugal and England) trading two goods (wine and cloth). Ricardo allowed
Portugal to have the best technology or absolute advantage in the production of both goods. In contrast,
although England is capable of producing both goods, it is relatively more difficult for England to
produce wine. Given Ricardo’s assumption that England is better at producing cloth than wine, England
has a comparative advantage in the production of cloth and should export cloth to Portugal. In exchange
for the cloth from England, Portugal should export wine because it has a comparative advantage in the
production of that good.
The concept of comparative advantage may explain why the United States imports more snowboards
from China than Germany, even though China has less-advanced technology in the production of
snowboards relative to Germany or the United States. The remainder of the chapter provides more
detail about this fundamental theory in international trade.
SIDEBAR
David Ricardo and Mercantilism
David Ricardo introduced the concept of comparative advantage as the basis for trade in response to the
mercantilist school of thought that a country should actively export while preventing imports with high
7
tariffs on foreign goods. Assuming that countries have balanced trade, Ricardo showed that these
countries could benefit by engaging in free trade. Ricardo’s ideology of trade without barriers is the
foundation of many international institutions, such as the United Nations, World Bank, and World
Trade Organization (WTO).
2 Ricardian Model This section provides a detailed example of the Ricardian model with the home
country trading wheat and cloth. We will find that absolute advantage is not a good reason for trade and
that a better understanding of trade comes from a good understanding of comparative advantage within a
nation. The comparative advantage model will show that the home country (Home) should export wheat
and import cloth in spite of being able to produce both wheat and cloth cheaper than its trading partners.
The Home Country To gain a better understanding of the main concepts of the Ricardian model, we
simplify the example by assuming that labor is the only factor of production for both goods. We use the
information that one worker at Home can produce 4 bushels of wheat or 2 yards of cloth per hour. The
marginal product of labor (MPL) of each good per hour at Home is then given by MPLW = 4 · MPLC =
2.
Home Production Possibilities Frontier Suppose that there are
= 25 workers in the home country.
We will begin by plotting Home’s production possibilities frontier (PPF). To graph the PPF, we
calculate the maximum bushels of wheat Home could produce in an hour if all workers were employed
in producing wheat. They could produce QW = MPLW ·
= 4 · 25 = 100 bushels of wheat per hour. If
instead all workers were employed in cloth, then they could produce QC = MPLC ·
= 2 · 25 = 50 yards
8