Pro SQL server 2012 BI solutions
Bạn đang xem bản rút gọn của tài liệu. Xem và tải ngay bản đầy đủ của tài liệu tại đây (44.87 MB, 823 trang )
www.it-ebooks.info
For your convenience Apress has placed some of the front
matter material after the index. Please use the Bookmarks
and Contents at a Glance links to access them.
www.it-ebooks.info
Contents at a Glance
About the Authors....................................................................................................... xxiii
About the Technical Reviewers................................................................................... xxv
Acknowledgments..................................................................................................... xxvii
■■Chapter 1: Business Intelligence Solutions..................................................................1
■■Chapter 2: A Big-Picture Overview. ...........................................................................13
■■Chapter 3: Planning Solutions....................................................................................85
■■Chapter 4: Designing a Data Warehouse..................................................................131
■■Chapter 5: Creating a Data Warehouse. ...................................................................161
■■Chapter 6: ETL Processing with SQL........................................................................213
■■Chapter 7: Beginning the ETL Process with SSIS.....................................................253
■■Chapter 8: Concluding the ETL Process with SSIS...................................................301
■■Chapter 9: Beginning the SSAS Project....................................................................335
■■Chapter 10: Configuring Dimensions with SSAS......................................................389
■■Chapter 11: Creating and Configuring SSAS Cubes..................................................435
■■Chapter 12: Additional Cube and Dimension Configurations. ..................................483
■■Chapter 13: Creating Reports with SQL Queries.......................................................529
■■Chapter 14: Reporting with MDX Queries. ...............................................................565
■■Chapter 15: Reporting with Microsoft Excel. ...........................................................615
■■Chapter 16: Creating Reports with SSRS. ................................................................653
■■Chapter 17: Configuring Reports with SSRS............................................................693
v
www.it-ebooks.info
■ Contents at a GlanCe
■ Chapter 18: Testing and Tuning BI Solutions ...........................................................731
■ Chapter 19: Approve, Release, and Prepare ............................................................767
Index...........................................................................................................................797
www.it-ebooks.info
Chapter 1
Business Intelligence Solutions
Business intelligence (BI) solutions are all the buzz as of late, and BI developers are highly sought after.
Considering the amount of data that needs to be tracked to run a business successfully, it is no wonder. When an
employee has been with a company for 20 years, how will management be notified? Perhaps staffing is suffering
because of vacation trends or sales need to be tracked after targeted advertising. Maybe product preordering for a
sales event needs to be estimated, or who sold what and when needs to be documented for an upcoming contest.
There is no end to how much data needs to be managed, and countless hours, money, and resources
are wasted in attempts to research the information, often with minimal results, multiple errors, and missed
opportunities in decision making. And when more than one employee needs access to the same information, the
errors are often multiplied.
With a well-designed BI solution, important data can be called up instantly in a user-friendly manner.
Calculations are made with a click of a button, and reports are easily generated. No longer will that 20-year
employee be unrecognized for such a long duration of loyalty and service. Staffing can be more properly
managed, advertising can be better targeted to the proper demographic, and so on.
This book shows how to build a successful BI solution step-by-step. We cover the entire process from initial
preparations and planning to complex layers of designing and configuring your project, and from creating reports
to drafting user instructions, and releasing your project. This book is simple in its approach. If you are new to
BI solutions, you will find the instructions thorough and easy to follow with clear images to demonstrate the
process. Yet, it is fast-paced and rich enough in information for even the most advanced database professional to
learn from.
Who Should Read This Book?
This book is for each professional who works with the many aspects of BI solutions. These include database
administrators, project managers, testers, support techs, report developers, and many others.
This book is not a sales pitch for the latest features of SQL server. Nor is it focused on technologies designed
only for very large companies. Instead, this book is about how small, medium, and large companies, as well as
departments within those companies, can take advantage of Microsoft SQL Server’s effective and inexpensive BI
software. This book defines the glue that is used to bind all four of Microsoft’s BI servers (MSSS, SSIS, SSAS, and
SSRS) together into a BI solution.
After reading this book and working through the recommended exercises, you will have the tools to build
your own BI solutions, as well as interact with other BI team members with a greater understanding of their roles
within the BI solution process.
1
www.it-ebooks.info
CHAPTER 1 ■ Business Intelligence Solutions
What Is a Business Intelligence Solution?
A BI solution is a collection of objects that allows data to be turned into useful information. These objects must be
designed, created, tested, and ultimately approved to create a working BI solution.
When creating a BI solution, it is important first to understand what that solution consists of, how each
component is combined to create the whole, and finally, how to recognize when you have achieved your goal.
Knowing where to begin is vital to the success of your project. In Figure 1-1 we have outlined eight steps to
use as a guideline. We progress through each of these steps and explain them in detail throughout this book. We
also develop working BI solutions in the exercises within each chapter to gain the skills necessary to complete
increasingly complex solutions in your future. Chapter 2 provides an overview of the entire process.
Figure 1-1. The BI solution life cycle
We chose to represent the tasks in Figure 1-1 as a circle, because the nature of a BI solution is one of continual
change. As time goes by, a company’s requirements change, the data that is available changes, and the technology
to bring these two aspects together changes. Because of this, the process of creating a BI solution can often begin
with the continuation of a prior solution, with each successive iteration refining and extending the current solution.
Perhaps the first step is to define the questions that your BI solution will answer. An example might be, how
are our products selling? Another question might be, how often do people use our website?
One common misconception about BI solutions is that they are useful only to large corporations. This is
simply not true. Clients as seemingly dissimilar as a dentist and a horse breeder will find they need to keep
detailed records of important information, from patient visits to horse lineage. This information is used to
determine their future plans or review past activities. Every business, group, and individual who needs to keep
track of data will have questions they would like to have answered that a BI solution can provide. Formulating
these questions and determining what to do with them lead us to the first step in developing a BI solution.
Step 1: Interview and Identify Data
The process of designing your solution begins with interviewing your client to determine what type of
information is needed. Chapter 3 discusses the types of questions to ask and what the interview process entails.
2
www.it-ebooks.info
CHAPTER 1 ■ Business Intelligence Solutions
The answers to these questions allow you to better locate the data necessary for your solution. Data can be found
in many forms, and you may use one or more types to fill your requirements.
Some common data sources include the following:
•
Spreadsheets
•
Existing databases
•
Simple text files
•
Log files
•
XML text files
•
Paper documents
Once the data is located, the next step is to decide how much of it is relevant to your needs. You also need to
decide whether your data’s current location is sufficient for your BI solution’s needs or whether you must copy
some or all of the data to a more appropriate location. This leads us to step 2.
Step 2: Plan the BI Solution
Few developers relish creating extensive documentation before building a project. And yet, just as it is necessary
for blueprints to be drawn up and approved before a home is built, projects must be planned and documented
before creating a working BI solution.
In Chapter 4 we discuss creating a description of what your solution will accomplish, documenting the
source and the destination objects, and beginning the formal documentation. A solution’s formal document can
be laid out with common tools such as Microsoft Excel or even Microsoft Word. These Excel or Word documents
can then be taken back to the client for approval. Once approved, these documents will become an outline that
can be worked with much like a blueprint. You then create Visual Studio projects that become the building blocks
of your BI solution from these blueprints.
Step 3: Create a Data Warehouse
Your BI solution data will typically end up stored in a data warehouse database. Microsoft’s SQL Server 2012
makes this very easy and cost efficient. Microsoft’s SQL Server takes time and effort to master, yet the vast
majority of tasks required to build your solution are performed using tools that are as simple to use as Microsoft’s
user-friendly Access database application.
In Chapters 4 and 5, we show how to design and implement a data warehouse database yourself, regardless
of your level of experience with Microsoft’s SQL Server. Various design options are demonstrated in these
chapters, such as star versus snowflake dimensions and how to create fact and dimension tables. Once complete,
you will understand the design differences between online transaction processing (OLTP) and data warehouse
tables similar to those shown in Figure 1-2.
3
www.it-ebooks.info
CHAPTER 1 ■ Business Intelligence Solutions
Figure 1-2. OLTP and data warehouse databases
Step 4: Create an ETL Process
Getting data from the original source to your data warehouse entails extracting the data from its original location,
transforming the data to be consistent with your new data warehouse design, and loading the data into the new
data warehouse location. This ETL process is discussed in great detail in Chapters 6, 7, and 8.
Although this process can be one of the most in-depth and complicated tasks in developing your BI solution,
Microsoft SQL Server 2012 provides invaluable tools to help you accomplish it, saving time and simplifying the
process for you. Using a combination of SQL programming and SQL Server’s Integration Server (SSIS), you will
create an ETL process much like the one shown in Figure 1-3.
4
www.it-ebooks.info
CHAPTER 1 ■ Business Intelligence Solutions
Figure 1-3. Working with SSIS
Step 5: Create Cubes
Microsoft SQL Server 2012 includes an additional high-performance server for hosting OLAP cube databases
called SQL Server Analysis Services (SSAS).
Both the standard, relational data warehouse, and the SSAS cube databases have their place in BI solutions.
The relational data warehouse contains a set of one or more tables and is by far the most commonly used
database type. We work with this relational type of database extensively in Chapters 4 and 5. The second type
of database contains one or more cubes instead of tables. You can think of these cubes as a set of report tables
combined into a single object. Figure 1-4 illustrates how a cube is configured using an SSAS project in Visual
Studio 2010. We discuss constructing and configuring cubes in Chapters 9 through 12.
5
www.it-ebooks.info
CHAPTER 1 ■ Business Intelligence Solutions
Figure 1-4. Configuring a cube in SSAS
Step 6: Create Reports
Once you have your data loaded into a data warehouse and/or cube, you need to create preliminary reports
to continue your work. These may be your first reports for your BI solution, but they certainly will not be the
last. The end goal of a BI solution is to convert data into usable information, and that information is routinely
represented within reports.
The term BI solution is not very self-explanatory. It might be better if the industry as a whole changed the
term business intelligence solutions to business reporting solutions. Even make life easier on managers solutions
might be more descriptive than business intelligence solutions.
■■Note About a year ago, Randal performed a casual experiment to see how many of his co-workers within the IT
industry understood what the term BI solution meant. As he expected, 90% did not know. Some guesses were pretty
comical. A favorite was “intelligent robots for businesses.” But many guesses were nothing more than a long string
of verbs in search of a definition. As you might imagine, only about 10% of his co-workers had a problem figuring
out what a reporting solution was.
No matter what you call your BI solution, the most common output is a set of reports that present
meaningful information to your users. You have many reporting tool options from which to choose. In this book,
we focus on using the most readily available Microsoft technologies to create your BI reports, including Excel and
SQL Server Reporting Services (SSRS).
Deciding what type of data source the reports will use is an important aspect of reporting. A typical pattern
in the industry begins with simple solutions and moves progressively toward more complex ones over time
(outlined in Figure 1-5).
6
www.it-ebooks.info
CHAPTER 1 ■ Business Intelligence Solutions
Data Warehouse with Procedures and Views and Cubes
Reports
Data Warehouse with Procedures and Views
Reports
Over Time
Separate Reporting Database
Reports
Stored Procedures or Views
Reports
Reports
Existing Tables
Figure 1-5. An example of how reporting data sources change over time
Many companies begin by selecting report data directly from OLTP relational tables. Quite often, they come
to regret this choice when performance issues occur and maintenance costs rise. It has long been considered a
poor choice to do so, yet this is still happening in businesses today.
An improvement on this design, and what is considered to be “best practice,” is to create views or stored
procedures that select data from one or more OLTP tables and use these as the source for all of your reports.
Many reports can then be created against a single view or stored procedure, which makes maintaining your
reports much easier over time. For example, consider a scenario where a decision has been made that all tables
must be renamed to start with the letters tbl_. All that you need to do to keep your reports working properly is
change the table names in the select statements within the view or procedure to reflect the new table names,
while maintaining the same output from the view or procedure. With this simple step, your reports will continue
to work as they always have. Chapter 13 of this book shows how easy it is to create both views and stored
procedures.
Stored procedures and views can access data in the same database, across databases, and even across
different database servers. You will gain better performance, however, when you query data from a dedicated
reporting database, otherwise known as a data warehouse. These report databases are designed to provide simple
and efficient reporting. Once the data warehouse has been created, you need an ETL process to copy the data
from its original locations to the new reporting data warehouse database.
■■Note The term data warehouse can have a number of meanings. In this book, a database designed for reporting
with one or more centralized fact tables containing measured data such as sales quantities, with zero or more supporting dimension tables containing additional measured data descriptions, is considered a data warehouse. You may
hear this type of database referred to as a data mart, data silo, data factory, and a host of other names. However,
Microsoft documents refer to it as a data warehouse, so we do too.
Additional report performance is provided by using SSAS cubes. This performance increase, however, is
at the cost of your solution becoming more complex. The most common complexity is that cube databases use
different programming languages than relational databases. We discuss the most common of these programming
languages, known as MDX, in Chapter 14.
To round out your report-building skills, we present report-building applications in Chapter 15. We work
with Microsoft’s desktop-based reporting application, Excel 2010. Then, in Chapters 16 and 17, we create reports
using Microsoft’s server-based reporting application, Reporting Services 2012.
7
www.it-ebooks.info
CHAPTER 1 ■ BusinEss inTElligEnCE soluTions
Step 7: Test and Tune the Solution
Once you have built your first reports, you need to test those reports for accuracy, visual consistency, and
performance. The most important of the three is accuracy. If the reports are slow or do not look professional, it is
indeed cause for concern, but if your reports are inaccurate, your entire BI solution will fail! We cover a number
of ways to plan and implement testing procedures in Chapter 18. We also include important performance-tuning
techniques in Chapter 18 to insure your reports run quickly for your end users.
Step 8: Approve, Release and Prepare
At the end of the solution development cycle, you need to package and deploy your documents, scripts,
databases, and reports. You also need to create user documentation, as well as train your users to use your newly
developed BI solution. These topics are discussed in the last chapter of this book, Chapter19.
Practice Exercises and More
Rather than just talking about all of these subjects, the chapters in this book offer detailed instructions on how to
perform your BI solution tasks with step-by-step practice exercises that build upon each other from one chapter
to the next. We created simple, easy-to-follow examples that outline key principles applicable to both large and
small BI solutions.
We also offer “Learn by Doing” activities at the end of each chapter. These activities provide an outline and
hints indicating which course of action to take, but they allow you a chance to practice your skills without such
detailed instructions. Table 1-1 describes the exercises within this book.
Table 1-1. Exercises in This Book
Exercise Type
Description
Instructions
Exercises
Detailed, progressive, step-by-step
instructions that correspond with the
subject matter within each chapter. A
complete and functioning BI solution is
created by the end of this book.
Detailed instructions are included within
each chapter.
Learn by Doing
A simple outline of the steps required
to implement a BI task that corresponds
to the subject of each chapter.
Outlined instructions are within folders
included in the downloadable book content.
See this book’s catalog page at www.apress.
com/9781430234883.
You are given the opportunity to accomplish multiple BI tasks by the end of each chapter. The goal is to help
you master the steps involved in building your own real-world BI solutions.
Downloadable Content
All example projects, exercises, and scripts have been organized into folders by chapter and compressed into zip
files. This downloadable content includes all of the BI solution files and information pertaining to the locations of
the original databases to make these files work.
You may at times need a hint on how to complete a task. Not to worry, help is available in the form of
completed and commented solutions to each standard exercise and “Learn by Doing” exercise.
8
www.it-ebooks.info
CHAPTER 1 ■ Business Intelligence Solutions
All of this and more can be found on the Apress website: www.apress.com. See the catalog page for this book
at www.apress.com/9781430234883.
In addition, there is even more content available on each of the author’s websites: http://NorthwestTech.
org/ProBISolutions and www.keystrokepublications.com. Here you will find things that just could not fit
within this one book such as articles, demos, templates, and videos!
Our Example Scenarios
We work on two BI solution scenarios in this book. Each scenario is based on a sample database created by
Microsoft for demonstration purposes. The databases are as follows:
The Publications BI solution: The Pubs database was created in the 1980s for both
Sybase’s and Microsoft’s SQL Server demonstrations. Pubs has a number of flaws in its
design, naming conventions, and datatyping. This provides an opportunity to remedy
the flaws during the creation of the data warehouse and the ETL process, just as you
would find in a real-world scenario. This database also has a number of archetypal
data structures useful for highlighting advanced dimensional structures. Another
advantage to the Pubs database is that it is the simplest Microsoft demonstration
database available. Because of all of these features, we use it as the focal point for the
in-chapter practice exercises.
The Northwind Foods BI solution: Made in the early 1990s, the Northwind database
is larger and slightly more complex than the Pubs database. It was also created for
demonstrations by Microsoft and has numerous design flaws that are discussed and
addressed in our data warehouse and ETL processes. This database is used to frame
the “Learn by Doing” exercises for each chapter.
All of these databases are readily available and have been used as examples in hundreds of books. Because
of this, you may already be familiar with these databases, and you can easily find additional information and
code samples to enhance your understanding.
Setup Instructions
Although we have tried to keep the setup requirements as light as possible, there are still a number of complex
tasks that need to be performed before you can get the full benefit of this book. You need the following items:
•
A full install of SQL Server 2012 developer edition, with all of its supporting servers (SSIS,
SSAS, and SSRS)
•
The Pubs and Northwind databases
•
Administrator-level access to SQL Server and its supporting servers (SSIS, SSAS, and
SSRS)
We included setup instructions, files, and videos in a single folder called _SetupFiles that is included
as part of the downloadable content from the Apress website, www.apress.com. Therefore, you have only one
downloadable file to worry about. This folder is inside the same zip file as the exercises.
Of course, you have to unzip the file before you can use it. We include detailed instructions on how to copy it
to the root of your C:\ drive in Chapter 2, but you can unzip the downloadable content anywhere you want until
then. On a Windows 7 PC, the typical location would be the Downloads folder.
9
www.it-ebooks.info
CHAPTER 1 ■ Business Intelligence Solutions
In Figure 1-6, we have unzipped the file and copied the resulting folders to the location described in Exercise 2-1.
Figure 1-6. Setup files and folders
Please review the files in this folder before you start to go through this book. Full instructions are found
inside the _SetupFiles folder.
■■Tip We have included additional videos and links that can help you tackle the installation if you still feel overwhelmed. These are found on one of the author’s websites at www.NorthwestTech.org/InstallingSoftware.
Think Small, Win Big
Creating BI solutions has never been easier. The tools that many vendors offer have become more refined and
user-friendly than was dreamed of a decade ago. Still, even with good and inexpensive tools, a BI solution can go
horribly wrong if it is not planned and implemented properly.
In the past, a number of approaches have been attempted to ensure that BI solutions have a big impact
on a business. One early approach was to include everything that was needed by the business into one master
solution. These solutions often took years to complete and were not always consistent with a company’s current
needs by the time they were finished. This led to a number of issues that have now become widely believed
misconceptions about BI solutions. These misconceptions include the following:
•
They take years to implement before anything useful is available to the end users.
•
They take months of planning before they even get started.
•
They cost a lot of time and money.
•
They are a luxury, applicable only to large companies with large budgets and large
development teams.
10
www.it-ebooks.info
CHAPTER 1 ■ Business Intelligence Solutions
Large and long-term solutions have their place, but they are not always necessary. Many companies can
benefit immediately from small, quickly designed, and quickly developed solutions. We even go as far as to say
that most BI solutions will easily fit this pattern.
A number of changes in IT over the past decade have allowed small BI solutions to become viable. The
computers and the software that we run on them are more powerful and less expensive. Something as simple as
a Microsoft Excel spreadsheet, for example, can now work with millions of rows at once, allowing you to create
very simple BI solutions starting with that tool alone. Microsoft’s SQL Server, which has always been reasonably
priced, can now work with many terabytes of data, run distributed queries among a collection of servers, and
comes with powerful BI tools such as Integration Services, Analysis Services and Reporting Services, at no extra
cost. To see what we mean, compare earlier versions of Microsoft Excel and SQL Server. You will see that the cost
to purchase these tools, without all of these new features, was roughly the same in the 1990s as it is today, not
even taking into account the difference due to inflation.
The combination of more powerful computers and inexpensive software add up to a big win for small to
midsize businesses. These businesses can now afford to perform BI tasks that traditionally only their larger
competitors were capable of.
The following examples give an idea of how small BI reporting solutions can provide a big win to any type of
business:
•
Monthly sales reports for a gift shop
•
Reports on a development team’s projects over time
•
Reports that track medication dispensed within a medical clinic
•
An auto part store’s inventory reports
•
Reports that track support calls to a call center
Considering how reporting solutions can be beneficial to companies with 10 employees or 10,000
employees, it is no wonder that BI is such an expanding aspect of our IT industry.
Rapid Application Development for BI Solutions
Once you have established the need for BI solutions, how do you successfully plan, start, and complete them?
Although there is no single answer, experience has shown that completing simple, fast, and extensible solutions
are the most likely to provide the best cost-to-benefit ratio.
One of the more popular ways to initialize the development process is by using the techniques associated
with rapid application development (RAD). In RAD, you start with a short planning phase, followed by a short
development phase working on a simple prototype. You then test your prototype for accuracy, consistency, and
performance. Once the testing phase has passed, the next step is to release the prototype for comments and
prepare to start the next iteration of your solution. This next version of your solution takes comments about the
existing features into account and extends the previous solution with new ones. The cycle continues, providing
increasing benefit to your users over time.
RAD will not work for all projects, but it will work for a majority of them. This is one of the more successful
techniques in the industry today; therefore, we focus on building solutions based on this methodology.
Moving On
In this chapter, we have outlined the steps needed to create a BI solution and discussed the subject matter
covered in this book. In Chapter 2, we take a more in-depth look at the entire process by building a very simple BI
solution. We start with gathering solution requirements and end with a simple, functioning prototype BI solution.
It is time now to get your hands dirty and start work!
11
www.it-ebooks.info
CHAPTER 1 ■ Business Intelligence Solutions
What’s Next?
In each chapter, we have made our best attempt to focus on what is essential knowledge for every BI professional.
We realize that this topic is much too complex for any one book and our essentials may not cover all you need to
know. To help further your understanding of the topic within each chapter, we have included reading suggestions
for further study.
For more information on RAD, we recommend the book Rapid Development: Taming Wild Software
Schedules by Steve McConnell (Microsoft Press).
12
www.it-ebooks.info
Chapter 2
A Big-Picture Overview
Eschew the monumental. Shun the Epic. All the guys who can paint great big pictures can paint
great small ones.
—Ernest Hemingway
Having a clear overview of how a BI solution is constructed can be one of the most important tasks to ensure a BI
solution’s success. To understand how a BI solution works, it is important not only to understand its individual
projects but to comprehend how these projects integrate into a solution. Jumping into the intricate details
without having a full understanding of where each piece of the puzzle fits is setting yourself up for failure. In
other words, before starting work on any part of the solution, you need to see and comprehend the big picture.
The process of learning to create a BI solution is not much different. Therefore, to avoid the mistake of
jumping in to create the individual projects that make up the solution, in this chapter we walk you through an
entire BI solution from start to finish. You will see how each component is integrated and how they function
together as a complete solution. Later, as you progress through the other chapters of this book, you will delve
deeply into each of the component projects. This overview will help you understand the big picture.
The 10,000-Foot View
To start, let us list the steps that you will be performing in this solution. You begin building the solution by looking
at the solution requirements and isolating the data you will be working with. You then move onto documenting
the requirements and building your data warehouse. When the data warehouse is complete, you fill it up with
data using a SQL Server Integration Service (SSIS) package. After filling the data warehouse, you create a cube
and finally a report against the cube you have created.
Figure 2-1 shows a representation of these components. There are icons in the upper left of the figure
representing the original source of the data. These original sources may be database tables or files, but in
either case, you must review these objects in order to isolate the data you need for your particular BI solution.
Afterward, move the data from its original source location into a data warehouse database.
13
www.it-ebooks.info
CHAPTER 2 ■ A Big-Picture Overview
Figure 2-1. A BI solution overview
The data warehouse you create is designed on the principles of an online analytical processing (OLAP) style
of database utilizing dimensional and fact tables. This is a different style of design than the online transactional
processing (OLTP) databases that most developers are familiar with. The design differences are based upon their
purpose. Databases that focus on gathering new data are designed around the OLTP format. The OLAP format
focuses on providing information from existing data. As you will see later, you work with both OLTP and OLAP
databases in a BI solution. OLAP databases come in two common forms: relational databases and cube databases.
Relational databases use tables to contain the reporting data, while cube databases use cubes instead. This makes
sense when you remember that the terms tables and relations are synonymous in database terminology.
In a BI solution, data warehouses are created using relational databases in an OLAP format. Nevertheless,
you may also create an OLAP cube in addition to the data warehouse. Note that in Figure 2-1, we have displayed
this connection between these two objects with a dotted line, indicating that the cube database represents an
optional component.
Not all BI solutions need a cube database. In fact, many companies choose to create reports using the
data warehouse alone. In Figure 2-1, the thin lines from the data warehouse to the reporting options represent
this standard scenario. In addition, it is still possible to pull report data from the original online transactionprocessing (OLTP) databases when needed, indicated in Figure 2-1.
The data warehouses and cubes provide additional options that make these structures desirable. For
instance, because SSAS cubes host data mining capabilities, you can pull data mining results to your reports
through your cubes. Another advantage of having a cube is that a variety of reporting applications are available
designed to work with cubes alone.
Interviewing and Isolating Data
In any BI solution, the first course of action is interviewing the client or company owner that needs the solution.
Because we do not have real life clients to interview, we describe the scenario here. Let’s consider the following
as our letter of engagement:
14
www.it-ebooks.info
CHAPTER 2 ■ A Big-Picture Overview
Dear Consultant,
I need reports that will give me information about weather patterns. Currently, I have been
collecting data in the format shown in Table 2-1. I track the dates, the maximum and minimum
temperatures, and the events of that day. Could you please create an example of what you do
for customers like me?
Sincerely,
A Typical Client
And as the letter promises, Table 2-1 shows an example of the data.
Table 2-1. The Data in the WeatherHistory.txt File
Date
Max TemperatureF
Min TemperatureF
Events
1/23/2011
48
43
Rain
1/24/2011
51
46
Rain
1/25/2011
52
38
Rain/Sun
1/26/2011
53
41
Rain/Sun
1/27/2011
50
37
Fog
The client has not provided much detail, which is consistent with what you are likely to see in a real-life
scenario. Yet once you review the data, you will find you have enough to get started. Besides, creating the
prototype solution is often better than asking for more details when you are first trying to understand a client’s
needs. You are more likely to understand what questions to ask and be able to extract more information from the
client in a second interview after you have created a simple prototype.
If you want to understand what is needed in a BI solution, start by understanding its data. For example, look
at the range of values and data types noted in Table 2-1. You can see under the date column, for example, that the
customer is using days, months, and years, but not hours or seconds. You can see whole values without decimal
points under the maximum temperature column. You can also see that the client is using text descriptions in the
Events column.
These facts give you vital clues about what your solution can accomplish. For instance, you will be able to
create reports that tell you it was raining on a particular day, but not whether it was raining at noon on that day.
Once you have evaluated the data and identified what is available, you can begin the planning phase for the
solution.
Plan the Solution
In each BI solution, you should create a document describing what you are trying to accomplish. Creating this
document is the first part of the planning phase.
You also need to decide on a place to store your documentation. This location should be readily accessible
to any team member working on the project. In this book, we use a subfolder in a Visual Studio solution folder
as our document repository. This is convenient, because we are going to create several Visual Studio projects,
and each of these projects will be added to the same Visual Studio solution as our documentation folder. Once
complete, all of the projects and the documentation that defines those projects will be included under a single
Visual Studio solution folder on the hard drive.
15
www.it-ebooks.info
CHAPTER 2 ■ A Big-Picture Overview
Creating Planning Documents
We created two tables (Tables 2-2 and 2-3) that document information about the client’s data and what we know
about it so far.
Table 2-2 lists the data source combined with descriptive names in one column and the data types in the other.
Because all the data is coming from a text file rather than an existing database table, the data types are all strings.
Table 2-2. Documenting the Source
Data Source
Source Data Type
FlatFile.Date
String
FlatFile.Max TemperatureF
String
FlatFile.Min TemperatureF
String
FlatFile.Events
String
In Table 2-3, you see a listing of the destination columns, destination data types, any transformations we can
expect to use, and an example of the outcome of those transformations. The purpose of this is to document the
design of the destination tables, so we have listed the appropriate data types.
Table 2-3. Documenting the Destination
Data Destination
Destination
Data Type
Transformations
Example
DimDates.DateName
datetime
add zero as needed
and cast to datetime
01/23/2011
FactWeather.MaxTempF
int
cast to int
48
FactWeather.MinTempF
int
cast to int
43
DimEvents.EventName
varchar(50)
n/a
Rain
We often informally record source and destination information using a Microsoft Excel spreadsheet. From
this informal evaluation, we then proceed to create more formalized documents toward the end of the solution
life cycle. The formal documents will become a part of the BI solution we deliver to a client, while the informal
spreadsheet is for development.
One advantage of using Excel is that it may be used to outline many parts of the solution using the different
worksheets within one workbook.
As an example, one of the worksheets can include the informal information we have laid out in Tables 2-2
and 2-3, which defines the Extract Transform and Load (ETL) process in a solution. Figure 2-2 shows that we
have recorded the need to extract dates from the flat file and convert the string data into a datetime data type, on
a worksheet called ETL Planning.
16
www.it-ebooks.info
CHAPTER 2 ■ A Big-Picture Overview
Figure 2-2. Documenting the plan
During the planning phase, researching how to accomplish the types of transformations you need during
the ETL process helps us estimate what needs to be done during the ETL process. It also lets us contact the client
earlier if we discover a problem. Although you do not actually create the ETL process yet, you do want to feel
confident that you can accomplish the task when the time comes.
Listing 2-1 shows SQL code that takes a date as a string of 11 characters like those found in the text file and
converts them into datetime data. One of the transformations listed in the Excel file in Figure 2-2 requires this
change; thus, we can test how this is accomplished and whether this data will be clean enough to use for the ETL
process we perform later.
Listing 2-1. Sample ETL Code
-- Convert the string to datetime
Declare @Date Char(11)
Set @Date = '1/23/2011'
Select @Date; -- Outcome = 1/23/2011
Select Convert(datetime, @Date) -- Outcome = 2011-01-23 00:00:00.0
Adding Documents to Visual Studio
At this point, we have two documents that outline the BI solution: the original file and our Excel workbook. We
should now think about organizing our work by grouping the documents in some manner. As we mentioned
earlier, we are placing the documents into a folder that will be added to a Visual Studio solution.
If you are not familiar with Visual Studio already, you should know that it organizes projects and code files
under a structure Microsoft calls a solution. These Visual Studio solutions consist of a folder with a set of XML
files that identify which projects and files are part of the solution.
Creating Visual Studio Solutions and Projects
You can create a Visual Studio solution in a couple of ways. For example, if you create a Visual Studio project, a
Visual Studio solution will automatically be created for you. If you are not ready to make a project yet, you can
also create a blank solution and add projects to it later. In both cases, you can add documentation and script files
to the solution folder at any time.
Each project you make in Visual Studio uses a predefined template. These templates are part of various plugins to Visual Studio. Once a project plug-in installs, it becomes part of Visual Studio, similar to how the Adobe’s
Flash plug-in becomes part of your web browser.
17
www.it-ebooks.info
CHAPTER 2 ■ A Big-PiCTuRE OvERviEw
The Visual Studio plug-in that comes with SQL Server is either SQL Server Data Tools (SSDT) or Business
Intelligence Development Studio (BIDS) depending on which version of SQL Server you install. As of SQL 2012,
BIDS is a subset of SSDT, but in earlier versions it was a stand-alone plug-in. You may find the terms BIDS and
SSDT used interchangeably on the Internet, but do not let it worry you too much. Think of SSDT as the newer
version of BIDS instead of its replacement, and you will be fine. As you read though this book, you will notice we
usually refer to both generically as Visual Studio.
With the BIDS/SSDT plug-in to Visual Studio, you can design SQL Server Integration Services (SSIS), SQL
Server Analysis Services (SSAS), and SQL Server Reporting Services (SSRS) projects using templates. These install
automatically into Visual Studio 2010 when you install SQL Server 2012. In fact, if you do not have Visual Studio
2010 already, the SQL Server installation will install it as well.
If it still seems confusing, consider the following:
•
Visual Studio is a host for development tools.
•
If we were to install Microsoft’s C# development tools, for example, it would install Visual
Studio and the C# development plug-in for Visual Studio.
•
If we decided later to add Microsoft’s Visual Basic .NET, it only needs to install the plug-in
to the already installed Visual Studio.
If we decided later to add Microsoft’s SQL Server Data Tools, the installation checks to see whether a
compatible version of Visual Studio is already installed: if not, it will install it for you. If it already is installed,
it just adds the SSDT plug-in as an additional development tool. Either way, the BIDS/SSDT plug-in becomes
part of Visual Studio 2010.
W
Note we provide a lot of detail about how to use these project templates throughout the book, so don’t be
intimidated by the sudden inundation of acronyms. in this chapter, we created all the projects for you as part of the
downloadable content. All you need to do is review these projects as we continue through this chapter.
Using Visual Studio
Visual Studio 2010 can be accessed either through SQL Server’s menu item (Windows Start Button ➤ All
Programs Microsoft SQL Server 2012 ➤ SQL Server Data Tools) or under the Visual Studio menu item (Windows
Start Button ➤ All Programs ➤ Microsoft Visual Studio 2010). Both options open Visual Studio 2010 and present
a selection of project templates in the New Project dialog window (Figure 2-3).
18
www.it-ebooks.info
CHAPTER 2 ■ A Big-Picture Overview
Figure 2-3. Creating a blank Visual Studio solution
In Figure 2-3, under Installed Templates, you can see Business Intelligence, Visual Basic, C#, and other
categories listed. Beneath these template categories are the templates themselves. To select a template, click a
category listed in the treeview and then choose a template in the center of the dialog window.
Each category can have many templates, so Microsoft includes subcategories to help organize the templates.
For instance in Figure 2-3, you can see that there is only one template called Blank Solution, under Other Project
Types ➤ Visual Studio Solutions.
Be warned, you may not see the same categories and templates on every computer! Those shown in
Figure 2-3 appear because the screenshot was taken on a computer that had all of these plug-ins installed.
If, however, you only have SQL Server installed, then you will not see the Visual Basic or C# plug-ins on your
computer. Instead, you will see only BI projects. That is not a problem, of course, because that is exactly the
type of project we want to create.
Creating a Blank Solution
In Visual Studio, new solutions that do not use a project template are referred to as blank solutions. Creating a
blank solution is quite easy. This is done by selecting File ➤ New ➤ Project from the file menu option.
When the new project dialog window opens, a list of project types is displayed on the left side of the screen.
Expanding the Other Project Types by clicking the small arrow (or triangle) allows you to select the Visual Studio
Solutions option (Figure 2-3).
Because a Visual Studio solution is a collection of one or more projects, we have named the solution
WeatherTrackerProjects in the Name textbox. Place the solution folder somewhere that is easy to find. In
Figure 2-3, we typed C:\_BISolutions into the Location textbox. (This naming convention corresponds to the
downloadable content and the step-by-step guide within the exercises.)
19
www.it-ebooks.info
CHAPTER 2 ■ A Big-Picture Overview
Working with the Blank Solution
After you have chosen a template and configured both the name and location, click OK to close the dialog
window and begin working with the new solution. Behind the scenes, Visual Studio creates a number of files and
folders, but all you see is a single folder displayed in a treeview-based window called Solution Explorer. This is the
main window used to work with Visual Studio solutions.
■■Note Visual Studio automatically generates new subfolders for each project within the solution folder. In addition,
because we specified a nonexistent folder (C:\_BISolutions), Visual Studio creates both the _BISolutions folder
and the WeatherTrackerProjects solution folder for us. In this book, we use the _BISolutions folder to organize
all of our solutions folders under one principal folder.
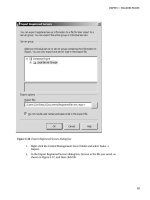
When you create a blank solution, Visual Studio shows the solution name in the Solution Explorer window
but not much else. We are going to add a new solution folder specifically to hold our solution documents by
clicking the Add New Solution Folder button circled in Figure 2-4. Once you click this button, a new folder is
created instantly, and the text is highlighted to enable you to rename it easily.
You should rename your folder to something appropriate. This solution folder will hold a collection of
documents for our solution, so a name such as SolutionDocuments is appropriate (Figure 2-4).
Figure 2-4. Creating a solution folder
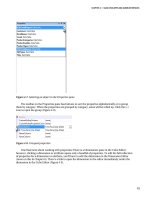
Once the folder is created and renamed, you can then add documents you have created or collected to it.
Simply click the new SolutionDocuments folder you created, which highlights the folder. Then right-click the
folder and select Add ➤ Existing Item from the context menu, as shown in Figure 2-5.
20
www.it-ebooks.info
CHAPTER 2 ■ A Big-Picture Overview
Figure 2-5. Adding existing files to a solution folder
Another method is to highlight the new Solution Documents you have created, and from Visual Studio’s
main menu, select Project ➤ Add Existing Item. Both allow you to navigate to where the files are located and add
them to your solution.
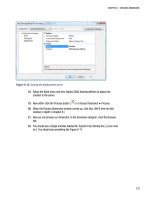
After you have selected your files and added them to your blank solution, Visual Studio will either copy the
file to your solution folder or reference the file from its existing location.
■■Important About 90% of the time Visual Studio will copy the file instead of making a reference to it. It is always
important to verify whether a reference or copy was made. Using references can cause major problems because any
changes to the files in your Visual Studio solution will change what you believed to be a copy. You can tell where a
file is located by right-clicking the file and selecting Properties from the context menu (similar to Figure 2-5), and the
file’s path will be displayed in a Property window. In cases where Visual Studio creates a reference, when what you
really wanted was a copy, you need to use Windows Explorer to copy the file to the solution folder on your hard drive
yourself and then make a reference to the newly copied file.
One of the primary goals of this book is to give you a chance to practice the art of creating BI solutions. To
keep things simple, we have created all the WeatherTracker BI solution documents and BI projects for you in
this example. This provides you with a quick introduction to the anatomy of a BI solution and introduces you to
organizing your projects using Visual Studio, without having to explain how to create these projects and files.
Don’t worry! We explain how those items are created in the other chapters of this book.
21
www.it-ebooks.info