Design revetments Thiết kế đê kè
Bạn đang xem bản rút gọn của tài liệu. Xem và tải ngay bản đầy đủ của tài liệu tại đây (826.33 KB, 35 trang )
DESIGN OF REVETMENTS
K. W. Pilarczyk
Dutch Public Works Department (RWS), Hydraulic Engineering Division,
P.O. Box 5044, 2600 GA Delft, The Netherlands;
1 INTRODUCTION
The use of revetments, such as riprap, blocks and block mats, various mattresses, and asphalt in civil
engineering practice is very common. The granular filters, and more recently the geotextiles, are more or
less standard components of the revetment structure (PIANC, 1987,1992).
Within the scope of the research on the stability of open slope revetments, much knowledge has been
developed about the stability of placed (pitched) stone revetments under wave load (CUR/TAW, 1995) and
stability of rock under wave and current load (CUR/CIRIA, 1991, CUR/RWS, 1995).
Until recently, no or unsatisfactory design tools were available for a number of other (open) types of
revetment and for other stability aspects. This is why the design methodology for placed block revetments has
recently been extended in applicability by means of a number of desk-studies for other (open) revetments:
• interlock systems and block mats;
• gabions;
• concrete mattresses;
• geosystems, such as sandbags and sand sausages;
and other stability aspects, such as: flow-load stability, soil-mechanical stability and residual strength.
This chapter, based partly on the paper by Klein Breteler et al., 1998, aims at giving a summary of the
increased knowledge, especially that concerning the design tools that have been made available. The details
behind it can be found in (Pilarczyk et al., 1998).
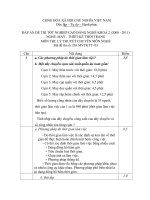
Figure 1 Pressure development in a revetment structure
2 THEORETICAL BACKGROUND OF WAVE LOADING
Wave attack on revetments will lead to a complex flow over and through the revetment structure (filter and
cover layer). During wave run-up the resulting forces by the waves will be directed opposite to the gravity
forces. Therefore the run-up is less hazardous then the wave run-down. Wave run-down will lead to two
important mechanisms:
1
• The downward flowing water will exert a drag force on the cover layer and the decreasing freatic level
will coincide with a downward flow gradient in the filter (or in a gabion). The first mechanism can be
schematised by a free flow in the filter or gabion with a typical gradient equalling the slope angle. It may
result in sliding.
• During maximum wave run-down there will be an incoming wave that a moment later will cause a wave
impact. Just before impact there is a 'wall’ of water giving a high pressure under the point of maximum
run-down. Above the run-down point the surface of the revetment is almost dry and therefore there is a
low pressure on the structure. The high pressure front will lead to an upward flow in the filter or a gabion.
This flow will meet the downward flow in the run-down region. The result is an outward flow and uplift
pressure near the point of maximum wave run-down (Figure 1).
The schematised situation can be quantified on the basis of the Laplace equation for linear flow:
2
2
∂ φ ∂ φ
+
=0
∂ y2 ∂ z2
with:
(1)
φ = φb = potential head induced in the filter or a gabion (m)
y = coordinate along the slope (m)
z = coordinate perpendicular to the slope (m)
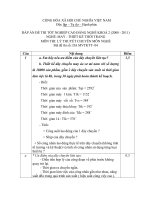
Figure 2 Schematization of pressure head on a slope
After complicated calculations the uplift pressure in the filter or a gabions can be derived. The uplift pressure
is dependent on the steepness and height of the pressure front on the cover layer (which is dependent on the
wave height, period and slope angle, see Figure 2), the thickness of the cover layer and the level of the
phreatic line in the filter or a gabion. In case of riprap or gabions, it is not dependent on the permeability of
the cover layer, if the permeability is much larger then the subsoil. For semi-permeable cover layers the
equilibrium of uplift forces and gravity forces (defined by components of a revetment) leads to the following
(approximate) design formula (Pilarczyk et al 1998):
0.67
H scr =
∆D
D
f
Λξ
op
or
H scr = f D k ′
∆D
b k
or
H scr = F ξ -0.67
op
∆D
with
Λ=
bDk
k'
(2a)
0.33
-0.67
ξ op
(2b)
(2c)
where Hscr = significant wave height at which blocks will be lifted out [m]; ξop = tanα/√(Hs/(1.56Tp2)) =
breaker parameter; Tp = wave period at the peak of the spectrum [s]; Λ = leakage length [m], ∆ = (ρs - ρ)/ρ =
2
relative volumetric mass of cover layer; b = thickness of a sublayer [m], D = thickness of a top (cover) layer
[m], k = permeability of a sublayer [m/s], k' = permeability of a top layer [m/s], f = stability coefficient,
mainly dependent on structure type, tanα and friction; F = total (black-box) stability factor.
The leakage length (Λ) and stability coefficient (F) are explained more in detail in the next sections.
3 STRUCTURAL RESPONSE
3.1 Wave-load approach
There are two practical design methods available: the black-box model and the analytical model. In both
cases, the final form of the design method can be presented as a critical relation of the load compared to
strength, depending on the type of wave attack:
Hs
= function of ξ op
∆ D cr
(3a)
For semi-permeable cover layers, the basic form of this relation is:
F
Hs
Hs
= 2 / 3 with maximum
= 8.0 and ctgα ≥ 2
∆ D cr
∆ D cr ξ op
(3b)
or, in more general form (also applicable for riprap and ctgα ≥ 1.5), as defined by Pilarczyk (1990, 1998):
F cos α
Hs
=
ξ bop
∆ D cr
(3c)
In which: F = revetment (stability) factor, Hs = (local) significant wave height (m), ∆ = relative density, D =
thickness of the top layer (m), ξop = breaker parameter (-), and b = exponent; 0.5 ≤ b ≤ 1.0.
The approximate values of stability factor F are: F = 2.25 for riprap, F = 2.5 for pitched stone of irregular
shape, F = 3.0 to 3.5 for pitched basalt, F = 4.0 for geomattresses, 3.5 ≤ F ≤ 5.5 for block revetments (4.5 as
an average/usual value), 4.0 ≤ F ≤ 6.0 for block mats (higher value for cabled systems), 6.0 ≤ F ≤ 8.0 for
gabions, and 6.0 ≤ F ≤ 10 for (asphalt or concrete) slabs.
Exponent b refers to the type of wave-slope interaction and its value is influenced by the roughness and the
porosity of a revetment. The following values of exponent b are recommended: b = 0.5 for permeable cover
layers (i.e., riprap, gabions, pattern grouted riprap, very open block mats), b = 2/3 for semi-permeable cover
layers (i.e., pitched stone and placed blocks, block mats, concrete- or sand-filled geomattresses, and b = 1.0
for slabs.
The relative density is defined as follows:
∆=
ρs - ρ w
ρw
(4a)
with: ρs = density of the protection material and
ρ w = density of water (kg/m3). For porous top layers, such
as sand mattresses and gabions, the relative density of the top layer must be determined, including the waterfilled pores:
∆ t = (1 - n) ⋅ ∆
(4b)
In which: ∆ t = relative density including pores and n = porosity of the top layer material.
3
D and Δ are defined for specific systems such as:
- for rock: D = Dn = (M50/ρs)1/3 (= nominal diameter) and Δt = Δ = (ρs-ρw)/ρw
- for blocks: D = thickness of block and Δt = Δ
- for mattresses: D = d = average thickness of mattress and Δt = (1-n)Δ, where n = bulk porosity of fill
material and Δ = relative density of fill material. For common quarry stone (1-n) Δ ~1.
The breaker parameter is defined as follows:
tan α
Hs / Lop
ξ op =
(5)
The wave steepness Sop is defined as:
Hs = 2π Hs
g T2
Lo
g
2
Lop =
Tp
2π
S op =
In which:
(6a)
(6b)
with: α = slope angle (°), Lop = deep-water wavelength at the peak period (m), and Tp = wave period at the
peak of the spectrum (s).
The advantage of this black-box design formula is its simplicity. The disadvantage, however, is that the
value of F is known only very roughly for many types of structures.
The analytical model is based on the theory for placed stone revetments on a granular filter (pitched blocks).
In this calculation model, a large number of physical aspects are taken into account. In short, in the analytical
model nearly all physical parameters that are relevant to the stability have been incorporated in the "leakage
length": Λ = √(bDk/k′) . The final result of the analytical model may, for that matter, again be presented as a
relation such as Eqs. 2c or 3c where F = f( Λ ).
With a system without a filter layer (directly on sand or clay and geotextile) not the permeability of the
filter layer, but the permeability of the subsoil (eventually with gullies/surface channels) is filled in. For the
thickness of the filter layer it is examined to which depth changes at the surface affect the subsoil. One
can fill in 0.5 m for sand and 0.05 m for clay. The values for D and ∆ depend on the type of revetment.
In the case of a geotextile situated directly under the cover layer, the permeability of the cover layer
decreases drastically. Since the geotextile is pressed against the cover layer by the outflowing water, it
should be treated as a part of the cover layer. The water flow trough the cover layer is concentrated at the
joints between the blocks, reaching very high flow velocities and resulting in a large pressure head over
the geotextile. The presence of a geotextile may reduce k' by a factor 10 or more
To be able to apply the design method for placed stone revetments under wave load to other systems, the
following items may be adapted:
• the revetment parameter F;
• the (representative) strength parameters ∆ and D;
• the design wave height Hs;
• the (representative) leakage length Λ;
• the increase factor Γ (friction/interlocking between blocks) on the strength .
Only suchlike adaptations are presented in this summarising review. The basic formulas of the analytical
model are not repeated here. For these, reader is referred to (CUR/TAW 1995).
The wave attack on a slope can be roughly transformed into the maximum velocity component on a slope
during run-up and run-down, Umax, by using the following formula:
U max = p gH sξ op
(7)
(for irregular waves and smooth slopes: 1 < p < 1.5)
4
3.2 Flow-load stability
There are two possible approaches for determining the stability of revetment material under flow attack. The
most suitable approach depends on the type of load:
• flow velocity: 'horizontal' flow, flow parallel to dike;
• discharge: downward flow at slopes steeper than 1:10, overflow without waves; stable inner slope.
When the flow velocity is known, or can be calculated reasonably accurately, Pilarczyk's relation (Pilarczyk,
1990, 1999, Pilarczyk et al. 1998) is applicable:
∆ D = 0.035
Φ K T K h u cr2
Ψ Ks 2 g
(8)
in which: ∆ = relative density, D = characteristic thickness (m): for riprap D = Dn= nominal diameter as
defined previously, g = acceleration of gravity (g=9.81 m/s2), ucr = critical vertically-averaged flow velocity
(m/s), Φ = stability parameter, Ψ = critical Shields parameter, KT = turbulence factor, Kh = depth
parameter, and Ks = slope parameter.
These parameters are explained below.
Stability parameter Φ :
The stability parameter Φ depends on the application. Some guide values are:
Revetment type
Riprap and placed blocks
Block mats, gabions, washed-in blocks,
geobags, and geomattresses
Shields parameter Ψ :
With the critical Shields parameter
•
•
•
•
•
riprap, small bags
placed blocks, geobags
blockmats
gabions
geomattresses
Continuous
toplayer
Edges and
transitions
1.0
0.5 to 0.75
1.5
0.75 to 1.0
Ψ the type of material can be taken into account:
Ψ≈
Ψ≈
Ψ≈
Ψ≈
Ψ≈
0.035
0.05
0.07
0.07
0.07
Turbulence factor KT:
The degree of turbulence can be taken into account with the turbulence factor KT. Some guide values for KT
are:
• Normal turbulence:
abutment walls of rivers:
• Increased turbulence:
river bends:
downstream of stilling basins:
• Heavy turbulence
hydraulic jumps:
strong local disturbances:
sharp bends:
• Load due to water (screw) jet:
KT ≈ 1.0
KT ≈ 1.5
KT ≈ 1.5
KT ≈ 2.0
KT ≈ 2.0
KT ≈ 2.0 (to 2.5)
KT ≈ 3.0 (to 4.0)
Depth parameter Kh:
With the depth parameter Kh, the water depth is taken into account, which is necessary to translate the depth-
5
averaged flow velocity into the flow velocity just above the revetment. The depth parameter also depends on
the development of the flow profile and the roughness of the revetment.
The following formulas are recommended:
fully developed velocity profile:
Kh =
2
12 h
log
ks
h
K h =
ks
K h = 1.0
non-developed profile:
very rough flow (h/ks < 5):
2
(9a)
-0.2
(9b)
(9c)
In which: h = water depth (m) and ks = equivalent roughness according to Nikuradse (m).
In the case of dimensioning the revetment on a slope, the water level at the toe of the slope must be used for h.
The equivalent roughness according to Nikuradse depends on the type of revetment/geosystem. For riprap, ks
is equal usually to one or twice the nominal diameter of the stones, for bags it is approximately equal to the
thickness (d), for mattresses it depends of the type of mattress: ks of about 0.05 m for smooth types and about
the height of the rib for articulating mats.
Slope parameter Ks:
The stability of revetment elements also depends on the slope gradient under which the revetment is applied,
in relation to the angle of internal friction of the revetment. This effect on the stability is taken into account
with the slope parameter Ks, which is defined as follows:
2
tan α
sin α
= cos α 1 -
Ks = 1 -
sin θ
tan θ
2
(10a)
or
K s = cos α b
(10b)
with: θ = angle of internal friction of the revetment material, α = transversal slope of the bank (°), and αb =
slope angle of river bottom (parallel along flow direction) (°).
The following values of θ can be assumed as a first approximation: 40° for riprap, 30° to 40° for sand-filled
systems, and 90° for stiff and anchored mortar-filled mattresses and (cabled) blockmats (Ks = cosα).
However, for flexible non-anchored mattresses and block mats (units without contact with the neighbouring
units) this value is much lower, usually about 3/4 of the friction angle of the sublayer. In case of geotextile
mattress and block mats connected to geotextile lying on a geotextile filter, θ is about 15° to 20°.
The advantage of this general design formula of Pilarczyk is that it can be applied in numerous situations.
The disadvantage is that the scatter in results, as a result of the large margin in parameters, can be rather wide.
With a downward flow along a steep slope it is difficult to determine or predict the flow velocity,
because the flow is very irregular. In such case formulas based on the discharge are developed (Pilarczyk et al
1998).
3.3 Soil-mechanical stability
The water motion on a revetment structure can also affect the subsoil, especially when this consists of sand.
Geotechnical stability is dependent on the permeability and stiffness of the grain skeleton and the
compressibility of the pore water (the mixture of water and air in the pores of the grain skeleton). Wave
pressures on the top layer are passed on delayed and damped to the subsoil under the revetment structure and
to deeper layers (as seen perpendicular to the slope) of the subsoil. This phenomenon takes place over a larger
distance or depth as the grain skeleton and the pore water are stiffer. If the subsoil is soft or the pore water
more compressible (because of the presence of small air bubbles) the compressibility of the system increases
and large damping of the water pressures over a short distance may occur. Because of this, alternately water
under-tension and over-tension may develop in the subsoil and corresponding to this an increasing and
decreasing grain pressure. It can lead to sliding or slip circle failure, see Figure 3.
6
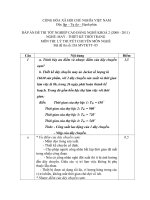
Figure 3 Schematised development of S-profile and possible local sliding in sand
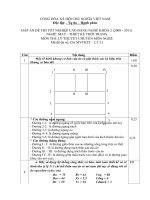
The design method with regard to geotechnical instability is presented in the form of design diagrams.
An example is given in Figure 4 (more diagrams and details: see Pilarczyk et al, 1998). The maximum wave
height is a function of the sum of the cover layer weight (∆D) and filter thickness (bf).
Figure 4 Geotechnical stability; design diagram for mattresses and Hs/Lop = 0.05
3.4 Filters
Granular and/or geotextile filters can protect structures subjected to soil erosion when used in conjunction
with revetment armour such as riprap, blocks and block mats, gabions and mattresses, asphalt or concrete
slabs, or any other conventional armour material used for erosion control (PIANC, 1987, 1992).
However, there is still a misunderstanding about the function of geotextiles in the total design of
these structures, especially in comparison with the granular filters. In this Section the general principles of
designing revetments incorporating granular or geotextiles are reviewed. Attention is paid to the
replacing of a granular filter by a geotextile, which may often lead to geotechnical instability.
Furthermore it appears that a thicker granular filter gives a larger geotechnical stability, but a lower cover
layer stability (uplift of blocks). The conclusion is therefore that the wave loads must be distributed
(balanced) adequately over the sand (shear stress) and the cover layer (uplift pressure). Too much
emphasis on one failure mechanism can lead to another mechanism.
Filters have two functions: erosion prevention and drainage. Traditional design criteria for filters are
that they should be "geometrically tight" and that the filter permeability should be larger than the base
(soil) permeability. However, it results in a large number of layers which are often unnecessary,
uneconomical and difficult to realize. In several cases a more economical filter design can be realized
7
using the concept of "geometrically open filters" (e.g. when the hydraulic loads/gradients are too small to
initiate erosion). Recently, some criteria for "geometrically open" filters including geotextiles were
developed (and are still under further development). However, the application of these criteria requires
the knowledge/prediction of the hydraulic loads.
In the cases when the erosion exceeds an acceptable level, a filter construction is a proper measure
for solving this problem. In revetment structures geotextiles are mostly used to protect the subsoil from
washing away by the hydraulic loads, such as waves and currents. Here the geotextile replaces a granular
filter. Unfortunately, the mere replacing of a granular filter by a geotextile can endanger the stability of
other components in the bank protection structure. The present section shows that designing a structure is
more than just a proper choice of geotextile.
Filter structures can be realized by using granular materials (i.e. crushed stone), bonded materials
(i.e. sand asphalt, sand cement), and geotextiles, or a combination of these materials. Typical filter
compositions are shown in Figure 5. The choice between the granular filter, a bonded filter or geotextile
depends on a number of factors. In general, a geotextile is applied because of easier placement and
relatively lower cost. For example, the placement of granular filter underwater is usually a serious
problem; the quality control is very difficult, especially when placement of thin layers is required.
When designing with geotextiles in filtration applications, the basic concepts are essentially the same
as when designing with granular filters. The geotextile must allow the free passage of water (permeability
function) whilst preventing the erosion and migration of soil particles into the armour or drainage system
(retention function).
In principle, the geotextile must always remain more permeable than the base soil and must have
pore sizes small enough to prevent the migration of the larger particles of the base soil. Moreover,
concerning the permeability, not only the opening size but also the number of openings per unit area
(Percent Open Area) is of importance (Pilarczyk, 1999).
It has to be stressed that geotextiles cannot always replace the granular filter completely. A granular
layer can often be needed to reduce (damp) the hydraulic loadings (internal gradients) to an acceptable
level at the soil interface. After that, a geotextile can be applied to fulfill the filtration function.
Figure 5 Examples of filters
In respect to the filters for erosion control (granular or geotextile) the distinction can be made
between:
* geometrically tight filters,
* geometrically open filters, and
* transport filters (when a limited settlement is allowed).
Only geometrically tight filters are discussed. For other type of filters reader is referred to (Pilarczyk,
1999)
8
3.4.1 Design criteria for geometrically tight granular filters
In this case there will be no transport of soil particles from the base, independent of the level of hydraulic
loading. That means that the openings in the granular filter or geotextile are so small that the soil particles
are physically not able to pass the opening. This principle is illustrated in Figure 6 for granular filters.
Figure 6 Principles of geometrically tight filters
The main design rules (criteria) for geometrically tight (closed) granular filters and geotextiles are
summarized below. The more detailed information on design of geotextile filters is given in Pilarczyk
(1999).
The soil tightness of the initial situation can be checked by means of the well-known criteria for
granular filters:
-
Interface stability (also called 'piping' criterion):
Df 15 ≤ 4 to 5
Db 85
(11)
where:
Df15
Db85
is the grain size of the filter layer (or cover layer) which is exceeded by 15 % of the
material by weight in m;
is the grain size of the base material (soil) which is exceeded by 85 % of the material by
weight in m.
The factor 4 in Eq. (11) was given by TERZAGHI. The factor 5 is determined for normal wide-graded
materials. Sometimes a similar equation is defined as:
Df 50 < 6 to 10
Db 50
(12)
However, Equation (12) is less general than Eq. (11) and can be used for 'small' gradation only.
Therefore, Eq. (11) is recommended for general use. However, in the case of very 'wide' gradation the
situation requires an additional check with respect to the internal migration. In this respect, an important
parameter is the so-called 'uniformity coefficient' Cu, defined by Equation (13) and the shape of the sieve
curve:
Cu = D b 60
D b10
(13)
where: Cu is the coefficient of uniformity.
- Internal stability can be roughly judged by the following rules (Eq. 14):
D10 < 4 D5
D20 < 4 D10
D30 < 4 D15
D40 < 4 D20
(14a)
(14b)
(14c)
(14d)
- permeability criterion
9
D f 15
Db15
>5
(15)
3.4.2 Summary of design rules for geotextiles
Current definitions for geotextile openings
There are a large number of definitions of the characteristic of geotextile openings. Moreover, there are
also different test (sieve) methods for the determination of these openings (dry, wet, hydrodynamic, etc.)
which depend on national standards. These all make the comparison of test results very difficult or even
impossible. That also explains the necessity of international standarization in this field.
Some of the current definitions are listed below:
O90 corresponds with the average sand diameter of the fraction of which 90% of the weight remains on or
in the geotextile (or 10 % passes the geotextile) after 5 minutes of sieving (method: dry sieving
with sand);
O98 corresponds with the average sand diameter of the fraction of which 98% of the weight remains on or
in the geotextile after 5 minutes of sieving. O98 gives a practical approximation of the maximum
filter opening and therefore plays an important role in the sand tightness criterion for a geotextile
in strong cyclic loading situations. O98 is also referred to as Omax.
filtration opening size (FOS). Of is comparable with O95 (hydrodynamic sieve method);
Of
AOS
apparent opening size (acc. to ASTM method), also called EOS (effective opening size). The
AOS is determined by sieving spherical glass particles of known size through a geotextile. The
AOS, also frequently referred to as O95 (dry sieve method), is defined as a standard sieve size, x,
mm, for which 5% or less of the glass particles pass through the geotextile after a specified
period of sieving;
effective opening size which corresponds with the sand diameter of the fraction of which 10 %,
Dw
determined by the wet sieve method, passes through the geotextile. Dw is comparable with O95.
The transport of soil particles within a grain structure is possible when there is enough space and a
driving force (groundwater pressure, hydraulic gradients within the soil). In most cases it is the intention
to prevent the transport of small-sized soil particles in the subsoil and therefore the term soil tightness is
used and not the term space for transport or pore volume (in the case of the transport of water the terms
pore volume and water permeability are used). The relation between pore magnitude and grain diameter
can be characterized by: pore diameter ≈ 20% of the grain diameter. Just as for the characterization of the
performance of a grain structure with regard to the transport of soil particles, for geosynthetics, too, the
term soil tightness is used.
As was mentiond before (Figure 6), in a theoretical case when the soil is composed of spheres of onesize diameter, all spheres can be retained if all apertures in the geosynthetic are smaller than the diameter
of the spheres. Usually the soil consists of particles with different diameters and shapes, which is
reflected in the particle-size distribution curves. Smaller particles can disappear straight across the
geosynthetic by groundwater current. In this case the retained soil structure can function as a natural
filter; see Figure 7. The better the soil particles are distributed, the better the soil tightness of the soil
structure is effected. Smaller soil particles get stuck into the spaces between larger ones and the soil
structure prevents the flow of fine particles. When certain particle-size fractions are lacking, the soil
structure is not stacked very well and cavities develop through which erosion can occur. The
displacement of soil particles not only depends on the soil tightness but also on the hydraulic gradient in
the soil structure. Morever, the dynamic effects due to heavy wave loading may not allow the forming of
a natural filter, and the process of washing-out may continue.
According to some researchers the forming of a natural filter is only possible for stationary flow
(CUR, 1993). However, this is also possible for non-stationary flow, for small values of the hydraulic
gradients. For heavy wave attack (i.e. exposed breakwaters) this is usually not the case. In extreme
situations, soil liquefaction is even possible. In such situations the soil particles can still reach the surface
of a geotextile and be washed out.
10
Figure 7 Schematic representation of a natural filter with a soil-retaining layer
In order to judge the risk of wash-out of soil particles through the geosynthetics, some aspects have
to be considered. An important factor is the internal stability of the soil structure.
In the case of a loose particle stacking of the soil many small soil particles may pass through the
geosynthetic before a stable soil structure is developed near the geosynthetic. Also, a proper compaction
of soil is very important for the internal stability of soil. The internal stability is defined by the uniformity
coefficient Cu (see Eq. 13). It is defined as Db60/Db10. If this ratio is smaller than 6 (to 10), the soil
structure is considered internally stable.
In case of vibration, for instance caused by waves or by traffic, the stable soil structures can be
disturbed. To avoid such situations, the subsoil has to be compacted in advance and a good junction
between geosynthetic and subsoil has to be guaranteed and possibly, a smaller opening of geotextile must
be chosen.
The shape of the sieve curve also influences the forming of a natural filter. Especially, when Cu > 6,
the shape of the base gradation curve and its internal stability must be taken into account (Pilarczyk,
1999). For a self-filtering linearly graded soil, the representative size corresponds to the average grain
size, Db50. For a self-filtering gap graded soil, this size is equal to the lower size of the gap. For internally
unstable soils, this size would be equivalent to Db30 in order to optimize the functioning of the filter
system. It is assumed that the involved bridging process would not retrogress beyond some limited
distance from the interface.
· Soil tightness
With respect to the soil tightness of geotextiles many criteria for geometric soil tightness have been
developed and published in the past (Pilarczyk, 1999). An example of such design criteria, based on
Dutch experience, is presented in Table 1. An additional requirement is that the soil should be internally
stable. The internal stability of a grain structure is expressed in the ratio between Db60 and Db10. As a rule
this value has to be smaller than 10 to guarantee sufficient stability.
Table 1 Design requirements for geosynthetics with a filter and separation function
description filter
- stationary loading
- cyclic loading with natural filter
(stable soil structure)
- cyclic loading without a natural filter
function/soil tightness
O90 ≤ 1 (to 2) Db90
O98 ≤ 1 (to 2) Db85
11
(unstable soil structure)
. when wash-out effects acceptable
. when wash-out effects not acceptable
O98 ≤ 1.5 Db15
O98 ≤ Db15
However, in many situations additional requirements will be necessary, depending on the local situation. Therefore, for design of geometrically tight geotextiles the method applied in Germany can be
recommended (see HEERTEN, 1982, PIANC, 1987, BAW, 1993). In this method a distinction is made
between so-called stable and unstable soils. Soils are defined as unstable (susceptible to down-slope
migration) when the following specifications is fulfilled:
- a proportion of particles must be smaller than 0.06 mm;
- fine soil with a plasticity index (Ip) smaller than 0.15 (thus, it is not a cohesive soil);
- 50 percent (by weight) of the grains will lie in the range 0.02 < Db < 0.1 mm;
- clay or silty soil with Cu < 15.
If the Ip is unknown at the preliminary design stage then the soil may be regarded as a problem soil if the
clay size fraction is less than 50% of the silt size fraction.
The design criteria are presented in Table 2. More detailed information can be found in Pilarczyk
(1999).
Table 2 Design criteria for geometrically soil-tight geotextiles
soil type
Db40 < 60 µm
stationary
loading
dynamic
loading
Db40 > 60 µm
stable soil
Instable soil
stable soil
instable soil
O90 < 10 Db50
and
O90 < 2 Db90
O90 < 10 Db50
and
O90 < Db90
O90 < 5 Db10Cu1/2
and
O90 < 2 Db90
O90 < 5 Db10Cu1/2
and
O90 < Db90
O90 < Db90
and
O90 < 0.3 mm
(300µm)
O90 < Db90
O90 < 1.5 Db10Cu1/2
and
O90 < Db50
O90 < 0.5 mm
(O90 is determined by wet sieve method)
In the case of fine sand or silty subsoils, however, it can be very difficult to meet these requirements. A
more advanced requirement is based on hydrodynamic sand tightness, viz. that the flow is not capable of
washing out the subsoil material, because of the minor hydrodynamical forces exerted (although the
apertures of the geotextile are much larger than the subsoil grains).
Requirements concerning water permeability
To prevent the forming of water pressure (uplift) in the structure, causing loss of stability, the geotextile
has to be water permeable. One has to strive for the increase of water permeability of a construction in the
direction of the water current. In the case of a riverbank protection it means that the permeability of the
geotextile has to be larger than the permeability of the soil on which the geotextile has to be applied. In
the case of a dike slope or dike foundation the geosynthetic is often applied on an impermeable layer of
clay. Proper permeability of geotextiles is very important in respect to the stability of relatively less
permeable cover layers as, for example, block and block mats. When a geotextile lies directly under the
cover layer it considerably reduces the open area of the cover layer, and as a result the uplift forces
increase (see example in Section 4.2). The water permeability of woven fabrics and nonwovens may
decrease in the course of time owing to the fact that fine soil particles, which are transported by the
groundwater flow from the subsoil, block the openings in the geotextile, or migrate into the pores of the
geosynthetic (clogging).
To prevent mineral clogging, the pore size of the geotextiles has to be chosen as large as possible; but,
of course, this pore size has still to meet the requirements for soil tightness. The danger of clogging
increases when the soil contains more than 20% of silt or in the case of gap-grading of a soil. On the other
12
hand, there usually is no danger of clogging when the total hydraulic gradient (over the subsoil and
geotextile together) is less than 3, or when the subsoil is well graded. In all situations it holds that the soil
must be internally stable. For less critical situations no clogging can be expected if:
(16a)
Cu > 3: O95/Db15 >3;
(16b)
Cu < 3: criterion of internal stability of soil should be satisfied
and/or geotextile with maximum opening size from
soil-tightness criteria should be specified.
In respect to the water permeability of geosynthetics/geotextiles, a distinction should be made between
"normal to the interface" and "parallel to the interface". For geotextile filters the permeability parallel to
the interface is of importance, while for drainage structures the permeability normal to the interface is of
most importance. As a general design criterion for flow normal to the interface one can hold that the
water permeability of a geosynthetic/geotextile has to be greater than that of the soil at the side from
where the water flow comes. As a rule one can keep to:
kgeotextile (filter) = ksoil × factor
(17)
where ks and kg are usually (basically) defined for laminar conditions.
For normal (stationary) conditions and applications and clean sands a factor of 2 is sufficient to
compensate the effect of blocking. If a geotextile is permeable with a factor of 10 more than the (noncohesive) subsoil, overpressure will usually not occur, neither below the geosynthetic, nor in the case of
reduced permeability caused by clogging or blocking. However, for special applications (i.e., for damclay cores with danger of clogging) this factor can be 50 or more.
The detailed treatment with respect to the effect of hydraulic loading on permeability characteristics of
the geotextile and the possible interactions with the subsoil can be found in (Van Santvoort, 1994 and
Pilarczyk, 1999)). However, the basic information on this aspect as far as it is needed for total design with
geotextiles, is given hereafter.
Water permeability normal to the interface
The function of the water permeability requirement in the total approach of designing with geotextiles is
to bring the design of the filter into harmony with the subsoil. The requirement that excess pressures
should not occur means that the eventual loss of stability at the filter occurs no sooner than the similar
loss of stability does in the subsoil (i.e. migration of particles, softening of the subsoil and resulting
sliding, etc.) as a consequence of groundwater flow (critical gradients). The basic (starting) requirement is
that the gradient over the geotextile should maximally be equal to the gradient of the subsoil:
i n ≤ ib
(18)
where: ib is the gradient in sublayer (or in subsoil, is) and in is the gradient normal to the geotextile.
The permeability of a geotextile can be characterized by the permeability coefficient kg = kn (m/s) or by
the permittivity ψ (1/s), see also Figure 8. Permittivity can be directly calculated from test results and
expresses the rate of flow through the geotextile per unit area and per unit hydraulic head, and it is also
defined as permeability per unit thickness of geotextile :
ψ =
Q
vf
=
=
A ∆ hg
∆ hg
kn
Tg
(19)
where:
ψ
is the permittivity in 1/s;
is the flow rate through the geotextile in m3/s;
Q
is filtration velocity in m/s;
vf
is the surface area of geotextile in m2;
A
∆hg is the hydraulic head difference across the geotextile in m;
is the permeability coefficient of the geotextile (kg), normal to the interface, in m/s;
kn
is the thickness of the geotextile in m.
Tg
N.B. the term kn/Tg in Eq. 19 is often used for rough estimation of the permeability coefficient for other
(not tested) thicknesses for the same type of geotextile.
13
The main problem of using permittivity is the definition of the thickness of geotextile. Usually a thickness
under the normal stress of 2 kPa is applied. The definitions and an example of test results concerning the
determination of permittivity and permeability for geotextiles are presented in Figure 8.
Definitions
Figure 8 An example of the relationships between between permittivity and hydraulic conductivity
(permeability coeff.) as a function of hydraulic head
Combining formulas (17) and (18) with formula (19), and applying a continuity principle,
k n in = k b ib
(20)
where: kb is the permeability coefficient of the base material (subsoil, ks) in m/s, and ib is the gradient in
the base material;
14
it provides:
ψ = c kb
ib
≈ cψ k b
∆ hg
(21)
In general, permittivity of a certain geotextile is a function of the hydraulic head. Only in the zone of
laminar flow the permittivity is more or less constant (see Figure 8). When permittivity is defined outside
this zone, the associated hydraulic head (Dh) should be mentioned.
The total safety factor cy incorporates a number of uncertainties (i.e., permeability of soil, the loss of
permeability due to the effects of clogging and stress, etc.) and, depending on application, can be equal to
103 for clean sands and up to 105 for critical soils and severe applications in dams (see CFGG, 1986). The
last value seems to be rather conservative.
Holtz et al. (1997) propose to use, additionally to other permeability criteria, the permittivity criterion
directly related to the soil type defined by a certain percentage of passing the sieve of 0.075 mm. These
criteria have originally been established by the U.S. Federal Highway Administration (FHWA, 1995).
These permittivity requirements are:
ψ ≥ 0.5 sec-1 for soils with < 15% passing the 0.075 mm sieve;
ψ ≥ 0.2 sec-1 for soils with 15 to 50% passing the 0.075 mm sieve;
ψ ≥ 0.1 sec-1 for soils with > 50% passing the 0.075 mm sieve.
The flow rate Q through the geotextile can be defined as:
Q = v f A = ψ∆ hg A = k n A ig
(22)
Discussion
There are a large number, often very unclear and confusing definitions of permeability of geotextiles,
especially when the permeability of geotextile must match the permeability of a certain soil. The basic
equation, both for soil and geotextile, is the Darcy's equation; vf = k × i, which is valid for laminar flow
conditions.
The hydraulic gradient i is the average hydraulic gradient in the soil. For example, the gradient along
(parallel to) geotextile in revetments with a thick granular layer above, loaded by run-up and run-down,
often a tangent of slope angle can be applied (tana). However, for thin granular filters (layers) this
gradient can be much larger than tanα. For other applications i can be estimated by using a conventional
flow net analysis for seepage through dikes and dams or from a rapid drawdown analysis. The
permeability of geotextiles is characterized by a number of different (national) index tests. Therefore, at
this moment, the standard specification sheets provided by manufacturers include such definitions as: the
permeability (filtration velocity, vf) at the hydraulic head equal to 50, 100 or even 250 mm, permittivity
defined at the standard filtration velocity (vf) equal to 10 mm/s (at a certain hydraulic head), the head loss
index corresponding to a filtration velocity of 20 mm/s, etc.
Actually, CEN (1998) prepared a European standard introducing only one index test, so-called
'Velocity Index', which defines the filtration velocity corresponding to a head loss of 50 mm across a
specimen. The flow velocity vf expressed in mm/s equals the unit discharge q expressed in l/m2 s.
However, to be able to draw conclusion about the proper choice of permeability for various conditions
and applications, it is necessary to perform (to measure) the full permeability characteristics and prepare a
collective plot of the velocity vf and head loss Dh for each specimen. The test range must be sufficiently
wide to allow also the determination of permeability parameters for laminar flow. If the full permeability
characteristics of the geotextile product have previously been established, then for checking purposes it
can be sufficient to determine the velocity index at a head loss of 50 mm only.
In case that only one or two test data with standard index specifications (vf, ∆h, and Tg) are known, the
approximate estimation of permeability can be done by using the following equation:
vf = k im,
where i = ∆h/Tg and 0.5 ≤ m ≤ 1.0 (m = 1 for laminar flow and m = 0.5 for turbulent flow). When only
one point is available the rough approximation can be obtained by applying m = 0.7.
By plotting a line on a log-log paper through two points the exponent m can be determined, and for i =
1, k can be approximated. By using this equation the permeability can be roughly extrapolated to the
required conditions/definitions, for example, kg = vfTg/∆h or kg = ψ Tg at ∆h = 50 mm, or kg at vf = 10
mm/s, or kg or ψ for laminar conditions, and can be used as a first approximation. In case of doubt, more
data or additional tests can be requested.
The permeabilities defined outside the laminar zone can also be interpreted in the following way, for
15
example, if kg established at vf = 10 mm/s is equal or larger than ks(soil), the geotextile fulfills the
requirement of permeability for filtration velocities (in the soil) lower than 10 mm/s. For larger filtration
velocities the new estimation of kg is needed, related to the higher vf, to check the requirement kg > ks,
because kg will decrease for higher vf in transition or turbulent flow zone.
With regard to the hydraulic efficiency of the geotextile filter, full advantage should be taken on the
permissible upper limits of the opening size, provided the required mechanical filter effectiveness (soiltightness) is ensured (DVWK, 1993). The reason for this is that an open (and possibly, thicker) structure
is generally superior to a dense structure with regard to the filter stability. Thus, when the permeability is
decesive for the design, the largest admissible opening size resulting from the soil-tightness criteria
should be used to ensure the permeability as high as possible. There are usually no problems with
obtaining a sufficient permeability when 1≤O90/D90<2 is applied as a soil-tightness criterion. Research
results (MLYNAREK, 1994) indicate that the permeability of a soil-geotextile system is mainly defined by
the permeability of a soil. However, the geotextile permeability will decrease in soil due to compression.
It is of special importance for thick non-wovens. Therefore, the factor of safety should be increased
accordingly to account for the critical nature of the application, type of geotextile, and the severity of the
soil and hydraulic conditions.
This discussion indicates that there are still much uncertainties in the proper application of the
permeability criteria. However, for normal (stationary) conditions and stable soils it is usually not a real
problem. For critical projects, performance tests simulating soil-geotextile interaction can be
recommended.
16
4 STABILITY CRITERIA FOR PLACED BLOCKS AND BLOCK MATS
4.1 System description
Placed block revetments (or stone/block pitching) are a form of protection lying between revetments
comprised of elements which are disconnected, such as rubble, and monolithic revetments, such as
asphalt/concrete slabs. Individual elements of a pitched block revetment are placed tightly together in a
smooth pattern. This ensures that external forces such as waves and currents can exert little drag on the blocks
and also that blocks support each other without any loss of flexibility when there are local subsoil
irregularities or settlement.
A (concrete) block mat is a slope revetment made of (concrete) blocks that are joined together to form a
"mat", see Figure 9. The interconnection may consist of cables from block to block, of hooks connecting the
blocks, or of a geotextile on which the blocks are attached with pins, glue or other means. The spaces between
the blocks are usually filled with rubble, gravel or slag.
.
.
Figure 9 Examples of block mats
The major advantage of block mats is that they can to be laid quickly and efficiently and partly under water.
Block mats are more stable than a setting of loose blocks, because a single stone cannot be moved in the
direction perpendicular to the slope without moving other nearby stones. It is essential to demand that already
with a small movement of an individual stone a significant interactive force with the surrounding stones is
mobilised. Large movements of individual blocks are not acceptable, because transport of filter material may
occur. After some time, this leads to a serious deformation of the surface of the slope.
The block mats are vulnerable at edges and corners. If two adjacent mats are not joined together, then the
stability is hardly larger than that of pitched loose stones.
4.2 Design rules with regard to wave load
The usual requirement that the permeability of the cover layer should be larger than that of the underlayers
cannot be met in the case of a closed block revetment and other systems with low permeable cover layer. The
low permeable cover layer introduces uplift pressures during wave attack. In this case the permeability ratio
of the cover layer and the filter, represented in the leakage length, is found to be the most important structural
parameter, determining the uplift pressure. This is also the base of analytical model.
The analytical model is based on the theory for placed stone revetments on a granular filter (CUR/TAW,
1995). In this calculation model, a large number of physical aspects are taken into account (see Figures 1, 2
and 6). In short, in the analytical model nearly all physical parameters that are relevant to the stability have
been incorporated in the "leakage length" factor. The final result of the analytical model may, for that matter,
again be presented as a relation such as Eqs. 2 or 3 where F = f( Λ ).For systems on a filter layer, the leakage
length Λ is given as:
17
Λ=
bk
bDk
or Λ / D=
k'
Dk '
(23a)
where: Λ=leakage length [m] bf = thickness of the filter layer (m), kf = permeability of the filter layer or
subsoil (m/s), and k ′ = permeability of the top (cover)layer (m/s).
With a system without a filter layer (directly on sand or clay, without gullies being formed under the top
layer) not the permeability of the filter layer, but the permeability of the subsoil (eventually with
gullies/surface channels) is filled in. For the thickness of the filter layer it is examined to which depth changes
at the surface affect the subsoil. One can fill in 0.5 m for sand and 0.05 m for clay. The values for D and ∆
depend on the type of revetment. When schematically representing a block on a geotextile on a gully in sand,
the block should be regarded as the top layer and the combination of the geotextile and the small gully as the
filter layer (Figure 10).
Figure 10 Schematization of a revetment with gully
(cavity)
The leakage length can be calculated using:
Λ=
( k f dg + k g Tg ) D
k′
(7b)
(23b)
(23b)
with:
kf = permeability of the filter layer (gully) (m/s), dg =
gully depth (m), kg = permeability of the geotextile
(m/s), Tg = thickness of the geotextile (m), D = thickness of the top layer (m), and k ′ = permeability of the
top layer (m/s).
In the case of a geotextile situated directly under the cover layer, the permeability of the cover layer
decreases drastically. Since the geotextile is pressed against the cover layer by the outflowing water, it should
be treated as a part of the cover layer.
The water flow trough the cover layer is concentrated at the joints between the blocks, reaching very high
flow velocities and resulting in a large pressure head over the geotextile. The presence of a geotextile may
reduce k' by a factor 10 or more (see Figure 11).
Figure 11 Combined flow resistance determining the permeability of a system
18
The leakage length clearly takes into account the relationship between kf and k' and also the thickness of
the cover layer and the filter layer. For the theory behind this relationship, reference should be made to
literature (see Klein Breteler et al, 1998 and CUR/TAW, 1995). The pressure head difference which develops
on the cover layer is larger with a large leakage length than with a small leakage length. This is mainly due to
the relationship kf/k' in the leakage length formula. The effect of the leakage length on the dimensions of the
critical wave for semi-permeable revetments is apparent from the following equations:
0.67
H scr =
∆D
D
f
Λξ
op
D k′
= H scr = f
∆D
b k
0.33
-0.67
=
ξ op
H scr
= F ξ op-0.67
∆D
(24)
where: Hscr = significant wave height at which blocks will be lifted out [m]; ξop = tanα/√(Hs/(1.56Tp2)) =
breaker parameter; Tp = wave period [s]; Δ = relative volumetric mass of cover layer = (ρs - ρ)/ρ; f = stability
coefficient mainly dependent on structure type and with minor influence of Δ, tanα and friction, and F = total
(black-box) stability factor.
These equations indicate the general trends and have been used together with measured data to set up the
general calculation model (CUR/TAW, 1995, Pilarczyk, 1998). This method works properly for
placed/pitched block revetments and block mats within the following range: 0.01 < k'/ kf < 1 and 0.1 < D/bf <
10. Moreover, when D/Λ > 1 use D/Λ = 1, and when D/Λ < 0.01 use D/Λ = 0.01. The range of the stability
coefficient is: 5 < f < 15; the higher values refer to the presence of high friction among blocks or interlocking
systems. The following values are recommended for block revetments:
f = 5 for static stability of loose blocks (no friction between the blocks),
f = 7.5 for static stability of a system (with friction between the units),
f = 10 for tolerable/acceptable movement of a system at design conditions.
From these equations, neglecting the usually minor variations of 'f', it appears that:
- An increase in the volumetric mass, ∆, produces a proportional increase in the critical wave height. If ρb is
increased from 2300 to 2600kg/m3, Hscr is increased by about 23%,
- If the slope angle is reduced from 1:3 to 1:4 (tanα from 0.33 to 0.25) Hscr is increased by about 20% (due to
the breaker parameter, ξop),
- An increase of 20% in the thickness of the cover layer, D, increases Hscr by about 27%,
- A 30% reduction in the leakage length , Λ, increases Hscr by about 20%. This can generally be achieved by
halving the thickness of the filter layer or by doubling the k'/kf value. The latter can be achieved by
approximation, by:
- reducing the grain size of the filter by about 50%, or
- by doubling the number of holes in (between) the blocks, or
- by making hole sizes 1.5 times larger, or
- by doubling joint width between blocks.
EXAMPLE: In 1983 the Armorflex mat on a slope 1:3 was tested on prototype scale at the Oregon State
University: closed blocks with thickness D = 0.12 m and open area 10% on two types of geotextiles and very
wide-graded subsoil (d15 = 0.27 mm, d85 = 7 mm).
In the case of a sand-tight geotextile the critical wave height (instability of mat) was only Hscr = 0.30 m. In the
case of an open net geotextile (opening size about 1mm) the critical wave height was more than 0.75 m
(maximum capacity of the wave flume).
The second geotextile was 20 times more permeable than the first one. This means that the stability increased
by factor 200.33 = 2.7.
19
In most cases the permeabilities of the cover layer and sublayer(s) are not exactly known. However, based
on the physical principles as described above, the practical 'black-box' method has been established where
parameter Λ and coefficient 'f' are combined to one stability factor 'F'. F depends on the type of structure,
characterised by the ratios of k'/kf and D/bf. With the permeability formulas from(CUR/TAW, 1995) it is
concluded that the parameter (k'/kf)•(D/bf) ranges between 0.01 and 10, leading to a subdivision into 3 ranges
of one decade each. Therefore the following types are defined:
a) Low stability: (k'/kf)(D/bf) < 0.05 .. 0.1
b) Normal stability: 0.05 .. 0.1 < (k'/kf)(D/bf) < 0.5 .. 1
c) High stability: (k'/kf)(D/bf) > 0.5 .. 1
For a cover layer lying on a geotextile on sand or clay, without a granular filter, the leakage length cannot
be determined because the size of bf and k cannot be calculated. The physical description of the flow is
different for this type of structure. For these structures there is no such a theory as for the blocks on a granular
filter. However, it has been experimentally proved that Eqs. 3b or 24 are also valid for these structures.
It can be concluded that the theory has led to a simple stability formula (Eq. 24) and a subdivision into 4
types of (block) revetment structures:
a1) cover layer on granular filter possibly including geotextile, low stability;
a2) cover layer on granular filter possibly including geotextile, normal stability;
a3) cover layer on geotextile on sand;
a4) cover layer on clay or on geotextile on clay.
The coefficient, F, is quantified for each structure type by way of fitting Eq. 3b to the results of a large
collection of results of model studies from all over the world. Only large-scale studies are used because both
the waves and the wave induced flow in the filter should be well represented in the model. In the
classification of structures according to the value of (k'D/kfbf), the upper limit of (k'D/kfbf) is 10 times the
lower limit. Therefore the upper limit of F of each structure type (besides a1.1) is assumed 100.33= 2.14 times
the lower limit, since F = f(k'D/kfbf)0.33. A second curve is drawn with this value of F. In Table 3 all available
tests are summarised and for each type of structure a lower and upper boundary for the value of F is given
(see also an example in Figure 12). The lower boundary gives with Eq. 3b a stability curve below which
stability is guaranteed. Between the upper and lower boundary the stability is uncertain. It depends on various
unpredictable influences whether the structure will be stable or not. The upper boundary gives a curve above
which instability is (almost) certain.
Table 3 Lower and upper value for F
type description
low F
high F
usual F
(average value)
a1.1 pitched irregular natural stones on granular filter
a1.2 loose blocks/basalt on granular filter,
low stability
a2 loose blocks on granular filter,
normal stability
a3 loose blocks on geotextile on compacted sand/clay
a4 linked/interlocked blocks on geotextile on good clay
or on fine granular filter
2.0
3.0
2.5
3.0
5.0
3.5
3.5
4.0
5.0
6.0
7.0
8.0
4.5
5.0
6.0
The results for structure type a3 (blocks on geotextile on sand) may only be applied if the wave load is
small (Hs < 1 or 1.5m (max.)) or to structures with a subsoil of coarse sand (D50> 0.3 mm) and a gentle slope
20
(tanα < 0.25), because geotechnical failure is assumed to be the dominant failure mechanism (instead of uplift
of blocks). The good compaction of sand is essential to avoid sliding or even liquefaction. For loads higher
than H = 1.2 m, a well-graded layer of stone on a geotextile is recommended (e.g. layer 0.3-0.5 m for 1.2 m <
H < 2.5 m).
Figure 12 Example of a stability function for type a3 (loose blocks on geotextile on sand)
The results for structure type a4 can be applied on the condition that clay of high quality and with a
smooth surface is used. A geotextile is recommended to prevent erosion during (long duration) wave loading.
The general design criteria for geotextiles on cohesive soils are given by Pilarczyk (1999).
In the case of loose blocks an individual block can be lifted out of the revetment with a force exceeding its
own weight and friction. It is not possible with the cover layers with linked or interlocking blocks. Examples
of the second type are: block mattresses, ship-lap blocks and cable mats. However, in this case high forces
will be exerted on the connections between the blocks and/or geotextile. In the case of blocks connected to
geotextiles (i.e. by pins), the stability should be treated as for loose blocks in order to avoid the mechanical
abrasion of geotextiles by moving blocks. The lower boundary of stability of cabled mats can be increased by
a factor of 1.25 (or 1.5, if additionally grouted) in comparison with loose blocks. Such an increase of stability
is only allowable when special measures are taken with respect to the proper connection between the mats.
The upper boundary of stability (F = 8) remains the same for all systems. Application of this higher stability
requires optimization of design. This optimization technique (incl. application of geometrically open but
stable filters and geotextiles) can be found in (CUR, 1993 and CUR/TAW, 1995).
To be able to apply the design method for placed stone revetments under wave load to other semipermeable systems, the following items may be adapted: the revetment parameter F, the (representative)
strength parameters Δ and D, the design wave height Hs and the (representative) leakage length Λ. The basic
formulas of the analytical model are presented in CUR/TAW, 1995 and Pilarczyk, 1998. Table 4 gives an
overview of useable values for the revetment constant F in the black-box model for linked blocks (block
mats).
21
Table 4 Recommended values for the revetment parameter F for blockmats (the lower values refer to blocks
connected to geotextile while the higher ones refer to cabled blocks).
Type of revetment
F (-)
Linked blocks on geotextile on sand
5 to 6
good clay
5 to 6
Linked blocks on geotextile on clay
Mediocre (sandy) clay
4.5 to 5
favourable construction
5 to 6
normal construction
4 to 5
unfavourable construction
3 to 4
Linked blocks on a granular filter
The terms "favourable", "normal" and "unfavourable" refer to the composition of the granular filter and the
permeability-ratio of the top layer and the filter layer (see CUR/TAW, 1995). In a case of fine granular filter
and relatively permeable top layer the total composition can be defined as "favourable'. In a case of very
coarse granular layer and less permeable top layer the composition can be defined as "unfavourable". In a
case of blocks connected to a geotextile and concrete-filled mattresses on a filter layer the construction can be
usually defined as between "unfavourable" and "normal", and the stability factor F = 3.0 to 3.5 (max. 4.0) can
be applied. For blockmats and permeable mattresses on sand F = 5 (max. 6.0) can be applied. The higher
values can also be used in cases that the extreme design loading is not very frequent or when the system is
(repeatedly) washed in by coarse material providing additional interlocking.
This wide range of recommended values for F only gives a first indication of a suitable choice.
Furthermore it is essential to check the geotechnical stability with the design diagrams (see for example
Figure 4 and for a full set of diagrams see Pilarczyk (1998, 1999).
5 STABILITY CRITERIA FOR CONCRETE-FILLED MATTRESSES
5.1 Concrete Mattresses
Characteristic of concrete mattresses are the two geotextiles with concrete or cement between them. The
geotextiles can be connected to each other in many patterns, which results in a variety of mattress systems,
each having its own appearance and properties. Some examples are given in Figure 13.
Figure 13 Examples of concrete-filled mattresses
22
The permeability of the mattress is one of the factors that determine the stability. It is found that the
permeability given by the suppliers is often the permeability of the geotextile, or of the so-called Filter Points
(Figure 14). In both cases, the permeability of the whole mattress is much smaller. A high permeability of the
mattress ensures that any possible pressure build-up under the mattress can flow away, as a result of which the
uplift pressures across the mattress remain smaller.
In general, with a subsoil of clay and silty sand the permeability of the mattress will be higher than the
permeability of the subsoil. Therefore the water under the mattress can usually be discharged without
excessive lifting pressures on the mattress.
The permeability of the mattress will be lower than the permeability of the subsoil or sub layers if a granular
filter is applied, or with a sand or clay subsoil having an irregular surface (gullies/cavities between the soil
and the mattress). This will result in excessive lifting pressures on the mattress during wave attack.
Figure 14, Principles of permeability of Filter Point Mattress
23
5.2 Design rules with regard to wave load
The failure mechanism of the concrete mattress is probably as follows:
• First, cavities under the mattress will form as a result of uneven subsidence of the subsoil. The mattress is
rigid and spans the cavities.
• With large spans, wave impacts may cause the concrete to crack and the spans to collapse. This results in
a mattress consisting of concrete slabs which are coupled by means of the geotextile.
• With sufficiently high waves, an upward pressure difference over the mattress will occur during wave rundown, which lifts the mattress (Figure 1).
• The pumping action of these movements will cause the subsoil to migrate, as a result of which an Sprofile will form and the revetment will collapse completely.
It is assumed that local settlement of the subsoil will lead to free spans of the concrete mattress. Then, the
wave impact can cause the breaking of these spans, if the ratio of Hs/D is too large for a certain span length. A
calculation method is derived on the basis of an empirical formula for the maximum wave impact pressure
and the theory of simply supported beams. The collapsing of small spans (less then 1 or 2 m) is not
acceptable, since these will lead to too many cracks.
The empirical formula for the wave impact is (Klein Breteler et al 1998):
Fimpact
ρg
=7.2H s2 tan α
(25)
With: Fimpact = impact force per m revetment (N).
Calculation has resulted in an average distance between cracks of only 10 to 20 cm for a 10 cm thick mattress
and wave height of 2 m. This means that at such a ratio of Hs/D the wave impacts will chop the mattress to
pieces. For a mattress of 15 cm thick and a wave height of 1.5 m the crack distance will be in the order of 1
m.
Apart from the cracks due to wave impacts, the mattress should also withstand the uplift pressures due to
wave attack. These uplift pressures are calculated in the same way as for block revetments. For this damage
mechanism the leakage length is important.
In most cases the damage mechanism by uplift pressures is more important then the damage mechanism by
impact.
The representative/characteristic values of the leakage length for various mattresses can be assumed as
follow:
Leakage length Λ (m)
Mattress
on sand*)
on sand**)
Standard - FP
FPM
Slab
Articulated (Crib)
3.9
3.9
9.0
1.0
*)
**)
1.5
1.0
3.0
0.5
on filter
2.3
2.0
4.7
0.5
good contact of mattress with sublayer (no gullies/cavities underneath)
pessimistic assumption: poor compaction of subsoil and presence of cavities under the mattress
24
Figure 15 Calculation results for concrete mattresses (Hs/∆D < 4 because of acceptable crack distance due to
impacts on spans).
Taking into consideration the above failure mechanisms, the following design (stability) formula has been
derived for the mattresses (Eq. 3b):
Hs = F
2/3
∆ D ξ op
with :
Hs
∆ D = 4
max
(26)
with:
D
=
mass per m2
(which can be called Deffective or Daverage)
ρs
∆
ρs
F
=
=
=
relative volumetric mass of the mattress (-) = (ρs - ρ)/ρ
volumetric mass of concrete (kg/m3)
stability factor (see below)
For an exact determination of the leakage length, one is referred to the analytical model (Klein Breteler et al
1998). However, besides the mattresses of a type as, for example, the tube mat (Crib) with relative large
permeable areas, the other types are not very sensitive to the exact value of the leakage length. It can be
recommended to use the following values of F in design calculations:
• F = 2.5
• F = 3.5
• F = 4.0
or (≤ 3) - for low-permeable mattresses on (fine) granular filter,
or (≤ 4) - for low-permeable mattress on compacted sand,
or (≤ 5) - for permeable mattress on sand or fine filter (Df15 < 2 mm).
The higher values can be applied for temporary applications or when the soil is more resistant to erosion (i.e.
clay), and the mattresses are properly anchored.
25