Nghiên cứu xác định hàm lượng một số hợp chất clobenzen từ các nguồn phát thải không chủ định tại các khu công nghiệp thái nguyên tt tiếng anh
Bạn đang xem bản rút gọn của tài liệu. Xem và tải ngay bản đầy đủ của tài liệu tại đây (1.17 MB, 26 trang )
MINISTRY OF EDUCATION
AND TRAINING
VIETNAM ACADEMY
OF SCIENCE AND
TECHNOLOGY
GRADUATE UNIVERSITY SCIENCE AND TECHNOLOGY
------- *** -------
STUDY TO DETERMINE THE CONTENT OF SOME
CHLORBENZEN COMPOUNDS FROM UNINTENTIONAL
EMISSION SOURCES IN INDUSTRIAL ZONES IN THAI
NGUYEN PROVINCE
Major: Analyticalchemistry
Code: 9.44.01.18
SUMMARY OF DOCTORAL THESIS
Ha Noi, 2019
1
This thesis is completed at: Vietnam Academy of Science and
Technology
Scientific instructors:
Assoc. Dr. TU BINH MINH
Assoc. Dr. NGUYEN THI HUE
Thesis reviewer 1: Prof. Dr.
Thesis reviewer 2: Assoc. Dr.
Thesis reviewer 3: Assoc. Dr.
The thesis will be presented to the scientific council at the Vietnam
Academy of Science and Technology at …..h, date ….., month ….., year
2019
2
INTRODUCTION
1. The urgency of the thesis
Research on the pollution of persistent organic compounds
(POPs) has been receiving the attention of many scientists all around
the world. The assessment of pollution levels and emissions of dioxinlike chlorobenzene compounds such as hexaclobenzene (HCB),
Pentaclobenzene (PeCB), tetrachlorene (TeCB), triclobenzene (TCB),
diclobenzene (DCB) is the scientific basis for countries. Participating
in signing the Stockholm Convention to implement the plans for
management, disposal and environmental pollution treatment by POPs
well. In Vietnam, the focus is mainly on studying U-POPs such as
dioxin, furans and PCBs in soil, sediment, organisms and human.
Disclosures related to unintentional emissions of chlorbenzen
compounds into the environment from industrial manufacture and
waste disposal in Vietnam are limited.
From above problems, it is necessary to research into the
overall sources of emissions and the level of environmental pollution
caused by the sources of industrial waste of chlorbenzenes, optimizing
the efficiency of the process analysis in accordance with conditions in
Vietnam. This is a topical issue in current conditions when health and
environment in Vietnam are at an alarming level. Therefore, I decided
to choose the topic "Study to determine the content of some
chlorbenzen compounds from unintentional emission sources in
industrial zones in Thai Nguyen province", contributing to the
protection and sustainable development of ecological environment in
Thai Nguyen province.
2. Research objectives of the thesis
- Study the process of simultaneous determination and evaluation of
the
method of
analyzing 7
chlorobenzene,
3
including 1,2-
dichlorobenzene (1,2-DCB); 1,3-dichlorobenzene (1,3-DCB); 1,2,4trichlorobenzene (1,2,4-TCB); 1,2,3,4-tetrachlorbenzene (1,2,3,4TeCB), 1,2,4,5-tetraclobenzene (1,2,4,5-TeCB); pentaclobenzene
(PeCB) and hexaclobenzene (HCB) in trace and superficial content in
flue gas samples and industrial waste (fly ash, bottom ash, input
materials).
- Adopting an optimal procedure to simultaneously identify
chlorobenzene in industrial samples including waste gas, ash,
materials of some industrial fields in industrial zones in Thai Nguyen
province.
- Preliminary assessment of the level and emission characteristics of
chlorobenzene from the thermal process of a number of industrial
fields including waste incinerators, metallurgy, brick production and
cement production.
3. The main research contents of the thesis
- Study the process of simultaneous determination and evaluation of
the method of analyzing 7 chlorobenzene
+
Survey and select optimal conditions to analyse
chlorbenzen compounds on gas chromatography equipment using
electronic resonance detector (GC-ECD) and mass spectrometry (GCMS)
+ Investigate optimization of processing samples including
extraction, cleaning and enrichment.
+ Verification of analytical methods: determination of linear
range, calibration curve, detection limit and quantitative limit,
recovery coefficient and repeatability of the method.
- Apply the optimal procedure to simultaneously identify
chlorbenzenes in industrial samples.
4
+ Analysis of the content of chlorbenzenes in gas samples and
solid samples taken from factories in Thai Nguyen province and some
northern provinces on GC-ECD equipment and confirm the presence
of above chlorinated benzene compounds GC-MS.
+ Evaluation of homogeneous characteristics is the ratio of the
content of each substance to the total content of chlorobenzene, in the
types of industrial waste gases and solid waste samples.
+ Evaluation of emission factors is to find out annual
emissions and the risk of chlorobenzene on humans from a number of
industries in Thai Nguyen province.
4. New contributions of the thesis
1. Optimized conditions to simultaneously identify 7 clobezen
targets, in industrial samples (waste gas samples and waste solid
samples (Fly ash, bottom ash) in trace amounts and super stains using
GC-ECD and GC-MS.
2. Successfully developed the process of analyzing
chlorbenzen compounds in trace amounts and super stains.
3. The first step was to identify and determine the emission
level through the emission factor and the annual emission of 7
chlorbenzenes from industrial solid waste samples in Thai Nguyen
province.
This is the first published study in Vietnam on unintentional
emission levels of chlorbenzenes in some industries. Thereby
contributing to the control of emissions to limit and completely
eliminate hazardous POPs in the environment, meeting the
requirements of the Stockholm Convention, towards sustainable
development in Vietnam
5
CHAPTER 1: OVERVIEW OF RESEARCH PROBLEMS
1.1. OVERVIEW OF THE RESEARCH SUBJECT
1.1.1. Overview of Chlorobenzens
Derivatives of chlorbenzenes C6H (6-x) Clx form a stable and
colorless group with a pleasant odor. Chlorine can be substituted for
six hydrogen atoms on benzene rings to be able to form twelve
different chlorinate compounds including: Monoclobenzene (MCB);
ortho-diclobenzene (1,2-DCB); meta-diclobenzene (1,3-DCB), paradiclobenzene (1,4-DCB); 1,2,3-triclobenzene, 1,2,4-triclobenzene;
1,3,5-triclobenzene; 1,2,3,4-tetraclobenzene; 1,3,4,5-tetraclobenzene;
1,2,4,5-tetraclobenzene; Pentaclobenzene; Hexaclobenzene. The
physical and chemical properties of clobenzene (CBz) compounds
when they are released into the environment, are likely to evaporate
into the atmosphere. The atmospheric CBz will be decomposed
primarily through reactions with hydroxyl radicals to produce
nitroclobenzene, clophenol, and fatty dicarbonyl products, which
continue to be removed by photochemistry or reaction with hydroxyl
radicals. CBz compounds released into water will accumulate in
suspended solids and sediments (especially rich organic sediments).
All CBz are easily absorbed by humans and animals through the
digestive and respiratory pathways.The absorption is affected by the
position and number of chlorine in chlorobenzene congeners. After
absorption, chlorbenzenes quickly distribute to organs, accumulate
mainly in adipose tissue and can remain there for a long time, in small
amounts in the liver and other organs
1.1.2. the formation of chlorbenzen compound from some
industrial activities
An incomplete destruction of burned materials in which CBz
is available. CBz Formed by the metabolism of compounds is
precursor or formed in low temperature areas from carbon particles
and chlorine compounds - synthesized denovo. However, the CBz
emission content during combustion depends very much on the
6
combusting conditions and the presence or absence of catalytic
materials. CBz can also be formed due to the chlorination process of
HCB (Figure 1.1) in the presence of catalysts such as Cu, CuO, High /
a-Fe2O3 metal .....) to create copper lower chlorine CBs
1.2. DOMESTIC AND OVERSEAS STUDY SITUATION
1.2.1. Studies in the world
In recent years, a number of studies have also focused on
unintentional POPs emissions from the production of non-ferrous
metals and ferrous metals, iron ore production of iron and steel, coke
production and other secondary color metallurgy process. A research
in China in the industry of zinc and lead metals production in 2007
showed that the average emission factor of PCDD / Fs in gas samples
for lead and zinc manufacturing industry is 98.2 and 0.35, respectively.
ng TEQ / (Nm3); in fly ash samples is 5.64 ng TEQ / g with zinc
industry; 0.05 ng TEQ / g in lead manufacturing industry. Emission
factors of gas samples for PCBs from zinc and lead production are
respectively 2,786 and 0,002 ng TEQ / Nm3.The formation and
reduction of emissions of clobenzene, polychlorinated dibenzo-pdioxin and dibenzofurans polychlorinated (PCDD / Fs) have been
studied in a typical dry cement kiln in China. Emissions of PCDD / F
and CBz in emissions are 0.16 ng I-TEQ Nm-3 and 26 µg / Nm3
respectively. The concentration of 1,2-DCB ranges from 100 - 9424
ng / Nm3; 1.3 and 1.4 –DCBz are 223 - 6409 ng / Nm3 1,3,5 / 1,2,4 /
1,2,3- TCB in the range of 35 - 3542 ng / Nm3 (of which 1.2, 4
accounts for the largest amount); 1,2,3,5-TeCB & 1,2,4,5-TeCB range
between 2 - 491 ng / Nm3, while isomer 1,2,3,4-TeCB is 6 - 562 ng /
Nm3 ; Concentrations PeCB and HCB range from 1 to 335 ng / Nm3
and 1 to 128 ng / Nm3 respectively.
1.2.2. Domestic studies in Vietnam
Studies on POPs compounds such as dioxin / furan, DDT,
PCBs in Vietnam have been of interest since the end of the 20th
century because of their toxicity and changes in awareness in
7
environmental protection of managers as well as scientists. However,
in Vietnam, the focus is only on studying POPs in environmental
objects of soil, sediment, organisms and people to overcome the
consequences of chemical toxins / dioxin. No claims have been made
regarding the assessment of the emissions of chlorbenzen compounds
(DCB, TCB, TeCB, PeCB, HCB) unintentionally emissions in many
industrial production and recycling industries. So the assessment and
comparison of pollution levels and emission sources for this group of
substances face many difficulties.
CHAPTER 2: EXPERIMENT AND RESEARCH METHOD
2.1. SCOPE AND SUBJECTS OF RESEARCH
The research object of the thesis is 7 chlorbenzen targets of 5 isomers,
including dichlorobenzene (1,2; 1,3 - DCB); trichlorobenzene (1,2,4TCB); tetraclobenzene (1,2,3,4; 1,2,4,5-TeCB); Pentaclobenzene
(PeCB) and hexaclobezen (HCB).
* Industrial factories and incinerators in Thai Nguyen province are
listed in table 2.1
* Industrial production plants and incinerators in Northern provinces
of Vietnam collected for comparison with samples collected from Thai
Nguyen
Table 2. 1. Information about actual samples
orde
r
Sample
factory
name
Date of
samplin
g
Factor
y sign
Type of
productio
n
Capacit
y
(ton / h)
Emissio
n rate
(Nm3 /
h)
Averag
e
capacit
y / year
THÁI NGUYÊN
1
2
Viet Trung
black
metallurgy
factory
Metallurgic
al company
2
03/2014
NMLK
1
iron and
steel
6,0
31000
8040
06/2014
NMLK
2
Zinc oxide
1,0
14700
7000
8
3
4
5
6
7
8
9
10
11
12
Duc Thinh
Mechanical
Company
Thai
Nguyen
Black
Metallurgy
Joint Stock
Company Nam Son
Black
Metallurgic
al Plant
Mechanical
Factory
Z115
Ministry of
Defense Thai
Nguyen
Thai Son
tunnel
brick
factory
Khe
Mo
tunnel
brick
factory
Quan Trieu
Cement
Factory
Phuc
loi
Trade and
Service
Cooperativ
e
Dong Hy
General
Hospital
Incinerator
for
domestic
waste - DaPhu Luong
town
Household
waste
12/2017
NMLK
3
Cast Iron
2,5
-
2496
03/2017
NMLK
4
Cast Iron
5,8
-
8040
12/2017
NMLK
5
Steel rolling
0,04
-
8040
03/2014
NMVL
1
Brick
5,8
16500
6530
03/2017
NMVL
2
brick
5,0
-
8040
06/2014
NMVL
3
Cement
40
-
7920
06/2014
LDCN
Industrial
waste
0.25
20000
2640
03/2014
LDYT
Medical
waste
0.2
-
1536
03/2017
LDSH
1
Domestic
waste
0,45
-
2900
03/2017
LDSH
2
Domestic
waste
0,7
-
2900
9
13
14
incinerator
- Song Cau
town
Waste
incinerator
Trai
CauTan
Cuong
waste
incinerator
waste
incinerator
Tan
Cuong
town
03/2017
LDSH
3
Domestic
waste
0,45
-
2900
03/2017
LDSH
4
Domestic
waste
0,7
-
2900
2.2. RESEARCH METHODS
2.2.1. Objectives of the study
2.2.2. research content
2.2.3. Methods of document review
2.2.4. Survey method
2.2.5. Experimental method
2.2.5.1. Sampling, shipping and preservation methods
2.2.5.2. Sampling and actual sample information
2.2.5.3. Method of CBz analysis on GC-ECD equipment
2.2.5.4. Study the sample processing process and confirm the use
value of the method
2.2.5.5. Analysis of real samples
2.2.5.6. Evaluation of emission levels and assessment of the risk of
chlorbenzen compounds
10
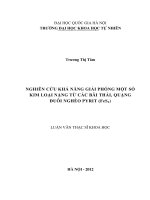
2.3. PROCESS OF ANALYSIS
Figure 2.1 Process of analyzing CBz in solid samples
Figure 2.2. Process of analyzing CBz in gas sample
11
CHAPTER 3: RESULTS AND DISCUSSION
3.1. SURVEY THE OPTIMIZED CONDITIONS FOR
ANALYSIS OF CBZ TIMES ON GAS ACCESSORIES
3.1.1. Investigate optimal conditions with CBz standard solution on
GC-ECD equipment
3.1.1.1. Column temperature program
According to the results, it was found that the increase of high
temperature from 120oC – 150oC was not suitable, so the thesis
selected the temperature of 70o C as the initial temperature then
gradually increased the temperature to 120oC in 2 minutes, the
separation of substances with more reasonable retention time. CBz
results show that at a low heating rate of 5 ° C / min long analysis time
(more than 30 minutes) causes time to analyze as well as other factors.
High heating speed of 20° C / min causes peaks to be eluted quickly,
thus resulting in peak duplication. At a heating speed of 10°C / min,
it’s good for peak separation and reasonable analysis time (about 20
minutes). Therefore, choosing a heating speed of 10° C / min for
further studies. After investigating the optimal conditions when
analyzing CBz with GC-ECD, the parameters are listed in Table 3.1.
Table 3.1. Excellent parameters when analyzing CBz on
GC-ECD 2010 device
Pump port temperature
220 ° C
Air flow mode
Pressure
Column head pressure
100 kPa
Volumetric
suction 1 µl
sample
Pump mode
Divide the line
Line split rate
1:10
Sample
pumping Pressure
program rate
Flow
through 1 ml / minute
column
Separation
column
SPB-608 (30 m × 0.25 mm × 0.25 µm)
Column oven temperature program
70 oC
Heating speed 10° C / min; hold 2
70 oC to 120oC
minutes
12
120 oC to 280oC
Heating speed 10° C / min; hold for 5
Total analysis timephân minutes
18minutes
tích
Detector
Temperature
300 °C
Gas carries
Nitrogen
3.1.1.2. Sample pump conditions
Results of analysis on GC-ECD showed that when using nonsplit mode, the peak has a special tail-pulling phenomenon at peak 1
and 2, which affects the process of determining the area of peak used
for quantification. The thesis chooses split-line mode to analyze CBz
on GC-ECD equipment. At low current conditions of 1: 5, peaks tend
to move toward the solvent peak. 1: 20 high current split conditions
for low signal PeCB, HCB signal, increase the influence of baseline
during analysis. Therefore, the thesis uses the ratio of 1:10 for the
peaks of the CBz signals and is used in the next survey conditions. The
result of retention time of CBz is shown in Table 3.2
Table 3.2. Retention time of CBz standard solutions on GCECD equipment
Number
1
2
3
4
5
6
7
8
9
Name of substance
1.3 Diclobenzen
1.2 Diclobenzen
1.2.4 Triclobenzen
1.2.4.5 Tetraclobenzen
1.2.3.4 Tetraclobenzen
Pentaclobenzen
Hexaclobenzen
CB 209
Pentanitroclobenzen
Retention time (minute)
4.667
5.310
7.812
10.707
11.974
14.016
16.729
17.545
17.885
3.1.2. Results of evaluation of stability of CBz analytical signal on
GC-ECD device
3.1.2.1. Stability of analytical signals
Calculated results of research CBz for repeated injections of standard
solution at low concentration C1 and high concentration C2 have RSD
values varying from 1.27% to 15.0% (<20%) which shows repeatability of
good analytical signals, high stability.
13
3.1.2.2. Qualitative limit (LOD) and quantitative limit (LOQ) of the device
The analytic results obtained the LOD value of the gas
chromatograph for the study CBz ranging from 0.94 to 1.46 ppb and LOQ
value from 3.14 to 4.87 ppb. This is a concentration with good detectional
sensitivity and a relatively stable peak signal.
3.1.3. Determine the linear range of the calibration curve of CBz on
GC-ECD device
The calibration curves of substances has regression coeffiction R2
greater than 0,99
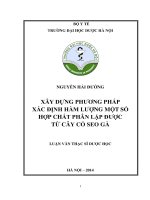
3.1.4. Analysis of CBz on GC / MS equipment
3.1.4.1. Optimal condition for CBz analysis on GC / MS equipment
Table 3.3. Optimal parameters when
analyzing CBz on GC-MS devices
(a)-Chromatography scan CBz on
GC-MS device
Table 3.4. Parameter of mass
spectrometry and retention time of CBz
on GC-MS device
(b) Chromatography standard CBz
solution 10 ng / g
( 1: 1,3-DCB; 2: 1,2- DCB; 3: 1,2,4 - TCB; 4: 1,2,4,5 - TeCB;5: 1,2,3,4 – TeCB;
6: PeCB; 7: HCB;8: PeCNB)
Figure 3. 1. Chromatogram of CBz on GC / MS device
14
Based on the analytical conditions on GC-MS, analyze and
inject some analytical samples with complex background as waste ash
onto GC-ECD and GC-MS to confirm the presence of Chlorbenzenes
in these samples
3.1.4.2. Detection limit (IDL) and quantitative limit (IQL) of CBz on
GC / MS equipment
LOD values of GC / MS chromatography equipment for CBz
range from 1.25 to 3.75 ppb and LOQ values from 4.16 to 12.5 ppb.
3.2. STUDYING CONDITIONS OF EXCLUSION AND
EXECUTION OF CBz
3.2.1. Investigate the optimal conditions for sample cleaning on
GC-ECD equipment
3.2.1.1. Liquid - solid extraction method
The results of the survey show that the recovery of CBz which
when extracting with different solvents varies widely from 66.7 to
96.1%. It can be seen that the recovery of all CBz is uniformly high
when extracted with DM1.1 (from 81.8 to 96.1%) and DM 2.3 (80.3 93.0%). For compounds 1,2 and 1,3-DCB the recovery in DM 1.2 is
quite high compared to other survey solvents (83 -85%) and the lowest
in DM 2.1 solvent (65.2 - 67.6%). Thus, to be able to simultaneously
identify 7 CBz, the thesis selected solvent extracting sample DM1.1
for high recovery evenly with all CBz, with relatively small standard
deviation (<10%)
3.2.1.2. Soxhlet extraction method
Results of CBz recovery by Soxhlet extraction method with
solvents give the best recovery, uniformity and stability for 7 CBz
(83.8 to 99.2%) when using solvent mixture DM 1.1 and DM 2.1
solvent (82.2- 108%).
Results of recovery from two extraction methods showed that
liquid-solid extraction method for ash and dust samples gave lower
recovery than Soxhlet extraction method but still met the requirements
15
for analyzing trace amounts Volatile organic in the complicated
sample matrix (recovery over 80%).
3.2.2. Survey optimal conditions during sample cleaning
3.2.2.1. Method of cleaning up the extract on the column using
activated carbon silica gel mixture 10%
Table 3.10. Survey elution solvent on silicagel extraction column +
activated carbon 10%
Diclometan :
hecxan (1 :3)
CH 1 (mL)
40
60
120
76,5 81,3 79,8
78,3 82,4 70,9
80,2 80,5 72,5
Aceton : hecxan
(1 :1)
CH 2 (mL)
40
60
120
78,6
79,1 64,9
75,7
79,6 63,1
79,8
79,5 64,4
Aceton : hecxan
(1 :2)
CH 3 (mL)
40
60
120
73,3 81,2
67,7
72,6 79,1
61,2
78,3 81,7
73,7
78,3
86,8
79,4
70,1
74,7
60,6
72,8
80,8
70,2
77,6
87,4
73,5
70,2
76,6
65,7
77,9
82,9
70,7
PeCB
81,2
83,6
72,0
71,4
75,7
70,2
77,5
79,8
72,6
HCB
80,5
87,2
80,2
73,6
77,1
63,7
80,7
80,2
75,9
Name
1,3 – DCB
1,2- DCB
1,2,4– TCB
1,2,4,5–
TeCB
1,2,3,4–
TeCB
Thus, to ensure the recovery of CBz substances on the column
of silica gel + 10% activated carbon, as well as limiting the use of large
amounts of organic solvents, the thesis selected CH1 volume in the
elution step to be 60 ml for further studies.
3.2.2.2. Method of cleaning up the extract on the column using florisil
column
The recovery results of the CBzs when extracted with florisil
column with the dichloranic primer system: hexane (1: 3 v / v) ranges
from 80 to 115% (with RSD values between 2.6 and 9.8 %). Thus, both
columns of silicagel + activated carbon and Florisil give recovery (>
80%) within the allowable limits according to EPA 8121 method
guidelines (with the recovery range from 59 to 116%).
16
140
120
100
80
60
40
20
0
Florisil
1
2
Silicagel + than hoạt tính
3
4
5
6
7
Figure 3.2. Comparison between two columns of silicgel extract +
activated carbon and florisil
3.3. OPTIMAL RESULTS METHOD OF ANALYZING
3.3.1. Determine the detection limit and the quantitative limit of the method
T
T
1
2
3
4
5
6
7
Table 3. 6. MDL and MQL values of the research CBz
MDL
R=
Name
SD
MQL
(ng/g)
TB/MDL
1,3-DCB
0,026
0,077
10,4
0,26
1,2-DCB
0,039
0,117
6,2
0,39
1,2,4-TCB
0,018
0,054
7,4
0,18
1,2,4,5-TeCB 0,016
0,050
8,0
0,16
1,2,3,4-TeCB 0,023
0,069
7,4
0,23
PeCB
0,019
0,057
4,8
0,19
HCB
0,021
0,062
4,7
0,21
3.3.2. Determine the accuracy of the method
The recovery of CBz is often and the standard of CB 209 is quite
wide ranging from about 79.7% to 113.7%. The relative standard
deviation of the analytes in the repeat sample is between 3.53 and
12.9%. The results of summarizing the use values of the analytical
method are summarized in the following table:
Table 3.7. Summary of parameters confirms the use value of the
method
17
Name
MDL MQL Recovery
(ng/g) (ng/g)
H (%)
Recovery
of
US-EPA
8121
uncertainty
U%
79,9 –
103
34,0
113,7
79,7 –
77,0- 102
28,8
0,117 0,391
107,8
78,5 –
59,0
24,4
0,054 0,180
85,2
82,0 –
102
28,3
0,050 0,168
94,8
81,6 –
104
26,9
0,055 0,184
92,7
83,9 –
PeCB
73,0 -129
19,6
0,078 0,290
108
80,1 –
HCB
84,0 -116
25,8
0,062 0,210
105,1
3.4. EVALUATION OF POLLUTION AND WASTE LEVELS
OF CLOBENZEN COMPONENTS IN SOME INDUSTRIAL
ACTIVITIES
3.4.1. Pollution levels and chlorbenzen emissions in flue gas samples
The average concentration ranged from 2,00 to 69,8 ng / Nm3.
CBz content in iron smelter is equivalent to zinc oxide production plant
and is about 15 times higher than tunnel brick factory and plastic
recycling plant. The large concentration of iron and steel furnaces can
be attributed to the high temperature manufacturing process of iron ore
inputs, the presence of metals, and metal oxides acting as substances.
The catalyst leads to the formation of precursors (Cl2; benzene...) and
synthesis of CBzs (especially PeCB and HCB) according to the
mechanism of denovo formation. The results also show that the
concentration of CBz in combustion gas is higher than the surrounding
gas sample
1,3DCB
1,2DCB
1,2,4TCB
1,2,4,5TeCB
1,2,3,4TeCB
0,077
0,258
18
3.4.2. The level of pollution and emissions of chlorobenzene in
industrial solid waste samples
3.4.2.1. The level of pollution and emissions of chlorbenzenes in the
metallurgy industry
From the research results, there are significant differences in the
average content of CBz in the metallurgy industry (zinc oxide
production - NMLK2) and the black metallurgy industry (pig iron,
steel-NMLK3; NMLK4) Content. The CBz in fly ash samples and
bottom ash is shown in Figure 3.3
Figure 3.3. Concentration of CBz in metallurgical plants
3.4.2.2. The level of pollution and emissions of chlorbenzenes in
some construction materials industries
The average total CBz content in solid samples of NVVL1,
NMVL2 and NMVL3 ranged from 2.69 to 22.6 ng / g. In which CBz
content of NMVL1; NVVL3 has a similar content and is smaller than
NMVL2. The CBz content in the two tunnel brick factories was
significantly different, at NMVL2 7 times higher than NMV1. When
compared to the results reported in some countries, the CBz content in
this study is much smaller than in the results obtained in cement plants
in China.
3.4.2.3. The level of pollution and emissions of chlorbenzenes in waste
incinerators
From the results of the research, the average content of CBZ in
3 types of industrial, medical and urban incinerators ranges from 26.4
to 34.7 ng / g dry samples and the difference is not significant. With
19
LDCN ranging from 6.27 to 58.1 ng / g; Health insurance from 4.54 54.7 and LDSH from 23.5 to 46.0 ng / g. The concentration fluctuates
with the lowest level of 4.54 ng / g and the highest one of 58.1 ng / g.
3.2.2.4. The level of pollution and emissions of chlorbenzenes in solid
samples in Thai Nguyen compared to other provinces in northern
Vietnam
Table 3.8. The average concentration of CBz in waste solid samples
of provinces in northern Vietnam
The average content of total CBz ng / g dried
samples
Type of
industry
Provinces in Northern Vietnam
This
study(TN) (HP) (HD) (QN) (HN) (BN)
Metallurgy (n =
30,3
22,9 5)
Household
waste
34,7
154 15,3 90,9 405
27,6
incinerator (n =
5)
Industrial waste
incinerator (n =
26,4
102
3)
Medical
incinerator (n =
29,6
15,8 2)
( - ) : no analysis; (TN : Thai Nguyen ; HP : Hai Phong ; QN :
Quang Ninh ; BN : Bac Ninh)
Table 3.8 results show that the CBz content in the provinces
varies quite significantly in incinerators, with CBz concentration range
fluctuating quite wide, the lowest is 15.3 ng / g and the highest is 405
ng / g. In general, the CBz emission level of TN is lower than that of
other provinces in Northern Vietnam
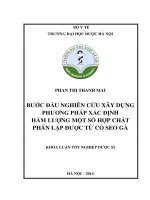
3.5. CHARACTERISTICS OF ACCUMULATION OF
CONGENERS OF CHLORBENZENESIN WASTE OF SOME
INDUSTRIAL ACTIVITIES
20
NMLK5
3.5.1. Characteristics of accumulation of congeners of
chlorbenzenes in solid waste of metallurgy and production of tunnel
bricks
3.5.1.1. Metallurgical industry
Tro đáy
Tro đáy
NMLK4
1,2-DCB
1,3-DCB
1,2,4-TCB
Tro bay
1,2,4,5-TeCB
1,2,3,4-TeCB
Tro đáy
NMLK3
PeCB
HCB
Tro bay
Tỷ l ệ % 0%
20%
40%
60%
80%
100%
Figure 3.4. The cumulative percentage of CBz's congeners in
metallurgy
The average cumulative level of 7 copper types in 3 steel, cast
iron and steel rolling furnaces is arranged in order: PeCB (1.5%) <1,2
- DCB (3.5%) <1,2 , 4.5- TeCB (5.1%) <1.3 - DCB ̴ HCB <1,2,3,4 TeCB (15%) <1,2,4 - TCB (39.4%).
3.5.1.2. Manufacturing tunnel bricks
In general, the content of CBz congeners in metallurgy is higher
than that of brick production. But in terms of the cumulative order in
percentages of 1,2 - DCB, they are the same, each with the lowest and
highest percentage, still HCB.
Figure 3.5. Accumulated percentage of CBz's congruence in
brick production
21
The average concentration of 7 chlorobenzenes in fly ash and
bottom ash samples ranged from 1.54 ng / g to 31.2 ng / g, the
concentration of CBz in fly ash was higher than that of bottom ash.
The lowest concentration is 1,2,4,5-TeCB with 3.41 ng / g in fly ash
and PeCB (LOD-1.64 ng / g) in bottom ash, this level of accumulation
is not significantly different from with smelting furnace and brick
production furnace. For diclobenzene, 1,2 / 1,3-DCB accounts for a
relatively high proportion of total CBz, ranging from 25.2 to 33.6%
3.5.2. Characteristic distribution of congeners of chlorbenzen
compounds in waste incinerators
Table 3.20. Concentration of 7 CBz congeners in waste incinerators
in Thai Nguyen
Average concentration of total CBz ng/g)
LDSH1 LDSH2 LDSH3
LDSH4
Name
Bottom Bottom Bottom Fly ash Bottom
ash
ash
ash
ash
1,2 - DCB
21,9
5,14
< MDL
31,2
17,5
1,3 - DCB
6,36
6,31
16,9
22
2,18
1,2,4 - TCB
12,3
< MDL
2,27
10,1
2,86
1,2,4,5 –
< MDL
1,99
1,09
3,41
3,07
TeCB
1,2,3,4 –
3,57
1,06
4,38
7,39
6,38
TeCB
PeCB
< MDL
0,21
< MDL
5,55
6,33
HCB
8,23
13,6
3,89
3,19
5,74
Tổng CBz
52,5
28,4
28,6
82,8
44,1
The highest CBz congeners detected in the waste incinerator
samples are two types 1,2 and 1,3 - DCB, the ratio of these two types
ranges from 25.2 to 33.6% of CBz content, totally, in which co-type
1,2-DCB has a high percentage of superiority to solid samples of brick
and metallurgical kilns. Next is some co-types like 1,2,4-TCB, 1,2,3,4
TeCB, HCB with the rate of 9.5 - 12.2% lower than in metallurgical
furnace and equivalent to the furnace brick production. The cocategories 1,2,4,5 - TeCB and PeCB account for a low percentage.
22
3.6. EVALUATION OF THE EMISSION NUMBER AND
ANNUAL EMISSIONS OF CLOBENZEN COMPONENTS IN
SOME INDUSTRIAL ACTIVITIES
3.6.1. Evaluation of emission factors of exhaust gas samples
Emission factor of total CBz in gas samples of industrial plants
ranged from 11640 to 889300 ng / ton, average 355380 ng / ton (with
annual emissions from 440900-17391000 µg / year), lowest for Tuyne
brick factory (NMVL1: annual emission 440900 µg / year) and highest
for zinc smelter (NMLK2: 17391000 µg / year).
3.6.2. Evaluation of emission factors and annual emissions of waste
solid samples
As a result of initial research, it is possible to see higher
emission factors in waste incinerators than metallurgy, brick and
cement plants. The emission factor of 7 CBz congeners in solid
samples shows that most CBz congeners have quite high emission
factors in incinerators, followed by metallurgy and eventually is the
tunnel brick industry. The emissions of congeners in this study are
much lower than those reported by Lemieux et al., 2004 in domestic
waste incinerators (0.08 - 0.16 mg / kg).
Through preliminary research results, industrial production activities
are a source of potential formation and emission of CBz compounds.
The level of emission of CBz in some industrial activities in Thai
Nguyen province increased gradually in the order: waste incinerator,
iron and steel production, brick and cement production. The
cumulative percentages of chlorbenzenes are different according to the
different types of industrial production. This is the first work to
evaluate the emission factor and the annual emissions of CBz
generated unintentionally from the first industrial activities in
Vietnam.
3.7. ASSESS THE LEVEL OF RISK OF SOME
CHLORBENZEN CONGENERS FROM INDUSTRIES IN THAI
NGUYEN
23
In this study, two routes of exposure including ash inhalation
and skin exposure were evaluated. People can eat a small amount of
indirect ash in food and other sources including inhaled particles.
Humans can also come in direct contact with bottom ash and fly ash
particles in the air through skin absorption. In general, CBz absorption
decreased in the order of TCB> HCB> DCB> TeCB> PeCB.
Comparison of daily intake of 1,3-DCB, 1,2,4-TCB, 1,2,4,5-TeCB,
1,2,3,4-TeCB, PeCB and HCB, and steam absorption Daily allowance
allowed (TDI),
These findings suggest the need to monitor continuous
emissions and assess human exposure to chlorine compounds not only
continuously for PeCB and HCB but also for reducing chlorinated
congeners. This is also the first data on CBz emission factors and
emissions from a number of industrial types such as waste incineration
and steel making. This information may be useful for controlling
unintentional persistent organic pollutants (UPOP) in Vietnam.
CONCLUSIONS
Successfully developed a process of simultaneous analysis of 7
co-chlorinated benzene (1,2-dichlorobenzene, 1,3-dichlorobenzene;
1,2,4-trichlorobenzene; 1,2,4,5-tetraclobenzene; 1 , 2,3,4tetrachlorobenzene, pentacarbonbenzene and hexacarbonbenzene) in
industrial waste and solid waste samples, including sample and
qualitative processing, quantified on two GC-ECD and GC-MS
devices. Results showed that detection limits of chlorbenzenes ranged
from 0.05 to 0.17 ng / g; Quantitative limits range from 0.16 to 0.391
ng / g. Recovery is in the range of 79.7 - 113% (with standard deviation
<15%).
Initial assessment of pollution levels and emission
characteristics of chlorobenzene in industries in Thai Nguyen province
include waste incinerators, iron and steel smelting, zinc oxide
smelting, tunnel bricks, and cement. The results show that the level of
24
emissions in waste gas and solid waste follows the trend: waste
incinerator> practice of iron, steel, metal, zinc oxide> tunnel brick>
cement. The concentrations of chlorobenzene of these industries
ranged from 2.0 to 69.8 ng / Nm3 for flue gas samples and 2.69 to 70.1
ng / g for waste solid samples. The homogeneous characteristic of
chlorbenzenes exhibits a clear variation in various industries, proving
that the formation mechanism is not intentionally complicated at these
industrial facilities..
Initial assessment of unintentional levels of chlorobenzene
through calculation of emission factors and annual emissions of these
substances in waste incinerators, metallurgy, tunnel bricks, cement .
Emission factors of 7 chlorbenzen substances oscillating in flue gas
samples are about 11.6 - 889 µg / ton with annual emissions from
441000 - 17391000 µg / year; Emission factors in solid samples range
from 0.002 to 23.3 µg / ton with annual emissions of 5 - 95600 µg /
year.
LIST OF PUBLISHED WORKS
1.
Nguyen Thi Hue, Nguyen Thi Thu Thuy, Nguyen Hoang Tung,
Polychlorinated benzenes and polychlorinated biphenyls in ash and
soil from several industrial areas in the Northern Vietnam: residue
concentrations, profiles and risk assessment, Eviron Geochem Health,
2016, 38: 399-411
2.
Nguyễn Thị Thu Thúy, Nguyễn Thị Huệ, Nghiêm Xuân Trường,
Hoàng Quốc Anh, Từ Bình Minh, Đánh giá mức độ phát thải của các
chất ô nhiễm hữu cơ khó phân hủy phát sinh không chủ định từ một số
hoạt động công nghiệp ở miền Bắc Việt Nam, Tạp chí Khoa học Đại
học quốc gia Hà nội - Khoa học và công nghệ, 2016, 32 (3), 35 - 40
3.
Nguyễn Thị Thu Thúy, Nguyễn Thị Huệ, Từ Bình Minh, Khảo
sát và xây dựng quy trình phân tích lượng vết các chất Pentaclo benzen
và hexaclo benzen trong các mẫu tro và bụi của một số ngành công
25