Impermeable recurve seawalls to reduce wave overtopping
Bạn đang xem bản rút gọn của tài liệu. Xem và tải ngay bản đầy đủ của tài liệu tại đây (4.96 MB, 104 trang )
Impermeable recurve seawalls to reduce wave
overtopping
by
Talia Schoonees
Thesis presented in fulfilment of the requirements for the degree of
MEng(Research) in the Faculty of Engineering
at Stellenbosch University
Supervisor: Mr Geoff Toms
April 2014
Stellenbosch University
Declaration
By submitting this thesis electronically, I declare that the entirety of the work contained therein is my
own, original work, that I am the sole author thereof (save to the extent explicitly otherwise stated), that
reproduction and publication thereof by Stellenbosch University will not infringe on any third party
rights and that I have not previously in its entirety or in part submitted it for obtaining any
qualification.
Date: ................................................
Copyright © 2014 Stellenbosch University
All rights reserved
i
Stellenbosch University
Abstract
Sea-level rise due to climate change results in deeper water next to existing coastal structures, which in
turn enables higher waves to reach these structures. Wave overtopping occurs when wave action
discharges water over the crest of a coastal structure. Therefore, the higher waves reaching existing
structures will cause higher wave overtopping rates. One possible solution to address increasing
overtopping, is to raise the crest level of existing coastal structures. However, raising the crest level of
a seawall at the back of a beach, will possibly obstruct the view to the ocean from inland.
Alternatively, recurves can be incorporated into the design of both existing and new seawalls. The
recurve wall reduces overtopping by deflecting uprushing water seawards as waves impact with the
wall. The main advantage of seawalls with recurves is that their crest height can be lower, but still
allow for the same wave overtopping rate as vertical seawalls without recurves.
This project investigates the use of recurve seawalls at the back of a beach to reduce overtopping and
thereby reducing the required wall height. The objectives of the project are twofold, namely: (1) to
compare overtopping rates of a vertical seawall without a recurve and seawalls with recurves; and (2)
to determine the influence that the length of the recurve overhang has on the overtopping rates.
To achieve these objectives, physical model tests were performed in a glass flume equipped with a
piston type wave paddle that is capable of active wave absorption. These tests were performed on three
different seawall profiles: the vertical wall and a recurve section with a short and a long seaward
overhang, denoted as Recurve 1 and Recurve 2 respectively. Tests were performed with 5 different
water-levels, while the wall height, wave height and period, and seabed slope remained constant. Both
breaking and non-breaking waves were simulated.
A comparison of test results proves that the two recurve seawalls are more effective in reducing
overtopping than the vertical seawall. The reduction of overtopping can be as high as 100%, depending
on the freeboard and wave conditions.
Recurve 2 proves to be the most efficient in reducing overtopping. However, in the case of a high
freeboard (low water-level at the toe of the structure), the reduction in overtopping for Recurve 1 and
Recurve 2 was almost equally effective. This is because all water from the breaking waves is reflected.
Even for the simulated lower relative freeboard cases, the recurve walls offer a significant reduction in
overtopping compared with the vertical wall.
ii
Stellenbosch University
A graph is presented which shows that the length of the seaward overhang influences the overtopping
performance of the seawall. As the seaward overhang length increases, the wave overtopping rate
decreases. However, for high freeboard cases the length of the seaward overhang becomes less
important. The graph gives designers an indication of how recurves can be designed to reduce seawall
height while retaining low overtopping. It is recommended that further model tests be performed for
additional overhang lengths.
Incorporation of recurves into seawall design represents an adaptation to problems of sea-level rise due
to global warming.
iii
Stellenbosch University
Opsomming
Stygende seevlak as gevolg van klimaatverandering, veroorsaak dat dieper water langs bestaande
kusstrukture voorkom. Gevolglik kan hoër golwe hierdie strukture bereik. Golfoorslag vind plaas
wanneer water oor die kruin van ‘n kusstruktuur, hoofsaaklik deur golfaksie, spat of vloei. Dus sal hoër
golfhoogtes tot verhoogde golfoorslag lei. Een moontlike oplossing vir hierdie verhoogde golfoorslag
is om die kruinhoogte van bestaande kusstrukture te verhoog. In die geval van ‘n seemuur aan die
agterkant van ‘n strand, kan hoër strukture egter die see-uitsig na die see vanaf die land belemmer. Om
hierdie probleem te vermy, kan terugkaatsmure in die ontwerp van bestaande en nuwe seemure
ingesluit word.
Terugkaatsmure verminder golfoorslag deurdat opspattende water, afkomstig van invallende golwe
terug, na die see gekaats word. Die grootste voordeel van ‘n terugkaatsmuur is dat hierdie tipe muur ‘n
laer kruinhoogte as die vertikale seemuur sonder ‘n terugkaatsbalk, vir dieselfde golfoorslagtempo kan
hê.
Hierdie projek ondersoek dus die gebruik van terugkaatsmure aan die agterkant van ‘n strand met die
doel om golfoorslag te verminder en sodoende die vereiste muurhoogte te verminder. Die doelwit vir
die projek is tweeledig: (1) om die golfoorslagtempo van terugkaatsmure te vergelyk met dié van ‘n
vertikale muur sonder ‘n terugkaatsbalk; en (2) om die invloed van die terugkaatsmuur se
oorhanglengte op die golfoorslagtempo te bepaal.
Om bogenoemde doelwitte te bereik, is fisiese modeltoetse in ‘n golfkanaal, wat met ‘n suiertipe
golfopwekker toegerus is en wat aktiewe golfabsorbering toepas, uitgevoer. Hierdie toetse is op drie
verskillende seemuurprofiele, naamlik ‘n vertikale muur en ‘n terugkaatsmuur met ‘n kort en lang
oorhang, genaamd “Recurve 1” en “Recurve 2” onderskeidelik, uitgevoer. Die muurhoogte, die
seebodemhelling asook die golfhoogte en –periode is tydens al die toetse konstant gehou. Vir elke
profiel is toetse by 5 verskillende watervlakke vir beide brekende en ongebreekte golwe uitgevoer.
Uit die toetsresultate is dit duidelik dat terugkaatsmure meer effektief as vertikale mure is om
golfoorslag te beperk. Die vermindering van golfoorslag kan tot 100% wees, afhangende van die
vryboord en golftoestande.
Daar is bevind dat “Recurve 2” golfoorslag die effektiefste verminder. In die geval van hoë vryboord
(lae watervlak by die toon van die struktuur) is daar egter gevind dat “Recurve 1” en “Recurve 2” die
iv
Stellenbosch University
golfoorslag feitlik ewe goed beperk. Dit is die geval aangesien alle water van die brekende golwe
weerkaats word. In die geval van ‘n lae vryboord, word die voordeel van die terugkaatsmuur
teengewerk deurdat daar ‘n kleiner verskil in golfoorslagtempo’s tussen die drie profiele is.
‘n Grafiek is voorgelê wat wys dat die lengte van die terugkaatsmuur se oorhang golfoorslag beperk. ‘n
Groter oorhanglengte van die terugslagmuur veroorsaak ‘n groter vermindering in golfoorslag. Vir
gevalle met ‘n hoë vryboord, is daar egter gevind dat die oorhanglengte van die terugslagmuur minder
belangrik is. Hierdie grafiek gee ontwerpers ‘n aanduiding van hoe terugslagmure ontwerp kan word
met ‘n lae hoogte terwyl ‘n lae oorslagtempo behou word.
Die gebruik van terugslagmure bied ‘n aanpassing vir die probleme van seevlakstyging, as gevolg van
klimaatverandering.
v
Stellenbosch University
Acknowledgements
First and foremost I would like to express gratitude to my study supervisor, Mr. Geoff Toms, for his
support and guidance throughout my thesis.
In addition, I would like to thank Mr. K. Tulsi from the CSIR, for his advice and suggestions regarding
the physical model tests.
Without the help of the staff at the Hydraulic Laboratory at the University of Stellenbosch this project
would truly not have been possible. My sincerest thanks to Mr C. Visser, Mr N. Combrinck, Mr J.
Nieuwoudt and Mr A. Lindoor. Thanks also to Mr L. Rabie, a masters student, who volunteered to help
in the laboratory.
Last, but not least, I would like to thank my family for their love and support throughout my studies.
vi
Stellenbosch University
Table of Contents
Page
Declaration ....................................................................................................................................................... i
Abstract ............................................................................................................................................................ ii
Opsomming .................................................................................................................................................... iv
Acknowledgements ........................................................................................................................................ vi
Table of Contents .......................................................................................................................................... vii
List of figures ................................................................................................................................................. ix
List of tables ................................................................................................................................................... xi
List of symbols and acronyms ...................................................................................................................... xii
Chapter 1: Introduction ................................................................................................................................... 1
1.1
Background ....................................................................................................................................... 1
1.2
Objective ........................................................................................................................................... 3
1.3
Definitions ........................................................................................................................................ 3
1.4
Brief Chapter overview .................................................................................................................... 4
Chapter 2: Literature Review ......................................................................................................................... 5
2.1
General .............................................................................................................................................. 5
2.2
Defining overtopping and its safety limits ...................................................................................... 5
2.3
Review of design guidance for recurve seawalls ........................................................................... 6
2.3.1
Early studies............................................................................................................................ 7
2.3.2
Japanese studies ...................................................................................................................... 9
2.3.3
CLASH project ..................................................................................................................... 10
2.3.4
Recent studies ....................................................................................................................... 15
2.4
Examples of recurve type seawalls ............................................................................................... 19
2.5
Physical modelling in wave overtopping studies ......................................................................... 26
2.5.1
Scale and laboratory effects ................................................................................................. 26
2.5.2
Wave overtopping laboratory measurement methods ........................................................ 31
2.5.3
Test duration ......................................................................................................................... 32
2.5.4
Wave spectra ......................................................................................................................... 33
2.6
Conclusions..................................................................................................................................... 34
Chapter 3: Physical model tests ................................................................................................................... 36
3.1
Scope of model tests....................................................................................................................... 36
vii
Stellenbosch University
3.2
Test facility ..................................................................................................................................... 36
3.3
Model set-up ................................................................................................................................... 37
3.4
Model scale ..................................................................................................................................... 45
3.5
Test procedure ................................................................................................................................ 45
3.6
Test duration ................................................................................................................................... 46
3.7
Data acquisition .............................................................................................................................. 46
3.8
Test conditions and schedule ......................................................................................................... 47
3.9
Repeatability and accuracy ............................................................................................................ 48
3.10
Sensitivity runs .......................................................................................................................... 48
Chapter 4: Results ......................................................................................................................................... 49
4.1
General ............................................................................................................................................ 49
4.2
Results ............................................................................................................................................. 49
Chapter 5: Analysis and discussion ............................................................................................................. 57
5.1
Introduction..................................................................................................................................... 57
5.2
Measured test results ...................................................................................................................... 57
5.2.1
Repeatability and accuracy of tests ..................................................................................... 62
5.2.2
Sensitivity of overtopping rates to wave period ................................................................. 67
5.3
Comparison of measured results with EurOtop calculation tool ................................................. 68
5.4
Other considered factors ................................................................................................................ 74
5.4.1
Safety evaluation for pedestrians, vehicles and buildings ................................................. 74
5.4.2
Additional factors to be considered ..................................................................................... 77
5.5
Applicability of results to a case study ......................................................................................... 77
Chapter 6: Conclusion and recommendations ............................................................................................. 81
6.1
General ............................................................................................................................................ 81
6.2
Findings from literature review ..................................................................................................... 81
6.3
Findings of physical model tests ................................................................................................... 82
6.4
Conclusions..................................................................................................................................... 83
6.5
Recommendations for further research ......................................................................................... 83
References ..................................................................................................................................................... 85
Appendix A ................................................................................................................................................... 89
viii
Stellenbosch University
List of figures
Page
Figure 1: Typical behaviour of recurve and vertical seawall ...................................................................... 2
Figure 2: Classification of recurves .............................................................................................................. 3
Figure 3: Definition sketch ............................................................................................................................ 4
Figure 4: Proposed recurve profile by Berkeley-Thorn and Roberts (1981) ............................................. 7
Figure 5: Proposed profile of the Flaring Shaped Seawall .......................................................................... 9
Figure 6: FSS with vertical wall to reduce water spray ............................................................................. 10
Figure 7: High and low free board cases .................................................................................................... 12
Figure 8: Decision chart for design guidance of recurve walls ................................................................. 13
Figure 9: Parameter definition sketch ......................................................................................................... 13
Figure 10: EurOtop calculation tool: schematisation of vertical wall ....................................................... 14
Figure 11: EurOtop calculation tool: schematisation of recurve wall ....................................................... 14
Figure 12: Recurve wall at shoreline ........................................................................................................... 16
Figure 13: Recurve wall positioned seawards of shoreline ........................................................................ 16
Figure 14: Wave return wall on a smooth dike ........................................................................................... 17
Figure 15: Overtopping results for wave return wall of 5 cm with different parapet angles β ................ 18
Figure 16: Wave overtopping of vertical seawall, parapet wall and recurve wall .................................... 19
Figure 17: Recurve wall in Abu Dhabi, United Arab Emirates ................................................................. 19
Figure 18: High recurve seawall at Sandbanks Peninsula southwest of Bournemouth, Dorset, United
Kingdom ........................................................................................................................................................ 20
Figure 19: Stepped seawall with recurve at Burnham-on-Sea, Somerset, United Kingdom ................... 20
Figure 20: Seawall at St. Mary's Bay, United Kingdom ............................................................................ 21
Figure 21: Recurve seawall with rock armour at Scarborough, United Kingdom .................................... 21
Figure 22: Recurve seawall near Dymchurch, United Kingdom ............................................................... 22
Figure 23: Recurve seawall at Kailua-Kona, Hawaii ................................................................................. 22
Figure 24: Another recurve type seawall at Kailua-Kona, Hawaii ............................................................ 23
Figure 25: Recurve seawall at Ocean Beach, San Francisco, CA, USA ................................................... 23
Figure 26: Construction of the Flaring Shaped Seawall (FSS) in Kurahashi-jima, Hiroshima, Japan... 24
Figure 27: FSS at Kurahashi-jima, Hiroshima, Japan ................................................................................ 24
Figure 28: Recurve wall in Cape Town, South Africa ............................................................................... 25
Figure 29: Damaged recurve wall in Strand, South Africa ........................................................................ 25
ix
Stellenbosch University
Figure 30: Typical cross-section of battered seawall.................................................................................. 29
Figure 31: Full scale test at Ostia, Italy ....................................................................................................... 30
Figure 32: Overtopping tank suspended from load cell.............................................................................. 32
Figure 33: JONSWAP spectrum .................................................................................................................. 33
Figure 34: Comparison of the JONSWAP and Pierson-Moskowitz spectra ............................................. 34
Figure 35: Seawall profiles with 3 different overhang lengths (model dimensions in mm) .................... 37
Figure 36: Recurve structure with bed slopes ............................................................................................. 38
Figure 37: Irregularities in built-in slope..................................................................................................... 40
Figure 38: Recurve 2 profile ........................................................................................................................ 41
Figure 39: Schematisation of layout behind the structure to collect overtopped water............................ 41
Figure 40: Waterproof plastic to guide water into overtopping container ................................................ 42
Figure 41: Weighed bin outside the flume .................................................................................................. 42
Figure 42: Measuring needle and pump in overtopping container ............................................................ 43
Figure 43: Sheets to prevent water from splashing out of the flume ......................................................... 43
Figure 44: Calculating the allowable frequency range in HR DAQ .......................................................... 44
Figure 45: Probe spacing .............................................................................................................................. 44
Figure 46: Screenshot of the EurOtop Calculation tool for wave overtopping (vertical wall) ................ 50
Figure 47: Screenshot of EurOtop calculation tool (Recurve) ................................................................... 51
Figure 48: Recurve 1 during model testing ................................................................................................. 56
Figure 49: Recurve 2 during model testing ................................................................................................. 56
Figure 50: Graph displaying all test results ................................................................................................. 58
Figure 51: Graph showing average measured data ..................................................................................... 59
Figure 52: The influence of the overhang length on mean overtopping rate ............................................ 61
Figure 53: Influence of wave period on overtopping results...................................................................... 67
Figure 54: Comparison of measured and calculated overtopping rates for vertical wall ......................... 69
Figure 55: Comparison of measured and calculated overtopping rates for Recurve 1 ............................. 70
Figure 56: Comparison of measured and calculated overtopping rates for Recurve 2 ............................. 71
Figure 57: Vertical wall: predicted versus measured overtopping rates ................................................... 72
Figure 58: Recurve 1: predicted versus measured overtopping rate .......................................................... 73
Figure 59: Recurve 2: predicted versus measured overtopping rate .......................................................... 74
Figure 60: Current recurve wall in Strand ................................................................................................... 78
Figure 61: Example of how to apply results of this project in case study ................................................. 80
x
Stellenbosch University
List of tables
Page
Table 1: Allowable or tolerable overtopping rates ...................................................................................... 6
Table 2: Description of symbols used in calculation tool ......................................................................... 15
Table 3: Values of geometry parameters .................................................................................................... 17
Table 4: Scale ratios of the Froude law ...................................................................................................... 27
Table 5: Typical beach slopes along the South African coast................................................................... 38
Table 6: Applicable scale used .................................................................................................................... 45
Table 7: Test series and conditions (prototype) ......................................................................................... 48
Table 8: Results of series A – Vertical wall ............................................................................................... 52
Table 9: Results of series B – Recurve 1 .................................................................................................... 53
Table 10: Results of series C – Recurve 2 ................................................................................................... 54
Table 11: Results of series D – Wave period sensitivity ............................................................................ 55
Table 12: Reduction in overtopping due to Recurve 1 and 2 ..................................................................... 60
Table 13: Repeated tests of series A ............................................................................................................ 63
Table 14: Repeated tests of series B ............................................................................................................ 63
Table 15: Repeated tests of series C ............................................................................................................ 64
Table 16: Repeated tests of series D ............................................................................................................ 64
Table 17: Measured Hmax and H 2% .............................................................................................................. 66
Table 18: Summary of average prototype overtopping rates ..................................................................... 75
Table 19: Summary of used parameters ...................................................................................................... 78
Table 20: Results for case study calculations .............................................................................................. 80
xi
Stellenbosch University
List of symbols and acronyms
B
Height of FSS (m)
Br
Width of seaward overhang in front of main vertical wall (m)
CoV
Coefficient of variation (%)
EL
Wave level (m)
FSS
Flaring Shaped Seawall
g
Gravitational acceleration (m/s2)
H
Local wave height (m)
h
Water depth at the toe of the structure (m)
H2%
Wave height exceeded by 2% of waves (m)
hc
Critical crest elevation of FSS (m)
Hi
Incident wave height (m)
Hm0
Spectral significant wave height (m)
Hmax
Maximum wave height in the wave train (m)
hn
Height of nose (m)
hr
Height of recurve wall section at top of vertical wall (m)
Hr
Reflected wave height (m)
Hs
Significant wave height (m)
hs
Water depth at the toe of the structure (m)
ht
Height of wave return wall on dike (m)
hw
Height of vertical wall on FSS (m)
k
Effective recurve factor
k’
adjusted k-factor
Kr
Bulk reflection coefficient
LLD
Land Levelling Datum
xii
Stellenbosch University
MSL Mean Sea-Level
Pc
Height of vertical wall section from still water-level to bottom of recurve (m)
q
Overtopping rate (l/s per m)
Rc
Freeboard (m)
SLR
Sea-Level Rise
SWL Still Water-level
T
Wave period (s)
Tp
Peak wave period (s)
α
Angle of recurve (ᴼ)
β
Parapet nose angle (ᴼ)
ɣ
JONSWAP enhancement factor
µ
Average
λ
Dimensionless height of the wave return wall’s nose
σ
Standard deviation
xiii
Stellenbosch University
Chapter 1: Introduction
1.1 Background
Wave overtopping occurs when wave action discharges water over the crest of a coastal structure.
Coastal structures protect infrastructure (walkways, roads, buildings and land) as well as humans
(especially pedestrians) from the impacts of the coastal environment. The crest height of coastal
structures is often determined by the allowable wave overtopping during extreme conditions measured
in litres per second per metre (l/s per m).
Apart from waves, water-level is an important parameter when considering overtopping. Due to climate
change and its concomitant rise in sea level, deeper water occurs next to existing coastal structures.
Consequently, coastal engineers are confronted with higher wave heights, which result in an increase in
wave overtopping. The levels of land and infrastructure safety behind coastal structures are thus
compromised. Raising the crest height of existing coastal structures is one possible solution to this
problem.
However, the view of the ocean can be obstructed and access to the beach denied when the crest height
of coastal structures, particularly a seawall at the back of the beach, is raised. An obstructed view and
lack of access can have a negative impact on a beach's appeal as a tourist attraction. An alternative
solution is to incorporate recurves into seawall design. The main advantage of recurve seawalls is that
their crest height can be lower than that of vertical walls to allow for the same wave overtopping rates.
A recurve is a form of seaward overhang of a seawall, designed to reduce wave overtopping. Seaward
overhangs are also known as a parapet, bullnose, wave return wall or a recurve. Although there are
certain distinctions between the different types of overhangs, hereafter the term recurve will
collectively be used.
The seaward overhang of a recurve wall deflects uprushing water seawards. When no seaward
overhang is present as in the case of a vertical wall, water splashes vertically upwards and over the wall
during wave impact. Wind can increase overtopping rates by blowing the uprushing water landwards.
Therefore, recurve walls are often incorporated into seawall design in order to reduce wave
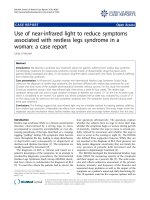
overtopping. Figure 1 shows the typical behaviour of a recurve and vertical seawall as described above.
1
Stellenbosch University
Figure 1: Typical behaviour of recurve and vertical seawall
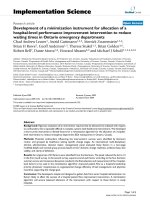
Recurve walls can primarily be classified into three categories; namely: Type 1: large recurves, Type 2:
small recurves; and Type 3: recurves on a vertical wall (Allsop, 2013). A large recurve is defined as a
wall where the recurve forms the major part of the wall, as illustrated in Figure 2(a). A small recurve is
defined as a wall where the recurve is a minor construction on part of the wall; for example, a curve
added to a small wall on top of a rock berm or dike, Figure 2(b). The third type of recurve wall is
characterised by a recurve sited at the top of a vertical seawall, as seen in Figure 2(c).
At the back of some beaches along the coast of South Africa, for example, Strand in False Bay, vertical
seawalls serve as landward protection from the impacts of overtopping. A sea wall should not obstruct
the view of the sea as beaches in South Africa are important for recreation and as tourist attractions.
With sea-level rise resulting in an increase in wave overtopping, a possible solution will be to
incorporate recurves into seawall design to reduce overtopping. By reducing overtopping, the raising of
the crest height of the seawalls can be limited and, in turn, the possible obstruction of the view from the
walkway to the beach, can be avoided.
This study focuses on the use of recurves at the top of a vertical seawall (Type 3; Figure 2(c)) to
address the predicted increase of wave overtopping rates at the back of beaches due to sea-level rise.
There are other possible solutions to limit wave overtopping, such as rubble slopes against seawalls and
offshore breakwaters. However, these solutions are not included within the scope of this study. The
forces on the recurve wall are also not considered and investigated within this project.
2
Stellenbosch University
Figure 2: Classification of recurves
Although recurves are often incorporated into seawall design, literature offers little design guidance for
recurve walls, as discussed in Chapter 2. The earliest studies on recurve seawall design propose
overtopping reduction factors. Using these reduction factors, the overtopping rate for a recurve wall can
be adjusted to calculate the required crest level with existing overtopping formulas for vertical walls.
Design guidance on the shape of recurve walls is based on limited research. Existing studies did not
specifically investigate the use of recurve walls at the back of a beach nor the optimal recurve profile,
to reduce overtopping. According to the literature, no systematic studies have been performed to test
the influence of the recurve seawall overhang length in reducing overtopping.
1.2 Objective
This project aims to explore the use of a recurve at the top of a vertical seawall (Type 3) to reduce
overtopping. The specific objectives are to:
Compare overtopping rates for a vertical seawall and a recurve seawall
Determine the influence of the length of the recurve overhang in reducing overtopping
Although different lengths of recurve overhangs are tested, it is not the objective of this project to
provide comprehensive design guidelines.
1.3 Definitions
For the purpose of this study, a recurve wall is defined as a vertical, impermeable seawall with a curved
or straight seaward overhang sited at the top of the seawall. The recurve wall is situated at the back of a
beach. Figure 3 illustrates the case as defined for this project.
3
Stellenbosch University
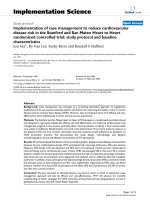
The freeboard of a structure (Rc) is defined as the vertical distance between the water-level (EL) and
the crest level of the structure, Figure 3. The wave heights for the two levels (H1 and H2) are indicated
for each water-level (EL1 and EL2). In addition, Figure 3 presents the geometric parameters of a
recurve; height (hr), overhang length (Br), and angle (α), as defined for this project.
Beach
Figure 3: Definition sketch
1.4 Brief Chapter overview
The report consists of six chapters, including the current chapter. Chapter 2, the literature review, aims
to review available research on recurve seawall design. Within the chapter, proposed recurve profiles in
existing literature are collected and reviewed. The literature review also includes research on physical
model testing of wave overtopping.
Chapter 3 describes the scope of the physical model tests and outlines the methodology followed to
perform the tests.
Chapter 4 presents the results of all the performed physical model tests, whereas in Chapter 5 these
results are analysed and presented as graphs. In addition, these graphs are interpreted and discussed.
The report concludes with Chapter 6, in which the conclusions of the project are given and
recommendations regarding future research are made.
4
Stellenbosch University
Chapter 2: Literature Review
2.1 General
The literature review presents research that forms the basis of this study, and aims to give insight into
overtopping studies and the physical modelling of recurve walls. Examples of constructed recurve
walls are also included.
2.2 Defining overtopping and its safety limits
Overtopping can occur in three different modes (EurOtop, 2007). The first mode of overtopping is
referred to as the “green water overtopping case”, which occurs when wave run-up levels are high
enough for water to flow over the crest of the coastal structure. Thus, EurOtop (2007) defines green
water overtopping as “a continuous sheet of water that passes over the crest”.
The second type of overtopping, “splash water overtopping”, takes place as waves break on the
structure and significant volumes of splash passes over the crest of the structure. The splash water
passes over the wall due to either the momentum of the water or the effect of an onshore wind
(EurOtop, 2007).
The third and least troublesome type of overtopping occurs when water passes over the crest of a
structure as spray. This spray is produced by wind action on wave crests and is usually not significant
to the total overtopping volume in spite of strong winds (EurOtop, 2007). Wind effects are not included
within the scope of this project. Consequently, only the first two modes of overtopping are considered.
Studies have investigated the allowable overtopping rates for certain safety conditions. As this project
focuses on the overtopping of a seawall at the back of a beach, the allowable mean overtopping rates
(q) for the conditions applicable to this study only, are presented in Table 1 (CIRIA, et al., 2007);
(EurOtop, 2007).
5
Stellenbosch University
Table 1: Allowable or tolerable overtopping rates
Mean
overtopping rate
q (l/s per m)
Pedestrians
Unsafe for unaware pedestrians, no clear view of the sea, relatively easily q ˃ 0.03
upset or frightened, narrow walkway or proximity to edge
Unsafe for aware pedestrians, clear view of the sea, not easily upset or q ˃ 0.1
frightened, able to tolerate getting wet, wider walkway
Unsafe for trained staff, well shod and protected, expected to get wet, q ˃ 1 - 10
overtopping flows at lower levels only, no falling jet, low danger of fall from
walkway
Vehicles
Unsafe for driving at moderate or high speed, impulsive overtopping giving q ˃ 0.01 - 0.05
falling or high velocity jets
Unsafe for driving at low speed, overtopping by pulsating flows at low q ˃ 10 - 50
levels only, no falling jets
Buildings and infrastructure
No damage
q ˃ 0.001
Minor damage to fitting etc.
0.001 ˂ q ˂ 0.03
Structural damage
q ˃ 0.03
Damage to grassed or lightly protected promenade behind seawall
q ˃ 50
Damage to paved or armoured promenade behind seawall
q ˃ 200
(CIRIA, et al., 2007); (EurOtop, 2007)
2.3 Review of design guidance for recurve seawalls
Recurves have often been included in seawall design to reduce overtopping in the past. Even though
designers often include recurves, little design guidance on the shape of seaward overhangs exists. This
section of the literature review focuses on the review of recurve design aspects and the examination of
recurve wall profiles.
6
Stellenbosch University
2.3.1
Early studies
Physical model tests of the Kent Northern seawall in the United Kingdom (UK), were conducted in an
early study by Berkeley-Thorn and Roberts (1981). Berkeley-Thorn and Roberts (1981) propose a
recurve profile, Figure 4, to be sited at the crest of a sloped seawall (Type 2). The physical model of the
Kent Northern seawall was tested under severe conditions where the wave wall crest height was less
than the tested wave crest elevation. The model recurve seawall proved to be ineffective in these severe
conditions. However the study concluded that recurve walls are more effective under less severe
conditions and far superior to vertical seawalls (Berkeley-Thorn & Roberts, 1981).
Figure 4: Proposed recurve profile by Berkeley-Thorn and Roberts (1981)
(Besley, 1999)
Owen and Steele (1991) undertook physical model tests and proposed a design method whereby wave
overtopping discharges of recurve wave return walls can be estimated. The model tests were performed
with the same profile (Type 2) as proposed by Berkeley-Thorn and Roberts (1981). Owen and Steele
(1991) suggest that this proposed profile is probably one of the most effective recurve profiles, because
the water is deflected seawards at a very shallow angle above the horizontal. Overtopping reduction
factors for recurve seawalls were also proposed. It was found that the height of the recurve wall, as well
as the discharge incident on the recurve wall were the primary factors influencing the wall's
overtopping performance.
7
Stellenbosch University
The United States of America (US) Army Corps of Engineers (1991) found in a study that a recurve
wall significantly reduces overtopping. This study was undertaken to determine the effectiveness of a
parapet at the top of a riprap protected embankment (Type 2) to reduce overtopping. Vertical parapets
with different heights, as well as a recurve wall were tested. The US Army Corps of Engineers (1991)
conclude that the recurve wall proves to be surprisingly effective as their results indicate that the
overtopping rates over the recurve wall are only about 9 percent of the rates for a vertical parapet. The
study suggests that the recurve wall may be successful because the riprap significantly reduces the
intensity of the wave uprush once the water reaches the recurve wall above the water line on the berm.
Herbert et al. (1994) conducted a study to quantify the overtopping performance of recurve and vertical
seawalls on a sloped seawall (Type 2) by using physical model tests. The study only used the proposed
recurve profile of Berkeley Thorn & Roberts (1981) for the tests even though a wide range of profiles
have been built along the UK coastline. The model tests show that the effectiveness of the recurve wall
performance is dependent on the height of the recurve wall relative to the still water-level (freeboard).
The results indicate that a recurve wall can significantly reduce overtopping compared to a case with no
recurve wall.
A study by Franco et al. (1994) researched wave overtopping of vertical and composite breakwaters,
including recurve and vertical parapets at the top of caisson breakwaters (Type 3). The physical model
test results show that the crest of the recurve seawall can be lowered by 30 % to get the same
overtopping rate for a vertical seawall without a recurve. However Franco et al. (1994) states that this
is only applicable to relatively small overtopping rates.
The UK Environmental Agency Overtopping Manual (Besley, 1999) is a compilation and summary of
previous research on overtopping performance of seawalls. This manual was intended to offer
guidelines to flood and coastal engineers for the assessment of existing coastal structures and the
design of new seawalls. Besley (1999) presents the reduction factors as proposed by Owen and Steele
(1991). In addition, Besley (1999) claims that the recurve profile as proposed by Berkeley-Thorn and
Roberts (1981), Figure 4, is very efficient and that alternative profiles may be significantly less
effective.
8
Stellenbosch University
2.3.2
Japanese studies
Different profiles for a non-wave overtopping seawall were researched in Japan. Kamikubo et al.
(2000) recommend a non-wave overtopping seawall which has a deep circular cross-section, named the
Flaring Shaped Seawall (FSS), Figure 5. The FSS (Type 1) was recommended as this profile has the
lowest vertical uplift force and the lowest wave pressure. The FSS was compared with a conventional
vertical seawall using physical model tests. These tests indicated that the crest elevation of the FSS can
be lower than the conventional vertical seawall as it limits wave overtopping more effectively.
However, the measured wave pressures were found to be very high on the portion above the still water
surface.
Kamikubo et al. (2003) later extended the research of the proposed non-wave overtopping seawall,
looking particularly at the Flaring Shaped Seawall (FSS). The non-overtopping FSS has a significantly
lower crest height compared with a conventional wave absorbing vertical seawall. This study proposes
to include a vertical wall at the tip of the FSS to effectively reduce water spray, Figure 6. The FSS
weakness is that the shape is difficult to form in reinforced concrete as there is not sufficient cover for
reinforcement in the slender parts at the crest and at the base (Kortenhaus, et al., 2003). However, this
recurve profile has been built in Japan, Figures 26 and 27.
Symbol
Description
B
Seawall height (m)
h
Water depth in front of seawall (m)
hc
Critical crest elevation (m)
hw
Height of vertical wall (m)
H0
Incident wave height (m)
Figure 5: Proposed profile of the Flaring Shaped Seawall
(Kamikubo, et al., 2003)
9
Stellenbosch University
Figure 6: FSS with vertical wall to reduce water spray
(Kamikubo, et al., 2003)
2.3.3
CLASH project
The European Union (EU) funded CLASH project (Crest Level Assessment of coastal Structures by
full scale monitoring, neural network prediction and Hazard analysis on permissible wave overtopping)
was a collaborative study between several European countries: Belgium, Germany, Denmark, Spain,
Italy, the Netherlands and the United Kingdom. The need for the study originated from two
observations (De Rouck, et al., 2005):
“(1) The proven fact that small scale model testing under predicts wave run-up on rough slopes;
(2) The lacking of generally applicable prediction methods for crest height design or
assessment with respect to wave overtopping.”
Two overall CLASH objectives were developed from these two observations. The first objective was to
validate the present design methods by using full scale monitoring of wave overtopping, small scale
laboratory modelling, and numerical modelling, in order to solve the issue of scale effects and possible
underpredictions. The second objective was to use numerous available data sets on overtopping to
develop a generally applicable design method (De Rouck, et al., 2005).
From the CLASH study, De Rouck et al. (2005) found that the number of waves generated per test has
an influence on the average wave overtopping measurements. A comparison of overtopping results
10
Stellenbosch University
from tests using 200 waves with tests using 1000 waves, showed a 20% difference in mean overtopping
results.
Further studies by Kortenhaus et al. (2003) and Pearson et al. (2004) were partly facilitated by the
CLASH collaboration.
According to a study by Kortenhaus et al. (2003), parapet and recurve seawalls have often been
incorporated into seawall design, even though no general design guidance has been available. This
study proposes a reduction factor for wave overtopping of parapet and Type 3 recurve seawalls which
is dependent on the geometrical profile. Earlier studies of recurve walls have mostly been investigated
by case studies and only a few generic investigations have been conducted.
Wave energy can be deflected completely with a relatively high crest freeboard. However, it was found
that with a lower freeboard, or in many high wave conditions, overtopping is not effectively reduced
and that the wall shape had no significant effect compared with a conventional seawall (Kortenhaus, et
al., 2003). Figure 7 illustrates a high freeboard (Rc1) and a low freeboard case (Rc2).
According to Kortenhaus et al. (2003) a recurve wall is most effective when the shape of the recurve,
together with the freeboard, prevents green water from overtopping the seawall. With larger relative
freeboards, the wave energy is completely deflected seawards away from the wall. Lower freeboards
and/or higher waves prevent wave energy from being fully deflected and therefore the recurve wall is
no longer effective, resulting in large overtopping. When a recurve wall is small, the influence of a
recurve is relatively small on green water overtopping.
As Pearson et al. (2004) states, it is surprising that with such a long history of the design of recurve
walls, very few systematic studies on, and even less generic guidance for the incorporation of recurve
walls into seawall design exists. To address this shortcoming Pearson et al. (2004) formulates generic
guidance for the crest level design of recurve walls (Type 3).
In Kortenhaus et al. (2003) a generic method for the prediction of the reduction in overtopping of
recurve walls was proposed. The reduction was quantified with a reduction factor, the so-called kfactor. The k-factor is defined as follows:
11