Đánh giá sự biến đổi của một số gen mã hóa enzyme chuyển hóa xenobiotics ở nam giới vô sinh tt tiếng an
Bạn đang xem bản rút gọn của tài liệu. Xem và tải ngay bản đầy đủ của tài liệu tại đây (327.39 KB, 27 trang )
MINISTRY OF EDUCATION
MINISTRY OF HEALTH
HANOI MEDICAL UNIVERSITY
VU THI HUYEN
EVALUATE THE VARIABILITY OF SOME GENES
ENCODING XENOBIOTIC METABOLISM IN
INFERTILE MEN
Specialization : Biomedical - Genetic
Code
: 62720111
SUMMARY OF DOCTORAL DISSERTATION
HANOI - 2019
THIS STUDY WAS COMPLETED IN:
HANOI MEDICAL UNIVERSITY
Spervisor: 1. Assoc. Prof. MD. Tran Duc Phan
2. PhD. Nguyen Thi Trang
Reviewer 1: Assoc. Prof. MD. Phan Thi Hoan
Reviewer 2: Assoc. Prof. MD. Tran Van Khoa
Reviewer 3: Assoc. Prof. MD. Nguyen Nam Thang
The thesis will be defended before the Examining Board at
university level in Hanoi Medical University
At …….. o’clock……… Date ……. Month ……. Year…
This thesis could be found at
- National Library
- Centre Medical Information Library
1
INTRODUCTION
Infertility is a pathological condition that tends to increase. There
are many causes of male infertility. The important basis of infertility
treatment involves diagnostic procedures that allow discovering its
reason and introducing effective treatment.
A xenobiotics are non-biotic substances that are usually naturally
produced. Xenobiotics metabolism disorders can lead to increased
production of free radicals and the risk of male infertility.
In humans, CYP1A1, NAT2, and GSTP1 are genes that regulate
antioxidant enzymes. The gene mutation can lead to dysfunction of
detoxifying enzymes leading to chronic diseases, including male
infertility, cancer. In Vietnam, there are no studies evaluating the
effects of these three genes in male infertility patients, so we
conducted this study with two objectives:
1. Determine the nucleotide mutations of CYP1A1, NAT2, and
GSTP1 genes in primary male infertile.
2 Analysis of the relationship between the common nucleotid
variants of CYP1A1, NAT2, GSTP1 genes with male infertility.
New finding of the thesis:
This is the first study in Vietnam using ARMS-PCR
technique to determine polymorphisms of CYP1A1, NAT2 and
GSTP1 genes: CYP1A1 2455A>G, NAT2 481C>T, NAT2 590G>A,
GSTP1 313G>A, GSTP1 341C>T were higher in the infertile group
than in the control group.
The study found that CYP1A1 2455A>G genotype AG
increased the risk of male infertility 4.09 times, polymorphism NAT2
481C>T (rs1799929), CT genotype increased the risk of male
infertility by 4.1 times, polymorphism NAT2 590G>A (rs1799930)
genotype GA increased the risk of male infertility by 3.3 times,
GSTP1 313G>A increased the risk of male infertility by 3.25 times,
GSTP1 polymorphism 341C>T (rs1138272), CT genotype increased
the risk of male infertility 6.9 times. Combining 2 polymorphisms
GSTP1 and NAT2 or CYP1A1 and NAT2 or GSTP1 and CYP1A1
2
increased the risk of infertility than only one polymorphism. In this
research, we found that the gene polymorphic complexes of male
infertility in Vietnam include: Gene polymorphisms combination
[GSTP1 (341C> T); NAT2 (590G> A); CYP1A1 (2455A> G)] or
[GSTP1 (341C> T); CYP1A1 (2455A> G); NAT2 (481C> T)]
expression of additive interaction, but [NAT2 (590G> A); CYP1A1
(2455A> G)] or [CYP1A1 (2455A> G)]; NAT2 (481C> T)] is a
complementary interaction. Using oxysperm kit, we found that
infertile men with mutations in the xenobiotics metabolism are 29.87
times increased risk of oxidative stress than those who do not.
The structure of the thesis:
The thesis included 122 pages with 27 tables, 21 figures and 1
graphs, 193 references, of which 178 are in English and 15
Vietnamese. Thesis structure including 2 pages introduction, 39 page
overview, 20 page object and methodology, 26 page results, 32 page
discussion, 3 page conclusions and recommendations.
Chapter 1
OVERVIEW
1.1. Infertility and male infertility
According to the WHO, infertility is found in 12% -15% of
reproductive age couples, equivalent to 50-80 million people in the
world. There are still cases unknown reason infertility.
Today, environmental problems, toxic chemicals and stress have
also increased the rate of infertility and become a matter of concern.
1.2. The causes of male infertility
1.2.1. Genetic causes
1.2.1.1. Cyto- genetic causes
Numeral and structural chromosomal abnormalities including
autosme and X/Y chromosome, especially, Klinerfelter syndrome.
These abnormalities reduce the reproductive process resulting in
malformation of male reproductive function.
3
1.2.1.2. Molecular genetic causes
Base on the development of molecular biology, the causes of male
infertility at the molecular level have also been discovered. They are
micro-deletion of Y chromosome (deletation of AZF locus), DNA
sperm fragmentation, polymorphisms such as CFTR, AR, Kallmann's
syndrome, folate metabolism, metabolism of xenobiotics.
1.2.2. Biochemical causes
Fructose, zinc, phosphatase, and citric acid have been shown to
play an important role in sperm motility, morphology and density.
1.2.3. Endocrine causes
GnRH, GH, Testosterone, Inhibin participate in the process of
sperm establist as well as the differentiation and development of
sperm.
1.2.4. Pathology affects male fertility
The common diseases that affect the number and quality of sperm
are: varicocele, testicular inflammation, testicular cancer, systemic
diseases, infections ...
1.2.5. Age of reproduction
Studies have shown that the higher the age, the less number sperm
decreases.
1.2.6. Environment
The most common environmental factors causing male infertility
are heavy metals, cigarette smoke, ethylene dibromide, chromium,
ethylene dibromide, pesticides, dioxin... These agents inhibit the
growth of sperm reducing, density and mobility of sperm reducing.
1.3. Xenobiotics and the metabolism of xenobiotics in the body
Xenobiotics are chemicals that are not produced by the organism,
which, if not metabolized and excreted by the body, will cause
increasing free radicals, which oxidize the molecule, and causes
DNA to mutate. And causing diseases including infertility in men.
1.4. Genes coding for the enzyme metabolize xenobiotics primarily
1.4.1 CYP1A1 gene
4
In the cytochrome P450 system, CYP1A1 is the major enzyme
responsible for the metabolism of aromatic hydrocarbons, heterocyclic
amino acids. If this metabolism is not good leads to increased free
radicals causing DNA changes leading to infertility in men.
CYP1A1 is a gene on the 15th chromosome (15q24.2-4) consist of
6,069 base pairs, 7 exons and 6 introns. CYP1A1 Protein has 512
amino acids with 58165 Dalton, it’s plays a major role in phase I
metabolism of xenobiotics.
1.4.2. Gen GSTP1
The GSTP1 gene is located on the longitudinal branch of
chromosome 11 consist of 3066 base pairs, located at 11q13.3. This
enzyme catalyzes the detoxification reaction by binding glutathione,
neutralizing toxic substances, xenobiotics and products of oxidative
stress. The polymorphisms of the GSTP1 gene can cause non-normal
metabolism, causing free radical increasing and causing chronic
diseases including infertility.
1.4.3. Gene NAT2
Located on chromosome 8, there are 2 exons, 1 intron. Protein
encoded by NAT2 has 290 amino acids, molecular weight is 33,542
Dalton. This enzyme participates in phase 2 metabolism of
xenobiotics, primarily active in the acetylation of xenobiotics, which
makes products easily excreted. The common polymorphism of
NAT2 disrupts the detoxification process of the enzyme metabolizing
xenobiotics which leads to male infertility.
Chapter 2
OBJECTIVES AND METHODOLOGY
2.1. Research subjects
2.1.1. Sample size
4C
Sample size is determined by the formula: n
(ln OR)2 pq
Where: p = 0.29 is the frequency of CYP1A1 gene polymorphism,
according to a study by Sena Erdogan Aydes (this study has the
5
smallest p, so the sample size is large). C: Constants are related to
type I and type II errors. Take the value α= 0.05; β = 0.2 then C =
7.85. Replace the values into n = 82.5. In fact, we studied the 170
infertile group and the 170 control group.
2.1.2. Criteria for selecting research subjects
Infertility group: unknown reason infertility male: with
azoospermia or severe oligospermia (<5 million/ml); Reproductive
age; Agree to participate in research.
Control group: Male in reproductive age; Have at least one child.
Agree to participate in the study.
2.1.3. Exclusion criteria
- Male infertility has been identified as a cause: micro-deletion in
Y chromosome, chromosome abnormality, neuromuscular blockage,
varicose veins...
- Men are suffering from acute diseases, mental illness...
- Men suffering from diseases affecting reproductive health.
- Those who do not agree to participate in research.
2.2. Research Methods
2.2.1. Research design
Cross-sectional study.
2.2.2. Research Methods
- Collecting information about family history, self related test results.
- Semen analysis.
- Molecular genetic testing:
Amplification of genes to be studied by ARMS-PCR using
Lytech's CYP1A1, NAT2 and GSTP1 kit, with 35 cycles.
Table 2.2. Cycle of ARMS-PCR reaction
Initial
Denaturation Primer Extension
Final
Forever
Denaturation
Annealing
Extension
1 cycle
o
93 C
1 phút
35 cycle
o
93 C
10 giây
o
64 C
10giây
1 cycle
o
72 C
20 giây
o
72 C
10 phút
4 - 20oC
∞
6
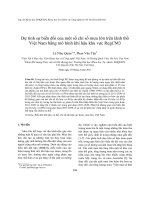
2.2.3.4. Electrophoresis
PCR products were electrophoresed on agarose agar 3%.
Positive
control
Negative
control
1
Patient 1
2
1
Patient 2
2
1
2
Patient 3
Figure 2.2. Results of electrophoresis of PCR
products Notes: 1. Normal primer; 2. Mutation primer.
Patient I: Homozygous normal genotype.
Patient II: Heterozygous genotype.
Patient III: Homozygous mutation.
To verify the results, we electrophoresed automatically, resulting
in similar results to agarose gel electrophoresis.
For example, images of autoimmune heterozygosity would be as
follows:
Figure 2.4. Automatic electrophoresed QSEP100 PCR - product
(heterozygous genotype)
Appears a blue peak between the two blue lines in the normal
primer and the red peak between the two limit lines in the mutation
primer => Patient heterozygouse genotype.
*Verify the results of the ARMS-PCR technique conducted in the
study
7
To verify the results of ARMS-PCR, we conducted the sequencing
of 10 samples, which had results of ARMS-PCR.
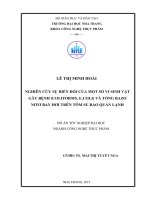
* A technique for assessing the level of oxidative stress in semen
of male infertility patients with gene mutations in xenobiotics using
the Oxisperm kit. There are four color levels as shown below:
Mức 1
2
3
4
Figure 2.6. Measurement of semen
oxygenation
level.
medium low oxidative stress level.
.
high level of oxidative stress.
* The research processing include:
- Make genetic records by using study medical record form.
- Semen analysis.
- Determination of allelic frequencies, genotypes of
polymorphisms of CYP1A1, NAT2, GSTP1 by ARMS-PCR.
2.3. Data analysis
- The data was processed according to the SPSS program 16.0.
• The relative deviation between the heterozygote (He) and
experimental heterozygosity (H0) is calculated by the formula: D =
(H0 - He) / He.
• Identify interactions between genes by two methods:
- Traditional methods for determining interactions between two
genes and methods using MDR software (Ritchie, 2005) to determine
the interaction of multiple genes.
The MDR method can identify combinations of 2, 3, 4, 5... alleles
interaction. The p value in constructing the gene-interaction model
with the n-locus was assessed by the Monte - Carlo test (1000
combinations).
8
Chapter 3
RESEARCH RESULTS
3.1. Compare the results of ARMS-PCR with sequencing
The results determined polymorphic 2455A>G CYP1A1, 481C>T
and 590G>A NAT2 gene, 313G>A and 341C>T GSTP1 gene by
ARMS - PCR has coincided with the results of gene sequencing in 10
research samples.
3.2. Age profiles of infertility and control groups
Table 3.1. Age of infertilily group (n = 170) and control group (n = 170)
Infertility group
Control group
p
Age group
SL
%
SL
%
18 - 24
11
6,5
9
5,3
25 - 34
126
74,1
120
70,6
p>0,05
35 - 44
28
16,5
36
21,2
45 - 50
5
2,9
5
2,9
X ± SD
31,43± 5,548
31,94±5,074
p=0,381
Comment: The mean age of infertility group was 31.43 ± 5.548,
the control group was 31.94 ± 5.074. The average age between the
two groups was not different.
3.3. Gene polymophism CYP1A1, NAT2, GSTP1
Table 3.2. Genotypic distribution and heterozygote values of polymorphisms
in xenobiotics metabolism in the control group
Genotypic Heterozygote χ2 (p)
Gene Polymorphism Genotype distribution
level
n=170 %
H0
He
AA
134 78.8
2.38
CYP1A1
2455A>G
AG
36
21.2 0.212 0.189 (p>0.05)
GG
0
0
CC
136
80
2.38
NAT2
481C>T
CT
34
20 0.211 0.189 (p>0.05)
TT
0
0
GG
126 74.1
3.76
NAT2
590G>A
GA
44
25.9 0.259 0.225 (p>0.05)
AA
0
0
GG
145 85.3
1.07
GSTP1
313G>A
GA
25
14.7 0.147 0.136 (p>0.05)
AA
0
0
CC
156 91.8
0.31
GSTP1
341C>T
CT
14
8.2 0.082 0.079 (p>0.5)
TT
0
0
9
H0 is the level of heterozygosity experiment, He is the degree of
heterozygote theory.
Comment: The polymorphic distribution of the polymorphisms in
the genes studied in the control group follows Hardy-Weinberg's law.
Bảng 3.3. Genotypic distribution and heterozygote values of
polymorphisms in xenobiotics metabolism in the group with male
infertility
Gene
CYP1A1
NAT2
NAT2
GSTP1
GSTP1
Genotypic Heterozygote
Polymorphism Genotype distribution
level
2455A>G
481C>T
590G>A
313G>A
341C>T
n=170
%
AA
78
45.9
AG
89
52.4 0.524
GG
3
1.7
CC
84
49.4
CT
86
50.6 0.506
TT
0
0
GG
71
41.8
GA
91
53.5 0.535
AA
8
4.7
GG
90
52.9
GA
61
35.9 0.359
AA
19
11.2
CC
105
61.8
CT
65
38.2 0.382
TT
0
0
H0
χ2 (p)
He
15.3
0.403 (p<0.05)
19.5
0.378 (p<0.05)
9.88
0.431 (p<0.05)
2.19
0.413 (p>0.05)
9.05
0.309 (p<0.05)
H0 is the level of heterozygosity experiment, He is the degree of
heterozygous theory
Remarks: Except for the 313G>A polymorphism of GSTP1, the
distribution of the remaining genotypes does not follow HardyWeinberg's law. Genotype distribution of 313G> A polymorphism of
GSTP1 gene corresponds to Hardy-Weiberg distribution (p> 0.05).
10
3.3.1. Results of CYP1A1 gene polymorphism
Table 3.4. Genotype analysis results of CYP1A1 polymorphism 2455A> G
(infertility group n = 170, control group n = 170).
CYP1A1
Infertility
Control
OR
95%CI
χ2
(2455A>G) group (%) group (%)
(p)
AA
45.9
78.8
40.26 0.23 0.14-0.37
AG
52.4
21.2
p<0.001 4.09 2.54-6.58
AG+GG
54.1
21.2
4.39 2.73-7.07
Allele A
72.1
89.4
32.91 0.31 0.2-0.46
p<0.001 3.27 2.15-4.98
Allele G
27.9
10.6
Comments: Infertility groups: Rate of AA, AG, GG were 45.9%,
52.4% and 1.8%, respectively. Allele A was 72.1%, the rate of G
allele was 27.9%. Control groups: AA, AG, GG were 78.8%, 21.2%
and 0%, respectively. The rate of allele A was 89.4%, the rate of G
allele was 10.6%. The AG gene increases the infertility ability by
4.09 times that of the other genes. Genotype AG and GG genotype
were higher than controls. People with G alleles, infertility increased
to 3.27 times.
Table 3.6. Results of genotyping of NAT2 481C> T gene polymorphism
(infertility group n = 170, control group n = 170)
NAT2(481C>T Infertility Control
OR
95%CI
χ2
group
group
(rs1799929)
(p)
(%)
(%)
CC
49.4
80
34.82 0.24 0.15-0.40
CT
50.6
20
4.10 2.53-6.63
p<0.001
CT+TT
50.6
20
4.10 2.53-6.63
Allele C
74.7
90
0.21-0.50
27.36 0.33
p<0.001 3.05
Allele T
25.3
10
1.98-4.69
Comments: Infertility groups: Rate of CC, CT genes, respectively,
were 49.4%, 50.6%, C allele 74.7%, T allele 25.3%. Control group:
CC, CT and TT genotypes were 80%, 20%, C 90%, T 10.0%.
Frequency of CT genotype is mainly found in the infertile group, the
genotype of infertility increased 4.1 times compared with the control
group. Synthesis of CT and TT genotypes showed infertility
increased 4.1 fold. Frequency of T allele is mainly found in the
infertile group, carriers of T-allen increased 3.05 times.
3.3.2. The results of polymorphism NAT2 gen
11
Table 3.8. Genotype analysis results, allele genes NAT2 590 G>A (rs1799930)
(infertility group n = 170, control group n = 170)
NAT2
Infertility
group
(%)
Control
group
(%)
χ2
(p)
590G>A
(rs1799930)
GG
GA
GA+AA
Allele G
Alelle A
41.8
53.5
58.2
68.5
31.5
74.1
25.9
25.9
87.1
12.9
39.72
p<0.001
33.79
p<0.001
OR
95%CI
0.25
3.30
3.99
0.32
3.09
0.16-0.40
2.09-5.21
2.52-6.32
0.22-0.48
2.09-4.57
Comments: Infertility groups: GG, GA, AA ratios were 41.8%,
53.5% and 4.7%, respectively, with AA, G ratio 68.5%, allele rates A
is 31.5%. Control groups: GG, GA, AA ratios were 74.1 25.9%, 0%,
G allele 87.1%, and A allele 12.9%. Frequency of GA heterogeneity
was found in the infertile group. In GA, the infertility increased 3.3
times. Genetic GA and AA genes, infertility increased to 3.99 times.
Frequency of allele A is mainly found in the infertile group, the
carrier of alleles A infertility increased to 3.09 times.
3.2.3. Results of the GSTP1 polymorphism
Table 3.10. Results of genotyping, allele of GSTP1 313G> A polymorphism
(rs1695) (infertility group n = 170, control group n = 170)
GSTP1 313G>A Infertility Control
χ2
group
OR
95%CI
group
(rs1695)
(p)
(%)
(%)
Genotype GG
52.9
85.3
0.19 0.12-0.33
46.94
Genotype GA
35.9
14.7
3.25 1.92-5.50
p<0.001
Genotype
47.1
14.7
5.16 3.06-8.68
GA+AA
Allele G
Allele A
70.9
29.1
92.6
7.4
54.01 0.19
p<0.001 5.18
0.12-0.31
3.24-8.28
12
Comments: Infertile groups: The rates of GG, GA and AA genes
were 52.9%, 35.9% and 11.2%, respectively, with the genotype AA,
the percentage of G allele at 70.9% Allele 29.1%. Control groups:
GG, GA and AA genotypes were 85.3%, 14.7% and 0%, respectively.
The G allele rate was 92.6% and the A allele rate was 7.4%.
Frequency of GA heterogeneity was found to be in the infertile
group, with the GA genotype with inferiority gaining 3.25 times.
Synthesis of GA and AA genes showed that infertility increased 5.16
folds. Frequency of allele A is mainly found in the infertile group,
people with A alleles increased infertility 5.18 times.
Table 3.12. Results of genotyping, alleles of GSTP1 341C> T polymorphism
(rs1138272) (infertility group n = 170, control group n = 170)
GSTP1 341C>T
(rs1138272)
Genotype CC
Genotype CT
Genotype CT+TT
Allele C
Allele T
Infertility Control
group
group
(%)
(%)
61.8
38.2
38.2
80.9
19.1
91.8
8.2
8.2
95.9
4.1
χ2
(p)
OR
95%CI
42.89
0.14 0.08-0.27
p<0.001 6.90 3.68-12.93
6.90 3.68-12.93
37.25 0.18 0.10-0.33
p<0.001 5.50 3.02-10.02
Comments: Infertile groups: CC, CT ratios were 61.8%, 38.2%;
The rate of allele C is 80.9%, the rate of allele T is 19.1%. Control
group: genotypic CC, CT ratio was 91.8%, 8.2%. Frequency of CT
genotype was significantly higher in the infertile group, in the CT
gene, infertility was increased by 6.9, the rate of allele C was 95.9%,
the rate of T allele was 4.1%. Persons with T alleles increased
sterility by 5.5 times.
13
3.4. Relationship between polymorphism of GSTP1 gene; NAT2
and CYP1A1 with infertility
Table 3.14. Genotype 2 and GSTP1 combination genotypes (infertility group n
= 170, control group n = 170)
Relationship between NAT2
Infertility
Control OR
95%CI
and GSTP1
group
group
NAT2(481C>T) and GSTP1(313G>A)
481CC and 313GG
41(24.1%) 116(68.2%) 0.15
0.09 - 0.24
481CC and (313GA or 313AA) 43(25.3%)
20(11.8%) 2.54
1.42 - 4.54
313GG and (481 CT or 481TT) 49(28.8%)
29(17.1%) 1.97
1.17 - 3.31
(481CT or 481TT) and (313GA 37(21.8%)
5(2.9%)
9.18 3.51 - 24.01
or 313AA)
NAT2(481C>T) and GSTP1(341C>T)
481CC and 341CC
42(24.7%) 128(75.3%) 0.11
481CC and (341CT or341TT)
42(24.7%)
341CC and (481 CT or 481TT)
63(37.1%)
(481CT or 481TT) and(341CT
or 341TT)
23(13.5%)
8(4.7%)
6.64 3.01 - 14.65
28(16.5%) 2.99
6(3.5%)
0.07 - 0.18
1.79 - 4.98
4.28 1.69 - 10.79
NAT2(590G>A) and GSTP1(313G>A)
590GG and 313GG
33(19.4%) 108(63.5%) 0.14
590GG and (313GA or 313AA) 38(22.4%)
18(10.6%) 2.43
0.08 - 0.23
1.32 - 4.46
313GG and (590GA or 590AA) 57(33.5%)
37(21.8)
1.81
(590GA or 590AA) and
(313GA or 313AA)
7(4.1%)
7.64 3.32 - 17.57
42(24.7%)
1.12 - 2.94
NAT2(590G>A) and GSTP1(341C>T)
590GG and 341CC
41(24.1%) 117(68.8%) 0.14
0.09 - 0.23
590GG and (341CT or 341TT)
64(37.6%)
1.26 - 3.26
39(22.9%) 2.03
341CC and (590GA or 590AA) 30(17.6%)
9(5.3%)
3.83
(590GA or 590AA) and
(341CT or 341TT)
5(2.9%)
8.56 3.26 - 22.44
35(20.6%)
1.76 - 8.35
14
Table 3.15. Analysis of CYP1A1 and NAT2 genotypes in the infertile group (n =
170) and control group (n = 170)
Relationship between
Infertility
Control
OR
95%CI
NAT2 and CYP1A1
group
group
NAT2 (481C>T)and CYP1A1 (2455A>G)
481CC and 2455AA
44 (25.9%) 111 (65.3%) 0.19 0.12 - 0.30
481CC and (2455AG or
40 (23.5%) 25 (14.7%) 1.78 1.03 - 3.10
2455GG)
2455AA and (481 CT or
34 (20%)
23 (13.5%) 1.60 0.90 - 2.85
481TT)
(481CT or 481TT) and
52 (30.6%)
11 (6.5%) 6.37 3.19 -12.73
(2455AG or 2455GG)
NAT2 (590G>A) and CYP1A1 (2455A>G)
590GG and 2455AA
36 (21.2%) 106 (62.4%) 0.16 0.10 - 0.26
590GG and (2455AG or 35 (20.6%) 20 (11.8%) 1.94 1.07 - 3.53
2455GG)
2455AA and (590GA or
42 (24.7%) 28 (16.5%) 1.66 0.98 - 2.84
590AA)
(590GA or 590AA) and
57 (33.5%)
16 (9.4%) 4.86 2.65 - 8.89
(2455AG or 2455GG)
Table 3.16. 2 Genotype GSTP1 and CYP1A1 polymorphism in the infertile group
(n = 170) and control group (n = 170)
Relationship between GSTP1
Infertility
Control
OR
95%CI
and CYP1A1
group
group
GSTP1(313G>A) and CYP1A1 (2455A>G)
313GG and 2455AA
35(20.6%) 120(70.6%) 0.11 0.07 - 0.18
313GG and (2455AG or 2455GG) 43(25.3%) 14(8.2%) 3.77 1.98 - 7.21
2455AA and (313GA or 313AA) 55(32.4%) 25(14.7%) 2.77 1.63 - 4.72
(313GA or 313AA) and (2455AG 37(21.8%) 11(6.5%) 4.02 1.97 - 8.19
or 2455GG)
GSTP1(341C>T) and CYP1A1 (2455A>G)
341CC and 2455AA
40(23.5%) 123(72.4%) 0.12 0.07 - 0.19
341CC and (2455AG or 2455GG) 65(38.2%) 33(19.4%) 2.57 1.57 - 4.20
2455AA and (341CT or 341TT)
38(22.4%) 11(6.5%) 4.16 1.57 - 4.20
(341CT or 341TT) and (2455AG 27(15.9%) 3(1.8%) 10.51
3.12or 2455GG)
35.37
Comment: When polymorphisms occur in both genes, the risk of
infertility is high.
15
Table 3.17. The most valuable gene interactions in the loci of
Xenobiotics system polymorphisms in male infertility patients.
Predictive error
Repeatability
Testing (%)
(%)
Training (%)
GSTP1(341C>T) and
CYP1A1(2455A>G)
GSTP1(341C>T) and
CYP1A1(2455A>G) and
NAT2(590G>A)
GSTP1(341C>T) and
CYP1A1(2455A>G) and
NAT2(590G>A) and
NAT2(481C>T)
50
14.1
38.9
100
30.8
46.4
100
22.3
52.5
Comment: The most valuable combinations are GSTP1 (341C>T)
and CYP1A1 (2455A>G) and NAT2 (590G>A); with 100%
reproducibility, and CYP1A1 (2455A>G) and NAT2 (590G>A) and
NAT2 (481C> T) with 100%.
Figure 3.1. Genetic combinations have the highest predictive value
The model shows the combination of GSTP1 (341C>T) and
CYP1A1 (2455A>G) and NAT2 (590G>A) polymorphisms; or
GSTP1 (341C>T) and CYP1A1 (2455A>G) and NAT2 (481C>T)
show cumulative interaction, in which CYP1A1 (2455A>G) and
NAT2 (590G>A) or CYP1A1 (2455A>G) and NAT2 (481C>T) are
complementary interactions.
16
3.3.2. The relationship between oxidative stress in semen in male
patients with polymorphisms in xenobiotics metabolism
Table 3.18. The distribution of OS levels
Infertility
Control
OS
group
group
OR
(95% CI)
χ2
(n = 71)
%
n1
level
(n = 72)
%
n2
(p)
HOS
56
78.9
8 11.1
66.39 29.87 11.78-75.70
p<0.001
LOS
15
21.1
64 88.9
0.03 0.01 - 0.08
Comment: In the infertile group, the proportion of patients with
high OS levels (HOS) was 78.9%, the low OS level (LOS) was
21.1%. In the control group, the proportion of patients with high OS
(HOS) was only 11.1%, while the proportion of patients with low OS
was 88.9%.
The infertile group has a polymorphic xenobiotics metabolism,
which is 29.87 times more likely to be oxidative stress than normal
people.
Table 3.19. The distribution of polymorphic polymorphisms in xenobiotics
translates among OS levels in the disease group
Amount of
polymorphm
Goup HOS
(n = 56)
%
n1
Goup LOS
(n = 15)
%
n2
≥2
49
87.5
11
73.3
1
7
12.5
4
26.7
χ2
p
1.81
0.4
Comment: The HOS group had 87.5% of 2 polymorphisms that
metabolized xenobiotics or more, only 12.5% of patients had at most
1 polymorphism.
The level of oxidation in semen did not differ significantly
between groups of 2 polymorphisms and the other group, but in
general the group of> 2 polymorphs tend to have higher oxidation
levels than the other group.
17
Chapter 4
DISCUSSION
4.1. Characteristics of the age of the subject
The mean age of the infertile group was 31.43 ± 5.548, the control
group was 31.94 ± 5.074. There was no statistically significant
difference in age between study groups (p = 0.381). Thus, the two
groups were similar in age, ensuring the results of polymorphisms
that transformed xenobiotics, which were not age-related.
4.2. Nucleotide mutations of genes CYP1A1, NAT2, GSTP1 with
infertility
4.2.1. Genotype distribution and correspondence with HardyWeinberg equation for infertility and control groups
Genotypic distribution in Hardy-Weinberg's control group
demonstrated that the control group had no effect on the mutation. In
the infertile group, except for 313G>A of the GSTP1 gene, all other
genes with a different distribution to the Hardy-Weinberg distribution
have been shown to have the effect of polymorphisms that alter the
frequency of infertility.
4.2.2. Genotype distribution and relationship between
polymorphism of CYP1A1 2455A> G with male infertility
Studies by Luo H. (2014, Nejati M. (2016), Ramgir S.S. (2017)
have confirmed that CYP1A1 polymorphism is closely related to
male infertility. increased 4.09 times inferiority to the control group,
GG and AG conjugated genes increased the likelihood of infertility
4.39, and G-induced infertility increased to 3.27.
4.2.3. Relationship between polymorphic NAT2 481C>T
(rs1799929) and NAT2 590 G>A (rs1799930) with male infertility
For the polymorphic NAT2 590G> A gene (rs1799930), the
18
heterologous GA gene was 53.5% larger than the control group at
25.9%. Allele A in the group of infertility 31.5%, control group
12.9%. GA heterogeneity increased the infertility rate by 3.3 times;
People with GA and AA combinations, the possibility of infertility
increased by 3.99: GA + AA increased 3.99 times; Bring alleles A,
the possibility of infertility increased 3.09 times.
In the NAT2 gene, position 481, transformed genotype (CT)
increased the likelihood of infertility by 4.1. Alenes metabolism (T)
was greater in the control group than in the control group. Our
research is consistent with studies by Dinh Doan Long (2010) and
Yarosh (2014).
4.2.4. Relationship between polymorphism of GSTP1 313G> A
(rs1695) and GSTP1 341C> T (rs1138272) with male infertility
On polymorphism of GSTP1 313G>A (rs1695), the results
showed that the rate of mutant genotypes in the infertile group was
higher than the control group; Incorporating GA + AA, infertility
increased 5.16 times; AG GSTP1 gene localization at position 313
increased the risk of infertility 3.25 times, heterologous and mutant
genotypes (GA and AA) increased the likelihood of infertility 5.16.
The mutant carriers (A) increased the risk of infertility by 5.18 times.
With the GSTP1 341C>T gene polymorphism (rs1138272): the
rate of mutant genotypes in the infertile group was higher than that of
the control group. The mutant and mutant genotypes of GSTP1 at
position 341 increased the risk of infertility by 6.9. The mutant (T)
gene of GSTP1 at 341 increased the risk of infertility by 5.5 times
that of normal allelic carriers (C).
4.3. Correlation between common nucleotid variants of CYP1A1,
GSTP1 and NAT2 genes for male infertility
19
4.3.1. Correlation between polymorphisms of CYP1A1, GSTP1 and
NAT2 with male infertility
According to our study, people with genotype (590GA or 590AA)
and (2455AG or 2455GG), the risk of infertility increased 4.86 times;
Except for genotypes that carry only one of the 590GG polymorphisms
and 2455AG or 2455GG and 2455AA and 590GA or 590AA.
People with both polymorphism (481CT or 481TT) and (2455AG
or 2455GG) increased the risk of infertility by 6.37 times. We have
not found any authors to study the association of CYP1A1 2455A>G
and NAT2 (590G>A) polymorphisms; (481C>T) with male infertility.
Our study found that the greater the polymorphism of CYP1A1,
NAT2, the higher the risk of infertility.
Persons with simultaneous CYP1A1 polymorphism (2455A>G) and
GSTP1 (313G>A); GSTP1 (341C>T) increased 4.02 times, with
genotypes (313GA or 313AA) and (2455AG or 2455GG) and increased
10.51 with genotypes (341CT or 341TT) and 2455AG or 2455GG).
About the additive effect of the NAT2 polymorphic polymorphism
(590G>A); (481C>T) with GSTP1 (313G>A); (341C>T), we found
that genotypes with both polymorphisms (481CT or 481TT) and
(313GA or 313AA) increased the risk of infertility by 9.18 times.
Both polymorphisms (481CT or 481TT) and (341CT or 341TT)
increased the risk of infertility by 4.28. Both polymorphisms (590GA
or 590AA) and (313GA or 313AA) increased the risk of infertility by
7.64. Both polymorphisms (590GA or 590AA) and (341CT or
341TT) increased the risk of infertility by 8.56. Thus, the cumulative
effect of CYP1A1, NAT2, and GSTP1 polymorphisms on the
infertility of male infertility can be observed. Although only one
polymorph is present in one of these genes, there is a risk of
infertility in men.
20
To assess the gene-wide interaction with large numbers of loci, we
used the MDR method. All SNP interactions were tested using 10fold crossover analysis of 2, 3, 4 and 5 genotypes including both
high-risk genotypes and low-risk genotypes. This is the first study in
Vietnam to analyze gene combination. From all genetic interactions,
the most valuable combination was the GSTP1 (341C>T) and
CYP1A1 (2455A>G) and NAT2 (590G>A) combinations; with a
reproducibility of 30.8% (Monte-Carlo, p <0.01, predicted error of
<46.4%) and GSTP1 (341C>T) and CYP1A1 (2455A>G) and NAT2
(590G>A) and NAT2 (481C>T) with a 100% repeatability and a
predicted error of 22.3% (predicted error <52.5%).
By MDR software we analyze genetic combinations and build
Dendrogram maps. Results: Combinations of GSTP1 (341C>T) and
CYP1A1 (2455A>G) and NAT2 (590G>A) polymorphisms; or
GSTP1 (341C>T) and CYP1A1 (2455A>G) and NAT2 (481C>T)
show cumulative interaction, in which CYP1A1 (2455A>G) and
NAT2 (590G>A) or CYP1A1 (2455A>G) and NAT2 (481C>T) are
complementary interactions. Therefore, individuals with mixed
polymorphic genes have a significantly increased risk of male
infertility.
Our study indicates that combinations of GSTP1, NAT2 and
CYP1A1 polymorphisms may increase the risk of infertility. This may
be due to oxidative stress due to excessive activity of ROS leading to
alterations in GSTP and CYP1A1 genes and non-recovery of sperm
DNA by abnormal metabolism when transgenic NAT2.
4.3.2. Relationship between oxidative stress levels in semen in male
patients with polymorphisms in xenobiotics metabolism
OS has four levels from 1 to 4 and is divided into two groups of
HOS (including Levels 3 and 4) and LOS (Level 1 and 2 OS).
Comparison between the two groups: Patients with spermatozoa in
21
semen and at least one polymorphisms that metabolize xenobiotics;
Controls are those without any gene polymorphism. We collected 71
patients in the disease group and 72 patients in the control group. In
the group of patients, high OS (HOS) was 78.9%, low OS (LOS) was
21.1%. In contrast, in the control group, high OS (HOS) was only
11.1%, low OS was 88.9%. This suggests that infertile men with
polymorphisms that metabolize xenobiotics have a 29.87-fold higher
risk of oxidative stress than normal people. The difference was
statistically significant with p <0.001.
The study by Valeria M. et al. (2015), Aida Pujol et al. (2016),
Goslvez et al. (2017) showed high levels of OS or ROS in the
transgenic group of xenobiotics.
The HOS group (high OS levels) had 87.5% of the two
polymorphisms that metabolized xenobiotics or more, only 12.5%
had a polymorphism. The LOS group had only 11 patients with 2 or
more polymorphisms. Although the differences between the two
groups were not statistically significant, the initial finding was that as
polymorphic polymorphisms metabolized xenobiotics the more they
increased the risk of oxidative stress, which was also the main cause
of the reduce sperm quality, consentrate of sperm. Can transgenic
metabolism of xenobiotics cause increased free radicals leading to
oxidative stress, breakdown of sperm DNA and lead to infertility.
22
CONCLUSION
1. Polymorphism of genes CYP1A1, NAT2, GSTP1
Frequency of AG and AG genotypes of CYP1A1 2455 A>G
polymorphism in the infertile group was 52.4% and 1.8%, higer in
the control group.
Frequency of CT genotype of NAT2: polymorphism
481C>T was 50.6% in the infertile group and 20% in the
control group; Frequency of GA and AA genotypes of NAT2
590 polymorphism in the infertile group was 53.5% and 4.7%;
in the control group was 25.9% and 0%.
- Gene GSTP1: Frequency of GA and AA genotypes 313G>A in
the infertile group was 35.9% and 11.2%; in the control group was
14.7% and 0%; Frequency of GA and AA genotypes 341C>T in the
inferior group was 38.2%; in the control group was 8.2%.
2. Relationship between polymorphism of GSTP1, NAT2, and
CYP1A1 with infertility
- Polymorph CYP1A1 2455A> G, A allele replaced by G allele
increases the risk of male infertility compared to A allele 3.27 times.
- Polymorphic NAT2 481C> T (rs1799929), C allele replaced by T
allele increased the risk of infertility compared to C allele up 3.05 times.
- Polymorph NAT2 590 G> A (rs1799930), G allele replaced by A
allele increases the risk of male infertility compared to G allele 3.09
times.
- GSTP1 313G polymorphism> A: G allele was replaced by A allele
to increase the risk of male infertility compared to G allele 5.18 times.
- GSTP1 341C> T polymorphism (rs1138272): C allele replaced
by T allele increased the risk of male infertility compared to C allele
5.5 times.
23
Combining 2 polymorphs:
- Combining two GSTP1 and NAT2 polymorphisms, the risk of
infertility is higher when there is only one type of polymorphism.
- Combining two polymorphisms CYP1A1 and NAT2 the risk of
infertility is higher when there is only one type of polymorphism.
- Combining 2 polymorphisms GSTP1 and CYP1A1 are at higher
risk of infertility when there is only 1 polymorphic type.
Combining the polymorphisms of NAT2, GSTP1 and CYP1A1:
Complex GSTP1(341C>T); NAT2(590G>A); CYP1A1(2455A>G)
with 100% reproducibility and prediction error of 30.8%. Type
GSTP1 (341C>T); NAT2 (590G>A); CYP1A1 (2455A>G); NAT2
(481C>T) with a 100% repeatability and a predicted error of 22.3%.
Complex of polymorphisms GSTP1 (341C>T); NAT2 (590G>A);
CYP1A1 (2455A>G) or GSTP1 (341C>T); CYP1A1 (2455A>G);
NAT2 (481C>T) exhibits additive interaction; NAT2 (590G>A);
CYP1A1 (2455A>G) or CYP1A1 (2455A>G); NAT2 (481C>T) is a
complementary interaction.
- On oxidative stress and polymorphism, xenobiotics metabolize
There is a correlation between oxidative stress in semen in
infertile men with polymorphisms that metabolize xenobiotics.
Infertile men with mutations in the xenobiotics metabolism, were
29.87 times more likely to develop oxidative stress than those who
did not.