Foundations of systems biology using cell illustrator and pathway databases (computational biology)
Bạn đang xem bản rút gọn của tài liệu. Xem và tải ngay bản đầy đủ của tài liệu tại đây (11.59 MB, 166 trang )
Computational Biology
Editors-in-Chief
Andreas Dress
University of Bielefeld (Germany)
Martin Vingron
Max Planck Institute for Molecular Genetics (Germany)
Editorial Board
Gene Myers, Janelia Farm Research Campus, Howard Hughes Medical Institute (USA)
Robert Giegerich, University of Bielefeld (Germany)
Walter Fitch, University of California, Irvine (USA)
Pavel A. Pevzner, University of California, San Diego (USA)
Advisory Board
Gordon Crippen, University of Michigan (USA)
Joe Felsenstein, University of Washington (USA)
Dan Gusfield, University of California, Davis (USA)
Sorin Istrail, Brown University, Providence (USA)
Samuel Karlin, Stanford University (USA)
Thomas Lengauer, Max Planck Institut Informatik (Germany)
Marcella McClure, Montana State University (USA)
Martin Nowak, Harvard University (USA)
David Sankoff, University of Ottawa (Canada)
Ron Shamir, Tel Aviv University (Israel)
Mike Steel, University of Canterbury (New Zealand)
Gary Stormo, Washington University Medical School (USA)
Simon Tavaré, University of Southern California (USA)
Tandy Warnow, University of Texas, Austin (USA)
The Computational Biology series publishes the very latest, high-quality research devoted to specific
issues in computer-assisted analysis of biological data. The main emphasis is on current scientific developments and innovative techniques in computational biology (bioinformatics), bringing to light methods
from mathematics, statistics and computer science that directly address biological problems currently
under investigation.
The series offers publications that present the state-of-the-art regarding the problems in question; show
computational biology/bioinformatics methods at work; and finally discuss anticipated demands regarding
developments in future methodology. Titles can range from focused monographs, to undergraduate and
graduate textbooks, and professional text/reference works.
Author guidelines: springer.com > Authors > Author Guidelines
For other titles published in this series, go to />
Masao Nagasaki • Ayumu Saito • Atsushi Doi •
Hiroshi Matsuno • Satoru Miyano
Foundations of Systems
Biology
Using Cell Illustrator R and Pathway Databases
Dr. Masao Nagasaki
Dr. Ayumu Saito
Prof. Satoru Miyano
University of Tokyo
Inst. Medical Science
Human Genome Center
4-6-1 Shirokanedai
Tokyo
Minato-ku
108-8639 Japan
Dr. Atsushi Doi
Institute of System LSI Design Industry
Fukuoka R & D Center
3-8-34 Momochihama
Fukuoka
Office 608, Sawara-ku
814-0001 Japan
Prof. Hiroshi Matsuno
Yamaguchi University
Graduate School of Science &
Engineering
Yamaguchi
753-8512 Japan
Computational Biology Series ISSN 1568-2684
ISBN: 978-1-84882-022-7
e-ISBN: 978-1-84882-023-4
DOI: 10.1007/978-1-84882-023-4
Translated by Satoru Miyano, Masao Nagasaki and Ayumu Saito
c Springer-Verlag London Limited 2009
c 2007 Atsushi Doi, Masao Nagasaki, Ayumu Saito, Hiroshi Matsuno, Satoru Miyano
Shisutemu seibutugaku ga wakaru! Seruirasutore-ta wo tsukatte miyou
ISBN: 978-4-320-05658-9 was originally published in Japanese language by Kyoritsu Shuppan Co., Ltd.,
Tokyo, Japan in 2007. This translation is published by arrangement with Kyoritsu Shuppan Co., Ltd., Tokyo,
Japan.
All rights reserved. No part of this book may be reproduced or transmitted in any form or by any means,
electronic or mechanical, including photocopying, recording or by any information storage and retrieval
system, without permission in writing from Kyoritsu Shuppan Co., Ltd.
Cell Illustrator is the property of Tokyo University and is distributed worldwide by BIOBASE GmbH.
TRANSPATH is a registered trademark of BIOBASE GmbH, Halchtersche Strasse 33, Wolfenbüttel 38304
Germany.
British Library Cataloguing in Publication Data
A catalogue record for this book is available from the British Library
Library of Congress Control Number: 2009922124
Apart from any fair dealing for the purposes of research or private study, or criticism or review, as
permitted under the Copyright, Designs and Patents Act 1988, this publication may only be reproduced,
stored or transmitted, in any form or by any means, with the prior permission in writing of the
publishers, or in the case of reprographic reproduction in accordance with the terms of licences issued by the
Copyright Licensing Agency. Enquiries concerning reproduction outside those terms should be sent to the
publishers.
The use of registered names, trademarks, etc. in this publication does not imply, even in the absence of a
specific statement, that such names are exempt from the relevant laws and regulations and therefore free for
general use.
The publisher makes no representation, express or implied, with regard to the accuracy of the information
contained in this book and cannot accept any legal responsibility or liability for any errors or omissions that
may be made.
Cover design: KünkelLopka GmbH, Heidelberg
Printed on acid-free paper
Springer is part of Springer Science+Business Media (www.springer.com)
Foreword
Today, as hundreds of genomes have been sequenced and thousands of proteins and
more than ten thousand metabolites have been identified, navigating safely through
this wealth of information without getting completely lost has become crucial for
research in, and teaching of, molecular biology.
Consequently, a considerable number of tools have been developed and put on
the market in the last two decades that describe the multitude of potential/putative
interactions between genes, proteins, metabolites, and other biologically relevant
compounds in terms of metabolic, genetic, signaling, and other networks, their aim
being to support all sorts of explorations through bio-data bases currently called
Systems Biology.
As a result, navigating safely through this wealth of information-processing tools
has become equally crucial for successful work in molecular biology.
To help perform such navigation tasks successfully, this book starts by providing
an extremely useful overview of existing tools for finding (or designing) and investigating metabolic, genetic, signaling, and other network databases, addressing also
user-relevant practical questions like
•
•
•
•
•
•
Is the database viewable through a web browser?
Is there a licensing fee?
What is the data type (metabolic, gene regulatory, signaling, etc.)?
Is the database developed/maintained by a curator or a computer?
Is there any software for editing pathways?
Is it possible to simulate the pathway?
It then goes on to introduce a specific such tool, that is, the fabulous “Cell Illustrator 3.0” tool developed by the authors. The book explains in great detail how
this tool can be used for creating, analyzing, and simulating models explicating and
testing our current understanding of basic biological processes. They pertain, for
example, to
— the organization and control of metabolic networks and metabolic flux analysis,
— the regulation of gene transcription, processing, and translation, or
v
vi
Foreword
— the processing of information via signaling pathways.
The book deals with such topics by providing a fascinating array of detailed
examples. Thus, it can serve as a perfect introduction to contemporary cell biology
for anybody who wants to quickly gain insight into the most important and topical
directions of research in this field. In particular, the book provides invaluable help
for anybody who wants to learn more about why and how the current big bio-data
bases can be used to develop and support Systems Biology research.
Therefore, any biology student can, and actually should, just work through these
examples on his own screen to quickly gain important and solid expertise and become a valuable and well-informed member of the continuously growing Systems
Biology research community.
The authors Masao Nagasaki, Ayumu Saito, Atsushi Doi, Hiroshi Matsuno, and
Satoru Miyano have been working at the forefront of in silico-based biology for
quite a few years, and are highly respected in the community.
I am therefore very happy to have their book appear in this series, and I congratulate the publishers for the very good work they have done in dealing with the challenging task of appropriately editing such a strongly digitally-oriented manuscript.
Prof. Dr. Andreas Dress
Director
Department of Combinatorics and Geometry (DCG)
CAS-MPG Partner Institute for Computational Biology (PICB)
Shanghai Institutes for Biological Sciences (SIBS)
Chinese Academy of Sciences (CAS)
June 2008
Preface
It has been said that “Systems Biology” is an important postgenomic challenge in
biology to understand “life as systems”. That being said, what does it mean? What
can be done with signaling pathways, metabolic pathways, and gene regulatory networks using computers? For those with similar concerns or questions, this should
be the first book you consult for an understanding of Systems Biology.
The definition of Systems Biology varies from scientist to scientist. Some of you
may have skimmed books or scientific papers with “Systems Biology” in the title
and seen alien terms such as “robustness analysis”, “stochastic differential equations”, or “bifurcation analysis” fly by. Some may have felt that this is similar to
lining up toy soldiers called differential equations and making them march. Those
of you who have felt that way are the intended audience of this book.
Biological organisms consist of many molecules, such as proteins, which fulfill
their functions and interact with others. One of the ways to understand this system
is to construct the system in parts on a computer and analyze. Beneath the current
attentions to Systems Biology is the compilation of large amounts of genomic data
and biological knowledge on the parts that compose everything from bacteria to
human beings. Since the basic mechanisms of these parts have been considerably
well defined, it is now time to understand how the interactions between these parts
create the high degree of complexity in biological systems.
On one hand, man-made systems such as electrical circuits and machinery can be
made over and over once there are parts and blueprints, since the system is known
from the beginning. On the other hand, organisms are made by nature and evolution,
and there is a large gap between gathering the parts and understanding the system.
Modeling and simulation are necessary technologies to close this gap. In order to
understand this system, it needs to be modeled with a high-level language including
mathematics and entered into a computer for computation. We should say a goodbye to messy (in Japanese, we say “Gochagocha”) printed diagrams with arrows and
circles of various shapes with narrations. This is the point of entry of “Cell Illustrator”, which is a software tool for biological pathway modeling and simulation.
Reading the book and using Cell Illustrator bundled in the CD-ROM should make
it possible to create highly complex pathways and simulations. There is no need for
vii
viii
Preface
prior knowledge in differential equations or programming. The prerequisites are
interest in biology, ability to operate a cell phone (or equivalent), and mathematical
ability of a standard middle school student or better.
Using Cell Illustrator, reading the book, and finishing the exercises—answers
are provided—should make you realize how easy this can be “(ˆoˆ)v”. Although
pathway drawing does not require any mathematical or programming skills, drawing
pathways may require some artistic sense. In addition, just by drawing pathways
using Cell Illustrator, pathway knowledge will become better organized, and the
reader should feel a sense of accomplishment. The columns interspersed in the book
are addendums and digressions; they can be skimmed at the reader’s discretion.
This book is designed and structured to be used for a semester-long course text at
the undergraduate level or can be used as a part of graduate courses. Chapter 1 describes a minimum biological knowledge and Chapters 2 and 3 explain some of the
important pathway databases and software tools together with their related concepts.
Chapter 4 describes the detailed first steps and elements for modeling pathways with
Cell Illustrator. The reader may find that graphical pictures representing biological
entities and processes help understanding the elements of pathways. Chapter 5 will
guide the reader to model three kinds of pathways in a step-by-step manner as exercises. Chapter 6 discusses the computational functionalities required for Systems
Biology. This book is an English translation of the original Japanese version published by Kyoritsu Shuppan Co., Ltd. With this edition, the data on software and
database versions are updated and Chapter 6 is enhanced with some new topics.
We are grateful to many people. First and foremost, we would like to thank the
current and former members of the Cell System Markup Language Project: Emi
Ikeda, Euna Jeong, Kaname Kojima, Chen Li, Hiroko Nishihata, Kazuyuki Numata, Yayoi Sekiya, Yoshinori Tamada, Kazuko Ueno of Human Genme Center;
Kanji Hioka, Yuto Ikegami, Hironori Kitakaze, Yoshimasa Miwa, Daichi Saihara,
Tomoaki Yamamotoya of Yamaguchi University.
Andreas Dress should be specially acknowledged for the foreword of this book.
For this English version, we were encouraged by Holger Karas and Edgar Wingender of BIOBASE and Wayne Wheeler of Springer U.K. as well as Koichi Nobusawa
and Yumiko Kita of Kyoritsu Shuppan Co., Ltd. for the original Japanese version.
Special thanks go to Jocelyne Bruand of UCSC and Tatsunori Hashimoto of Harvard University for helping this translation, and to Seiya Imoto, Rui Yamaguchi,
Teppei Shimamura, Andr´e Fujita, Yosuke Hatanaka, Eric Perrier, Jin Hwan Do, and
Takashi Yamamoto for their tremendous supports for Cell Illustrator.
Tokyo,
June 2008
Masao Nagasaki
Ayumu Saito
Atsushi Doi
Hiroshi Matsuno
Satoru Miyano
Contents
Foreword . . . . . . . . . . . . . . . . . . . . . . . . . . . . . . . . . . . . . . . . . . . . . . . . . . . . . . . . . .
v
Preface . . . . . . . . . . . . . . . . . . . . . . . . . . . . . . . . . . . . . . . . . . . . . . . . . . . . . . . . . . . . vii
1
Introduction . . . . . . . . . . . . . . . . . . . . . . . . . . . . . . . . . . . . . . . . . . . . . . . . . . .
1.1 Intracellular Events . . . . . . . . . . . . . . . . . . . . . . . . . . . . . . . . . . . . . . . . .
1.1.1 Transcription, Translation, and Regulation . . . . . . . . . . . . . . .
1.1.2 Signaling Pathways and Proteins . . . . . . . . . . . . . . . . . . . . . . .
1.1.3 Metabolism and Genes . . . . . . . . . . . . . . . . . . . . . . . . . . . . . . . .
1.2 Intracellular Reactions and Pathways . . . . . . . . . . . . . . . . . . . . . . . . . .
1
1
1
3
3
3
2
Pathway Databases . . . . . . . . . . . . . . . . . . . . . . . . . . . . . . . . . . . . . . . . . . . . .
2.1 Major Pathway Databases . . . . . . . . . . . . . . . . . . . . . . . . . . . . . . . . . . .
2.1.1 KEGG . . . . . . . . . . . . . . . . . . . . . . . . . . . . . . . . . . . . . . . . . . . . .
2.1.2 BioCyc . . . . . . . . . . . . . . . . . . . . . . . . . . . . . . . . . . . . . . . . . . . . .
2.1.3 Ingenuity Pathways Knowledge Base . . . . . . . . . . . . . . . . . . .
2.1.4 TRANSPATH . . . . . . . . . . . . . . . . . . . . . . . . . . . . . . . . . . . . . . .
2.1.5 ResNet . . . . . . . . . . . . . . . . . . . . . . . . . . . . . . . . . . . . . . . . . . . . .
2.1.6 Signal Transduction Knowledge Environment (STKE):
Database of Cell Signaling . . . . . . . . . . . . . . . . . . . . . . . . . . . .
2.1.7 Reactome . . . . . . . . . . . . . . . . . . . . . . . . . . . . . . . . . . . . . . . . . . .
2.1.8 Metabolome.jp . . . . . . . . . . . . . . . . . . . . . . . . . . . . . . . . . . . . . .
2.1.9 Summary and Conclusion . . . . . . . . . . . . . . . . . . . . . . . . . . . . .
2.2 Software for Pathway Display . . . . . . . . . . . . . . . . . . . . . . . . . . . . . . . .
2.2.1 Ingenuity Pathway Analysis (IPA) . . . . . . . . . . . . . . . . . . . . . .
2.2.2 Pathway Builder . . . . . . . . . . . . . . . . . . . . . . . . . . . . . . . . . . . . .
2.2.3 Pathway Studio . . . . . . . . . . . . . . . . . . . . . . . . . . . . . . . . . . . . . .
2.2.4 Connections Maps . . . . . . . . . . . . . . . . . . . . . . . . . . . . . . . . . . .
2.2.5 Cytoscape . . . . . . . . . . . . . . . . . . . . . . . . . . . . . . . . . . . . . . . . . .
2.3 File Formats for Pathways . . . . . . . . . . . . . . . . . . . . . . . . . . . . . . . . . . .
2.3.1 Gene Ontology . . . . . . . . . . . . . . . . . . . . . . . . . . . . . . . . . . . . . .
5
5
6
8
8
8
9
9
11
12
12
13
13
14
14
14
14
15
15
ix
x
Contents
2.3.2
2.3.3
2.3.4
2.3.5
2.3.6
3
4
PSI MI . . . . . . . . . . . . . . . . . . . . . . . . . . . . . . . . . . . . . . . . . . . . .
CellML . . . . . . . . . . . . . . . . . . . . . . . . . . . . . . . . . . . . . . . . . . . .
SBML . . . . . . . . . . . . . . . . . . . . . . . . . . . . . . . . . . . . . . . . . . . . .
BioPAX . . . . . . . . . . . . . . . . . . . . . . . . . . . . . . . . . . . . . . . . . . . .
CSML/CSO . . . . . . . . . . . . . . . . . . . . . . . . . . . . . . . . . . . . . . . . .
16
16
16
16
17
Pathway Simulation Software . . . . . . . . . . . . . . . . . . . . . . . . . . . . . . . . . . .
3.1 Simulation Software Backend . . . . . . . . . . . . . . . . . . . . . . . . . . . . . . . .
3.1.1 Architecture: Deterministic, Probabilistic, or Hybrid? . . . . . .
3.1.2 Methods of Pathway Modeling . . . . . . . . . . . . . . . . . . . . . . . . .
3.2 Major Simulation Software Tools . . . . . . . . . . . . . . . . . . . . . . . . . . . . .
3.2.1 Gepasi/COPASI . . . . . . . . . . . . . . . . . . . . . . . . . . . . . . . . . . . . .
3.2.2 Virtual Cell . . . . . . . . . . . . . . . . . . . . . . . . . . . . . . . . . . . . . . . . .
3.2.3 Systems Biology Workbench (SBW), Cell Designer,
JDesigner . . . . . . . . . . . . . . . . . . . . . . . . . . . . . . . . . . . . . . . . . . .
3.2.4 Dizzy . . . . . . . . . . . . . . . . . . . . . . . . . . . . . . . . . . . . . . . . . . . . . .
3.2.5 E-Cell . . . . . . . . . . . . . . . . . . . . . . . . . . . . . . . . . . . . . . . . . . . . . .
3.2.6 Cell Illustrator . . . . . . . . . . . . . . . . . . . . . . . . . . . . . . . . . . . . . . .
3.2.7 Summary . . . . . . . . . . . . . . . . . . . . . . . . . . . . . . . . . . . . . . . . . . .
19
19
20
20
21
21
21
21
22
22
22
24
Starting Cell Illustrator . . . . . . . . . . . . . . . . . . . . . . . . . . . . . . . . . . . . . . . . .
4.1 Installing Cell Illustrator . . . . . . . . . . . . . . . . . . . . . . . . . . . . . . . . . . . . .
4.1.1 Operating Systems and Hardware Requirements . . . . . . . . . .
4.1.2 Cell Illustrator Lineup . . . . . . . . . . . . . . . . . . . . . . . . . . . . . . . .
4.1.3 Installing and Running Cell Illustrator . . . . . . . . . . . . . . . . . . .
4.1.4 License Install . . . . . . . . . . . . . . . . . . . . . . . . . . . . . . . . . . . . . . .
4.2 Basic Concepts in Cell Illustrator . . . . . . . . . . . . . . . . . . . . . . . . . . . . .
4.2.1 Basic Concepts . . . . . . . . . . . . . . . . . . . . . . . . . . . . . . . . . . . . . .
4.2.2 Entity . . . . . . . . . . . . . . . . . . . . . . . . . . . . . . . . . . . . . . . . . . . . . .
4.2.3 Process . . . . . . . . . . . . . . . . . . . . . . . . . . . . . . . . . . . . . . . . . . . . .
4.2.4 Connector . . . . . . . . . . . . . . . . . . . . . . . . . . . . . . . . . . . . . . . . . .
4.2.5 Rules for Connecting Elements . . . . . . . . . . . . . . . . . . . . . . . . .
4.2.6 Icons for Elements . . . . . . . . . . . . . . . . . . . . . . . . . . . . . . . . . . .
4.3 Editing a Model on Cell Illustrator . . . . . . . . . . . . . . . . . . . . . . . . . . . .
4.3.1 Adding Elements . . . . . . . . . . . . . . . . . . . . . . . . . . . . . . . . . . . .
4.3.2 Model Editing and Canvas Controls . . . . . . . . . . . . . . . . . . . . .
4.4 Simulating Models . . . . . . . . . . . . . . . . . . . . . . . . . . . . . . . . . . . . . . . . .
4.4.1 Simulation Settings . . . . . . . . . . . . . . . . . . . . . . . . . . . . . . . . . .
4.4.2 Graph Settings . . . . . . . . . . . . . . . . . . . . . . . . . . . . . . . . . . . . . .
4.4.3 Executing Simulation . . . . . . . . . . . . . . . . . . . . . . . . . . . . . . . . .
4.5 Simulation Parameters and Rules . . . . . . . . . . . . . . . . . . . . . . . . . . . . .
4.5.1 Creating a Model with Discrete Entity and Process . . . . . . . .
4.5.2 Creating a Model with Continuous Entity and Process . . . . .
4.5.3 Concepts of Discrete and Continuous . . . . . . . . . . . . . . . . . . .
4.6 Pathway Modeling Using Illustrated Elements . . . . . . . . . . . . . . . . . .
25
25
25
26
26
28
28
28
28
30
33
34
35
36
36
39
41
41
41
43
44
44
49
51
52
Contents
4.7 Creating Pathway Models Using Cell Illustrator . . . . . . . . . . . . . . . . .
4.7.1 Degradation . . . . . . . . . . . . . . . . . . . . . . . . . . . . . . . . . . . . . . . . .
4.7.2 Translocation . . . . . . . . . . . . . . . . . . . . . . . . . . . . . . . . . . . . . . .
4.7.3 Transcription . . . . . . . . . . . . . . . . . . . . . . . . . . . . . . . . . . . . . . . .
4.7.4 Binding . . . . . . . . . . . . . . . . . . . . . . . . . . . . . . . . . . . . . . . . . . . .
4.7.5 Dissociation . . . . . . . . . . . . . . . . . . . . . . . . . . . . . . . . . . . . . . . .
4.7.6 Inhibition . . . . . . . . . . . . . . . . . . . . . . . . . . . . . . . . . . . . . . . . . . .
4.7.7 Phosphorylation by Enzyme Reaction . . . . . . . . . . . . . . . . . . .
4.8 Conclusion . . . . . . . . . . . . . . . . . . . . . . . . . . . . . . . . . . . . . . . . . . . . . . . .
xi
55
55
57
60
62
64
66
68
73
5
Pathway Modeling and Simulation . . . . . . . . . . . . . . . . . . . . . . . . . . . . . . . 75
5.1 Modeling Signaling Pathway . . . . . . . . . . . . . . . . . . . . . . . . . . . . . . . . . 75
5.1.1 Main Players: Ligand and Receptor . . . . . . . . . . . . . . . . . . . . . 75
5.1.2 Modeling EGFR Signaling with EGF Stimulation . . . . . . . . . 76
5.2 Modeling Metabolic Pathways . . . . . . . . . . . . . . . . . . . . . . . . . . . . . . . . 87
5.2.1 Chemical Equations and Pathway Representations . . . . . . . . . 87
5.2.2 Michaelis-Menten Kinetics and Cell Illustrator Pathway
Representation . . . . . . . . . . . . . . . . . . . . . . . . . . . . . . . . . . . . . . 88
5.2.3 Creating Glycolysis Pathway Model . . . . . . . . . . . . . . . . . . . . 89
5.2.4 Simulation of Glycolysis Pathway . . . . . . . . . . . . . . . . . . . . . . 101
5.2.5 Improving the Model . . . . . . . . . . . . . . . . . . . . . . . . . . . . . . . . . 101
5.3 Modeling Gene Regulatory Networks . . . . . . . . . . . . . . . . . . . . . . . . . . 106
5.3.1 Biological Clocks and Circadian Rhythms . . . . . . . . . . . . . . . 106
5.3.2 Gene Regulatory Network for Circadian Rhythms in Mice . . 107
5.3.3 Modeling Circadian Rhythms in Mice . . . . . . . . . . . . . . . . . . . 108
5.3.4 Creating Hypothesis by Simulation . . . . . . . . . . . . . . . . . . . . . 119
5.4 Summary . . . . . . . . . . . . . . . . . . . . . . . . . . . . . . . . . . . . . . . . . . . . . . . . . 124
6
Computational Platform for Systems Biology . . . . . . . . . . . . . . . . . . . . . . 127
6.1 Gene Network of Yeast . . . . . . . . . . . . . . . . . . . . . . . . . . . . . . . . . . . . . . 127
6.2 Computational Analysis of Gene Network . . . . . . . . . . . . . . . . . . . . . . 128
6.2.1 Displaying Gene Network . . . . . . . . . . . . . . . . . . . . . . . . . . . . . 128
6.2.2 Layout of Gene Networks . . . . . . . . . . . . . . . . . . . . . . . . . . . . . 130
6.2.3 Pathway Search Function . . . . . . . . . . . . . . . . . . . . . . . . . . . . . 131
6.2.4 Extracting Subnetworks . . . . . . . . . . . . . . . . . . . . . . . . . . . . . . . 132
6.2.5 Comparing Two Subnetworks . . . . . . . . . . . . . . . . . . . . . . . . . . 133
6.3 Further Functionalities for Systems Biology . . . . . . . . . . . . . . . . . . . . 136
6.3.1 Languages for Pathways: CSML 3.0 and CSO . . . . . . . . . . . . 136
6.3.2 SaaS Technology . . . . . . . . . . . . . . . . . . . . . . . . . . . . . . . . . . . . 137
6.3.3 Pathway Parameter Search . . . . . . . . . . . . . . . . . . . . . . . . . . . . 138
6.3.4 Much Faster Simulation . . . . . . . . . . . . . . . . . . . . . . . . . . . . . . . 138
6.3.5 Exporting Pathway Models to Programming Languages . . . . 138
6.3.6 Pathway Layout Algorithms . . . . . . . . . . . . . . . . . . . . . . . . . . . 139
6.3.7 Pathway Database Management System . . . . . . . . . . . . . . . . . 141
6.3.8 More Visually: Automatic Generation of Icons . . . . . . . . . . . 142
xii
Contents
Bibliographic Notes . . . . . . . . . . . . . . . . . . . . . . . . . . . . . . . . . . . . . . . . . . . . . . . . . 145
Index . . . . . . . . . . . . . . . . . . . . . . . . . . . . . . . . . . . . . . . . . . . . . . . . . . . . . . . . . . . . . 151
Chapter 1
Introduction
The primary aim of Systems Biology is “systems understanding of biology”. What
does this phrase mean? What can be done with “signaling pathway”, “gene regulatory network”, and “metabolic pathway” using computers? This book is meant
to be the first book for those people who have such questions and interests. Understanding the contents requires neither prior background knowledge/experiences
in differential equations nor computer programming. Reading this book by using
Cell Illustrator should enable the reader to make complex biological pathways for
simulation. In this chapter we explain the basics which constitute these biological
pathways.
1.1 Intracellular Events
A multitude of events occur within a cell. Inside, various molecules are fulfilling
their functions, creating energy and proteins necessary for the cell’s survival and
reproduction. On the surface of a cell, various molecules are receiving stimuli from
the outside. This resembles a human society, with its diversity of specialists. There
are proteins that transduce signals, and proteins that receive them. Some fulfill as
critical a role as creating energy for the cell, while others help metabolize other
molecules.
1.1.1 Transcription, Translation, and Regulation
The cell’s function, consisting of a variety of protein interactions, begins with the
production of protein from DNA information. First, genetic information, which is
coded as DNA in the nucleus, undergoes the process called transcription and produces mRNA. Ribosomes translate mRNA to protein. This process is called translation. The produced proteins have various functions. Some proteins move into the
1
2
1 Introduction
nucleus after synthesis and regulate the expression of certain genes by binding to
specific sites of the DNA. This regulation is activation or repression. In the former
case, the gene is up-regulated and so is expressed more; in the latter case, the gene is
down-regulated and may not be expressed at all. Thus, not all genes are necessarily
expressed at any given time. Even in the same person, depending on the cell type,
there exist cells with different patterns of gene expression. In addition, miRNA, a
type of RNA, has been recently discovered to influence expression regulation.
COLUMN 1
Small RNA
It is commonly known that “proteins form the bulk of cell function”. As mentioned
above, according to the central dogma of molecular biology, proteins are produced
by the sequence of transcription from DNA to mRNA and translation from mRNA
to protein. However, some of the transcribed RNA have unknown function, unlike
mRNA. This type of RNA was long thought to be garbage, and kept outside the
scope of investigation.
However, in 1993, one such RNA sequence was found to control the expression
of certain genes. Similar phenomena were discovered in the 21st century in other organisms, and these sequences became known as microRNA (miRNA). The miRNA
sequences are very short, with only 20-25 base pairs length. They are thought to
combine with protein and bind to a partially complementary mRNA, and prevent
its translation, rather than moving to the cytoplasm like mRNA. In other words, the
recently discovered miRNA is a type of molecule with the ability to block protein
translation. In plants, an analogous type of RNA, short interfering RNA (siRNA),
has been found to block viral RNA transcription. The roles of small RNA segments
are being investigated. In fact, it is often said that the first functional molecules on
the Earth resembled nucleic acids like RNA. Because nucleic acids carry information, it could be said that they are the basis of life. As sustaining any system is costly
biologically, a sufficiently evolved organism has no reason to sustain any systems
useless to survival.
In conclusion, the biological networks are complex, and one must not forget that
there exist functional molecules other than proteins.
1.2 Intracellular Reactions and Pathways
3
1.1.2 Signaling Pathways and Proteins
On the other hand, some proteins are secreted outside cell walls after being produced, and transmit messages to other cells. These proteins, called ligands, transmit
messages, while others, called receptors, receive them. The three-dimensional structures of a ligand and receptor are complementary, resembling a molecular key and
lock; therefore, a ligand only binds to the receptor that matches its shape. Upon receiving the ligand, the receptor is activated, and transduces the signal to another protein. This protein in turn activates another protein. The network of molecules transducing the signals is called a signaling pathway or signal transduction pathway.
These signals reach the nucleus and lead to the aforementioned gene regulation.
1.1.3 Metabolism and Genes
The cell metabolizes the required compounds like ATP, amino acids, and sugars
necessary through a variety of chemical reactions. For example, ethanol is metabolized to acetaldehyde which in turn becomes acetic acid. In addition to the
proper reagents, these metabolic reactions require enzymes, which are produced
from genes.
1.2 Intracellular Reactions and Pathways
A metabolic pathway is a network comprising many reactions. This is also the case
for a signal transduction pathway and gene regulatory network. We generally call
this network a pathway. Usually these pathways are visually represented as a network diagram of genes and their products in textbooks and pathway databases.
Figure 1.1 is an example showing gene regulatory relationships. The gene Mdm2
inhibits the gene p53, which activates the gene Bax. The arrows that connect genes
show the various relations between genes.
Mdm2
p53 −→ Bax
Fig. 1.1
Figure 1.2 is an example of a signaling pathway. The ligand FasL carries the
apoptosis signal. The receptor Fas binds with FasL and transduces the signal by
activating Caspase 8. In a signaling pathway diagram, the arrow represents chemical
interaction such as the binding of protein to protein and phosphorylation.
The pathway for converting ethanol to acetic acid is usually represented as shown
in Figure 1.3. The arrows connect the metabolic products in order. Each arrow repre-
4
1 Introduction
FasL (Ligand) −→ Fas (Receptor) −→ Caspase8 (Enzyme)
Fig. 1.2
sents a certain metabolic reaction. Though omitted in this diagram, various enzymes
necessary will usually be included as part of the diagram.
This book explores such pathways in order to understand biological systems in
silico.
Ethanol −→ Acetaldehyde −→ Acetic acid
Fig. 1.3
Chapter 2
Pathway Databases
Pathway information is available through a large number of databases ranging from
high-quality databases created by professional curators to massive databases, covering a vast number of putative pathways, created through natural language processing and text mining of abstracts. Because of the various differences in size,
quality, and/or property, it is necessary to use the right database for the user’s purpose, regardless of whether it is for commercial or for public use. In this chapter we
introduce some of the major pathway databases. These databases can display pathway diagrams, which combine metabolic, genetic, and signal networks based on the
literature. This chapter also covers some software applications for the production,
editing, and analysis of such pathways.
2.1 Major Pathway Databases
Pathway databases are being created all around the world. Each database strongly
reflects its builder’s intent and purpose. There are databases with detailed metabolic
pathways, while others have detailed signaling pathways. Most databases are created by curators who read papers and extract pathway information which will be organized together with pathway diagrams in the databases. Others are created using
natural language processing and text mining, which extract from papers various biological relations such as gene regulatory relations and organize them into databases.
This chapter covers those databases focused on metabolic and signaling pathways.
Pathway information is often described in the XML (eXtensible Markup Language) data format, which varies from database to database. This format can be
easily read by both computers and humans. The following example shows the information “The lecture with Id “5” will be given on 4/1/2007 by a person named
“masao nagasaki” in XML format:
<lecture id="5">
<date>2007-04-01</date>
5
6
2 Pathway Databases
</lecture>
In the following chapters, we use acronyms ending with “. . . ML”. This ending
simply indicates that the pathway information is stored in some variant of XML. In
this book, we do not go into the details of XML.
COLUMN 2
What’s XML?
XML is one of many self-extensible markup languages. Its proper name is Extensible Markup Language. A markup language uses a sentence structure to list and
categorize information. XML was developed in 1996 by the XML Working Group,
part of the international standardization organization W3C. Because the creator can
define and share a file format, a creator can use a standardized XML format for multiple applications, while allowing for a high degree of expression not constrained by
the syntax.
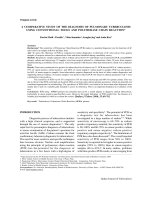
2.1.1 KEGG
KEGG (Kyoto Encyclopedia of Genes and Genomes) ( is a
series of databases developed by both the Bioinformatics Center of Kyoto University and the Human Genome Center of the University of Tokyo. This database
has been available for over 10 years. As the name encyclopedia suggests, the
database includes information necessary for systems understanding of biology, such
as genome sequences and chemical information (Figure 2.1). With its goal of collecting all knowledge relevant to biological systems, including the environmental
information, KEGG will be a true encyclopedia. The “Pathway” section of KEGG
consists mainly of metabolic pathways. For noncommercial uses, the license is
free, while for commercial uses, the license is sold from Pathway Solutions Inc.
( />KEGG is unique for its focus and coverage of yeast, mouse, and human metabolic
pathways. Currently, signaling pathways for cell cycles and apoptosis are being expanded. New pathways are created by professionals (curators) who read and summarize the relevant literature. The information is displayed as a browser-viewable
2.1 Major Pathway Databases
7
Fig. 2.1
pathway diagram. For example, one could search for the existence of a metabolic
pathway from substance A to B, or the required enzymes for such a reaction. In
addition, the database has links to relevant information such as genome sequences,
positions, and conditions. The database is stored in a format called KEGGML. Since
the pathways are then displayed as GIF files, the user cannot easily edit the pathway
information.
8
2 Pathway Databases
2.1.2 BioCyc
BioCyc is a pathway database provided by SRI International ( />The database is a high-quality database focused on metabolic pathways originally
formed by SRI International’s bioinformatics research group. Related to BioCyc are
the EcoCyc, MetaCyc, HumanCyc databases. Licenses are free for academic and
nonprofit uses. Humans and E. coli are the major organisms listed with a variety
of others. EcoCyc is mainly a database of E. coli metabolic pathways. These reactions are shown in the form of chemical equations. EcoCyc also contains a small
number of signaling pathways. Curators extracted the pathway knowledge from the
literature. Pathways are described with a proprietary format.
In addition, gene regulatory information upstream of the metabolic pathways is
also listed. In other words, there is a link from a metabolic pathway to the genes
coding enzymes and its regulators. The pathway map displays are separated in levels
of detail. At the most detailed level, the metabolic products are shown in terms of
the chemical equations.
2.1.3 Ingenuity Pathways Knowledge Base
Ingenuity Pathways Knowledge Base (IPKB) is the pathway database created by Ingenuity Systems Inc. ( All licenses, including academic
and nonprofit, require a fee. The database consists of gene regulatory and signaling
pathways. Curators extract knowledge from the literature for this database, which
currently contains human, mouse, and rat genetic information. (As of May 2008,
the website claims 13,600 human genes, 11,000 mouse genes, and 6,600 rat genes
cataloged.) The database uses the Ingenuity Pathways Analysis (IPA) software mentioned later to view and analyze pathway data and thus IPKB is inaccessible through
a web browser. Like KEGG and BioCyc, IPKB uses its own internal format for storage. However, unlike KEGG and BioCyc, IPKB allows for the editing of pathways
through IPA. This edited data can later be exported as a graphic format such as SVG.
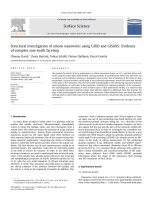
2.1.4 TRANSPATH
TRANSPATH is a gene regulatory and signaling pathway database created
by BIOBASE ( The most recent version
of the data requires a fee for both nonprofit and commercial uses. However,
some parts of the old data are provided to academic users as a trial version
( In addition to TRANSPATH, BIOBASE offers
the TRANSFAC database of transcription factors and PROTEOME database of
protein. It also provides a software ExPlain which combines and analyzes these
databases.
2.1 Major Pathway Databases
9
TRANSPATH is formed similarly to those listed above through curators and
therefore maintains high quality. Pathways are listed using a proprietary format. If
the user has a license, the pathways are viewable from a web browser. In addition, it
is possible to download the data stored as text file. For example, the phosphorylation
of I-κ B is shown below:
IkappaB-alpha, IkappaB-beta:p50:RelA +
ATP-IKK-alpha{p}:IKK-beta{p}:(IKK-gamma)2
-> IkappaB-alpha, IkappaB-beta{pS}:p50:RelA +
ADP (phosphorylation)
Each reaction has a link to the literature that confirms its existence. Therefore it
is easy to understand what each biochemical reaction means. Figure 2.2 shows the
IL-1 pathway displayed via a web browser, while Figure 2.3 displays the reaction
information from TRANSPATH shown through a web browser. (As of May 2008,
the website claims a total of 135,563 reactions mainly for human, mouse, and rat.)
2.1.5 ResNet
ResNet ( is the pathway database created by Ariadne Genomics. Academic and commercial licenses require a fee. The pathways
of ResNet consist mainly of gene regulatory and signaling pathways. Unlike other
databases, ResNet is constructed through computer analysis. In other words, the
pathways and networks are created through natural language processing of relevant literature. MedScan is used for this natural language processing procedure. The
database is constructed mainly from abstracts in PubMed, but some entries make use
of the full text. In addition, there are a small number of entries created by curators.
The pathway data created by MedScan can be viewed through the viewing tool
Pathway Studio. Similarly to other databases, MedScan uses its own proprietary
format. ResNet employs arrows with various labels to show the relationships between molecules. ‘+’ indicates activation, while ‘−’ indicates suppression. Relationships which cannot be determined are indicated with ‘?’. In addition, comments
are attached to the relation for nontrivial biological information. All such data are
completely user editable.
2.1.6 Signal Transduction Knowledge Environment (STKE):
Database of Cell Signaling
The database of Cell Signaling, a part of Signal Transduction Knowledge Environment (STKE) ( is an online service provided by Science. This is a high-quality signaling pathway database created and maintained by
curators. The database can be accessed by subscribing to the online service of Sci-
10
2 Pathway Databases
Fig. 2.2
ence although user registration does grant limited functionality such as pathway
viewing. This database is accessible in GIF or SVG format through a web browser.
Similarly to KEGG and BioCyc, this makes the pathway uneditable in browser. Similarly to ResNet, this database makes use of the labels ‘+’ for stimulatory relations,
‘−’ for inhibitory relations, ‘0’ for neutral relations, and ‘?’ for undefined relations.
A feature of this database is the separation of pathways into “specific” and “canonical”. Specific pathways are those which are unique to an organism, while canonical
pathways are those which are common. Unlike TRANSPATH or ResNet, however,
the user cannot specify a list of genes (proteins) and create a network on that selection.
The following information is available in this database (as of March 2007):
• Cell Biology (46 pathways)
2.1 Major Pathway Databases
11
Fig. 2.3
•
•
•
•
•
•
•
Developmental and Reproductive Biology (32 pathways)
Immune, Inflammatory, and Defense Signaling (17 pathways)
Microbiology (6 pathways)
Neurobiology (5 pathways)
Plant Biology (15 pathways)
Stress, Death, and Survival Signaling (9 pathways)
Pathways Implicated in Human Disease (11 pathways)
2.1.7 Reactome
Reactome is a pathway database containing cell metabolic and signaling pathways
( Cold Spring Harbor Laboratory, European Bioinfor-
12
2 Pathway Databases
matics Institute, and Gene Ontology Consortium—which specifies Gene Ontology
mentioned later—are the main developers of the project. Although humans are the
main organism catalogued, it has data for 22 other species such as mouse and rat.
Pathway knowledge is extracted by curators.
Reactome’s pathways and reactions can be viewed but not edited through a web
browser. Though the storage format is proprietary, a large number of pathways can
be obtained in multiple formats. Human reactions are distributed through SBML
format, human protein relations are given through TSV format, and cellular event
information is given through the BioPAX format listed in Section 2.3.5. All data can
easily be downloaded and edited.
2.1.8 Metabolome.jp
Metabolome.jp ( is a metabolic pathway-focused database
created by some research labs led by the University of Tokyo Graduate School
of Frontier Sciences. Using an applet called ARM, pathways can be viewed and
edited through a browser. Pathways are created by curators. Each metabolic product
is shown with an atomic structural formula and it is possible to display a pathway
which considers atom movements. Unlike KEGG, it is possible to track the movement of atoms in metabolic reactions. Pathway storage uses a proprietary format.
2.1.9 Summary and Conclusion
As described above, a variety of databases are available. The databases vary in the
types of information offered; there are metabolic pathway databases and signaling
pathway databases. In addition, there are differences in the organisms covered by the
databases. However, a common problem is that these databases do not have enough
information to permit simulating the pathways.
Pathway databases are constructed by curators or through the use of natural language processing and text mining tools via computer. This difference affects the
characteristics of the databases significantly. Through methods such as natural language processing, one has the advantage of a large breadth of literature which curators are unable to cover. In addition to the quality problem, however, there is usually the problem of lacking specific biological or experimental facts listed in the
database. Although it is likely that this technology will be improved in the future,
such databases are currently ancillary to those created by curators (such as IPKB or
TRANSPATH). Databases created by curators are on the whole more reliable and
detailed. Each pathway database has its own proprietary format. Although there are
formats such as SBML and BioPAX (mentioned later) which aim at standardizing
these formats, the current situation is not satisfactory in practice.