CFA 2019 level 1 schwesernotes book quiz bank SS 02 quiz 1 answers
Bạn đang xem bản rút gọn của tài liệu. Xem và tải ngay bản đầy đủ của tài liệu tại đây (774.85 KB, 64 trang )
SS 02 Quantitative Methods: Basic Concepts
Question #1 of 119
Answers
Question ID: 413077
If the outcome of event A is not affected by event B, then events A and B are said to be:
✓ A) statistically independent.
✗ B) mutually exclusive.
✗ C) conditionally dependent.
Explanation
If the outcome of one event does not influence the outcome of another, then the events are independent.
References
Question From: Session 2 > Reading 9 > LOS g
Related Material:
Key Concepts by LOS
Question #2 of 119
Question ID: 413026
For a stock, which of the following is least likely a random variable? Its:
✗ A) most recent closing price.
✗ B) current ratio.
✓ C) stock symbol.
Explanation
A random variable must be a number. Sometimes there is an obvious method for assigning a number, such as when the random
variable is a number itself, like a P/E ratio. A stock symbol of a randomly selected stock could have a number assigned to it like
the number of letters in the symbol. The symbol itself cannot be a random variable.
References
Question From: Session 2 > Reading 9 > LOS a
Related Material:
Key Concepts by LOS
Question #3 of 119
Question ID: 413068
If the probability of both a new Wal-Mart and a new Wendy's being built next month is 68% and the probability of a new Wal-Mart
being built is 85%, what is the probability of a new Wendy's being built if a new Wal-Mart is built?
✗ A) 0.60.
✓ B) 0.80.
✗ C) 0.70.
Explanation
P(AB) = P(A|B) × P(B)
0.68 / 0.85 = 0.80
References
Question From: Session 2 > Reading 9 > LOS f
Related Material:
Key Concepts by LOS
Question #4 of 119
Question ID: 413022
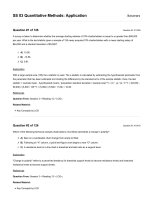
In any given year, the chance of a good year is 40%, an average year is 35%, and the chance of a bad year is 25%. What is the
probability of having two good years in a row?
✓ A) 16.00%.
✗ B) 8.75%.
✗ C) 10.00%.
Explanation
The joint probability of independent events is obtained by multiplying the probabilities of the individual events together: (0.40) ×
(0.40) = 0.16 or 16%.
References
Question From: Session 2 > Reading 9 > LOS a
Related Material:
Key Concepts by LOS
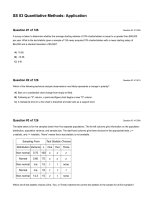
Question #5 of 119
Question ID: 413057
A very large company has twice as many male employees relative to female employees. If a random sample of four employees is
selected, what is the probability that all four employees selected are female?
✗ A) 0.0625.
✓ B) 0.0123.
✗ C) 0.3333.
Explanation
Since there are twice as many male employees to female employees, P(male) = 2/3 and P(female) = 1/3. Therefore, the
probability of 4 "successes" = (0.333)4 = 0.0123.
References
Question From: Session 2 > Reading 9 > LOS f
Related Material:
Key Concepts by LOS
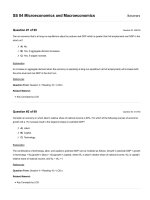
Question #6 of 119
Question ID: 413100
The covariance:
✓ A) can be positive or negative.
✗ B) must be positive.
✗ C) must be between -1 and +1.
Explanation
Cov(a,b) = σaσbρa,b. Since ρa,b can be positive or negative, Cov(a,b) can be positive or negative.
References
Question From: Session 2 > Reading 9 > LOS k
Related Material:
Key Concepts by LOS
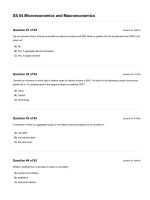
Question #7 of 119
Question ID: 413096
Which of the following statements is least accurate regarding covariance?
✓ A) The covariance of a variable with itself is one.
✗ B) Covariance can only apply to two variables at a time.
✗ C) Covariance can exceed one.
Explanation
The covariance of a variable with itself is its variance. Both remaining statements are true. Covariance represents the linear
relationship between two variables and is not limited in value (i.e., it can range from negative infinity to positive infinity).
References
Question From: Session 2 > Reading 9 > LOS k
Related Material:
Key Concepts by LOS
Question #8 of 119
Question ID: 413080
Jay Hamilton, CFA, is analyzing Madison, Inc., a distressed firm. Hamilton believes the firm's survival over the next year depends
on the state of the economy. Hamilton assigns probabilities to four economic growth scenarios and estimates the probability of
bankruptcy for Madison under each:
Probability of
Probability of
scenario
bankruptcy
Recession (< 0%)
20%
60%
Slow growth (0% to 2%)
30%
40%
Normal growth (2% to 4%)
40%
20%
Rapid growth (> 4%)
10%
10%
Economic growth scenario
Based on Hamilton's estimates, the probability that Madison, Inc. does not go bankrupt in the next year is closest to:
✗ A) 18%.
✗ B) 33%.
✓ C) 67%.
Explanation
Using the total probability rule, the unconditional probability of bankruptcy is (0.2)(0.6) + (0.3)(0.4) + (0.4)(0.2) + (0.1) (0.1) =
0.33. The probability that Madison, Inc. does not go bankrupt is 1 - 0.33 = 0.67 = 67%.
References
Question From: Session 2 > Reading 9 > LOS h
Related Material:
Key Concepts by LOS
Question #9 of 119
The probability of rolling a 3 on the fourth roll of a fair 6-sided die:
✓ A) is equal to the probability of rolling a 3 on the first roll.
Question ID: 413076
✗ B) is 1/6 to the fourth power.
✗ C) depends on the results of the three previous rolls.
Explanation
Because each event is independent, the probability does not change for each roll. For a six-sided die the probability of rolling a 3
(or any other number from 1 to 6) on a single roll is 1/6.
References
Question From: Session 2 > Reading 9 > LOS g
Related Material:
Key Concepts by LOS
Question #10 of 119
The probabilities of earning a specified return from a portfolio are shown below:
Probability Return
0.20
10%
0.20
20%
0.20
22%
0.20
15%
0.20
25%
What are the odds of earning at least 20%?
✗ A) Two to three.
✗ B) Three to five.
✓ C) Three to two.
Explanation
Odds are the number of successful possibilities to the number of unsuccessful possibilities:
P(E)/[1 − P(E)] or 0.6 / 0.4 or 3/2.
References
Question From: Session 2 > Reading 9 > LOS c
Related Material:
Key Concepts by LOS
Question ID: 413028
Question #11 of 119
Question ID: 434196
A parking lot has 100 red and blue cars in it.
40% of the cars are red.
70% of the red cars have radios.
80% of the blue cars have radios.
What is the probability of selecting a car at random and having it be red and have a radio?
✓ A) 28%.
✗ B) 25%.
✗ C) 48%.
Explanation
Joint probability is the probability that both events, in this case a car being red and having a radio, happen at the same time. Joint
probability is computed by multiplying the individual event probabilities together: P(red and radio) = (P(red)) × (P(radio)) = (0.4) ×
(0.7) = 0.28 or 28%.
Radio
No Radio
Red
28
12
40
Blue
48
12
60
76
24
100
References
Question From: Session 2 > Reading 9 > LOS f
Related Material:
Key Concepts by LOS
Question #12 of 119
Question ID: 413099
With respect to the units each is measured in, which of the following is the most easily directly applicable measure of dispersion?
The:
✓ A) standard deviation.
✗ B) variance.
✗ C) covariance.
Explanation
The standard deviation is in the units of the random variable itself and not squared units like the variance. The covariance would
be measured in the product of two units of measure.
References
Question From: Session 2 > Reading 9 > LOS k
Related Material:
Key Concepts by LOS
Question #13 of 119
Question ID: 413095
The returns on assets C and D are strongly correlated with a correlation coefficient of 0.80. The variance of returns on C is 0.0009, and the
variance of returns on D is 0.0036. What is the covariance of returns on C and D?
✓ A) 0.00144.
✗ B) 0.03020.
✗ C) 0.40110.
Explanation
r = Cov(C,D) / (σC x σD )
σC = (0.0009)0.5 = 0.03
σD = (0.0036)0.5 = 0.06
0.8(0.03)(0.06) = 0.00144
References
Question From: Session 2 > Reading 9 > LOS k
Related Material:
Key Concepts by LOS
Question #14 of 119
Which of the following is a joint probability? The probability that a:
✗ A) company merges with another firm next year.
✗ B) stock increases in value after an increase in interest rates has occurred.
✓ C) stock pays a dividend and splits next year.
Explanation
A joint probability applies to two events that both must occur.
References
Question From: Session 2 > Reading 9 > LOS f
Related Material:
Question ID: 413050
Key Concepts by LOS
Question #15 of 119
Question ID: 413042
For a given corporation, which of the following is an example of a conditional probability? The probability the corporation's:
✗ A) inventory improves.
✓ B) dividend increases given its earnings increase.
✗ C) earnings increase and dividend increases.
Explanation
A conditional probability involves two events. One of the events is a given, and the probability of the other event depends upon that given.
References
Question From: Session 2 > Reading 9 > LOS d
Related Material:
Key Concepts by LOS
Question #16 of 119
Question ID: 413114
Tully Advisers, Inc., has determined four possible economic scenarios and has projected the portfolio returns for two portfolios for
their client under each scenario. Tully's economist has estimated the probability of each scenario, as shown in the table below.
Given this information, what is the standard deviation of expected returns on Portfolio B?
Scenario Probability Return on Portfolio A Return on Portfolio B
A
15%
18%
19%
B
20%
17%
18%
C
25%
11%
10%
D
40%
7%
9%
✓ A) 4.34%.
✗ B) 12.55%.
✗ C) 9.51%.
Explanation
Scenario Probability Return on Portfolio B P × [RB - E(RB)]2
A
15%
19%
0.000624
B
20%
18%
0.000594
C
25%
10%
0.000163
D
40%
9%
0.000504
E(RB) = 12.55%
σ2 = 0.001885
σ = 0.0434166
References
Question From: Session 2 > Reading 9 > LOS l
Related Material:
Key Concepts by LOS
Question #17 of 119
Question ID: 413039
If the probability of an event is 0.10, what are the odds for the event occurring?
✓ A) One to nine.
✗ B) One to ten.
✗ C) Nine to one.
Explanation
The answer can be determined by dividing the probability of the event by the probability that it will not occur: (1/10) / (9/10) = 1 to
9. The probability of the event occurring is one to nine, i.e. in ten occurrences of the event, it is expected that it will occur once
and not occur nine times.
References
Question From: Session 2 > Reading 9 > LOS c
Related Material:
Key Concepts by LOS
Question #18 of 119
Question ID: 413105
The following information is available concerning expected return and standard deviation of Pluto and Neptune Corporations:
Expected Return
Standard Deviation
Pluto Corporation
11%
0.22
Neptune Corporation
9%
0.13
If the correlation between Pluto and Neptune is 0.25, determine the expected return and standard deviation of a portfolio that
consists of 65% Pluto Corporation stock and 35% Neptune Corporation stock.
✗ A) 10.3% expected return and 2.58% standard deviation.
✗ B) 10.0% expected return and 16.05% standard deviation.
✓ C) 10.3% expected return and 16.05% standard deviation.
Explanation
ERPort
= (WPluto)(ERPluto) + (WNeptune)(ERNeptune)
= (0.65)(0.11) + (0.35)(0.09) = 10.3%
σp
= [(w1)2(σ1)2 + (w2)2(σ2)2 + 2w1w2σ1σ2 r1,2]1/2
= [(0.65)2(22)2 + (0.35)2(13)2 + 2(0.65)(0.35)(22)(13)(0.25)]1/2
= [(0.4225)(484) + (0.1225)(169) + 2(0.65)(0.35)(22)(13)(0.25)]1/2
= (257.725)1/2 = 16.0538%
References
Question From: Session 2 > Reading 9 > LOS l
Related Material:
Key Concepts by LOS
Question #19 of 119
Question ID: 413062
Given the following table about employees of a company based on whether they are smokers or nonsmokers and whether or not
they suffer from any allergies, what is the probability of suffering from allergies or being a smoker?
Suffer from Allergies
Don't Suffer from Allergies
Total
Smoker
35
25
60
Nonsmoker
55
185
240
Total
90
210
300
✓ A) 0.38.
✗ B) 0.88.
✗ C) 0.12.
Explanation
The addition rule for probabilities is used to determine the probability of at least one event among two or more events occurring.
The probability of each event is added and the joint probability (if the events are not mutually exclusive) is subtracted to arrive at
the solution. P(smoker or allergies) = P(smoker) + P(allergies) − P(smoker and allergies) = (60/300) + (90/300) − (35/300) = 0.20
+ 0.30 − 0.117 = 0.38.
Alternatively: 1 − Prob.(Neither) = 1 − (185/300) = 38.3%.
References
Question From: Session 2 > Reading 9 > LOS f
Related Material:
Key Concepts by LOS
Question #20 of 119
Question ID: 413116
Use the following probability distribution to calculate the expected return for the portfolio.
State of the Economy Probability Return on Portfolio
Boom
0.30
15%
Bust
0.70
3%
✗ A) 9.0%.
✓ B) 6.6%.
✗ C) 8.1%.
Explanation
0.30 × 0.15 + 0.70 × 0.03 = 6.6%
References
Question From: Session 2 > Reading 9 > LOS l
Related Material:
Key Concepts by LOS
Question #21 of 119
Question ID: 413052
An analyst has a list of 20 bonds of which 14 are callable, and five have warrants attached to them. Two of the callable bonds
have warrants attached to them. If a single bond is chosen at random, what is the probability of choosing a callable bond or a
bond with a warrant?
✗ A) 0.70.
✓ B) 0.85.
✗ C) 0.55.
Explanation
This requires the addition formula, P(callable) + P(warrants) - P(callable and warrants) = P(callable or warrants) = 14/20 + 5/20 2/20 = 17/20 = 0.85.
References
Question From: Session 2 > Reading 9 > LOS f
Related Material:
Key Concepts by LOS
Question #22 of 119
Question ID: 413125
John purchased 60% of the stocks in a portfolio, while Andrew purchased the other 40%. Half of John's stock-picks are
considered good, while a fourth of Andrew's are considered to be good. If a randomly chosen stock is a good one, what is the
probability John selected it?
✓ A) 0.75.
✗ B) 0.30.
✗ C) 0.40.
Explanation
Using the information of the stock being good, the probability is updated to a conditional probability:
P(John | good) = P(good and John) / P(good).
P(good and John) = P(good | John) × P(John) = 0.5 × 0.6 = 0.3.
P(good and Andrew) = 0.25 × 0.40 = 0.10.
P(good) = P(good and John) + P (good and Andrew) = 0.40.
P(John | good) = P(good and John) / P(good) = 0.3 / 0.4 = 0.75.
References
Question From: Session 2 > Reading 9 > LOS n
Related Material:
Key Concepts by LOS
Question #23 of 119
A firm holds two $50 million bonds with call dates this week.
The probability that Bond A will be called is 0.80.
The probability that Bond B will be called is 0.30.
The probability that at least one of the bonds will be called is closest to:
✗ A) 0.24.
✗ B) 0.50.
✓ C) 0.86.
Explanation
We calculate the probability that at least one of the bonds will be called using the addition rule for probabilities:
P(A or B) = P(A) + P(B) - P(A and B), where P(A and B) = P(A) × P(B)
P(A or B) = 0.80 + 0.30 - (0.8 × 0.3) = 0.86
References
Question From: Session 2 > Reading 9 > LOS f
Related Material:
Key Concepts by LOS
Question ID: 413074
Question #24 of 119
Question ID: 434200
Tina O'Fahey, CFA, believes a stock's price in the next quarter depends on two factors: the direction of the overall market and
whether the company's next earnings report is good or poor. The possible outcomes and some probabilities are illustrated in the
tree diagram shown below:
Based on this tree diagram, the expected value of the stock if the market decreases is closest to:
✗ A) $62.50.
✗ B) $26.00.
✓ C) $57.00.
Explanation
The expected value if the overall market decreases is 0.4($60) + (1 - 0.4)($55) = $57.
References
Question From: Session 2 > Reading 9 > LOS j
Related Material:
Key Concepts by LOS
Question #25 of 119
An unconditional probability is most accurately described as the probability of an event independent of:
✓ A) the outcomes of other events.
✗ B) an observer's subjective judgment.
✗ C) its own past outcomes.
Explanation
An unconditional probability is one that is not stated as depending on the outcome of another event.
References
Question From: Session 2 > Reading 9 > LOS d
Question ID: 710139
Related Material:
Key Concepts by LOS
Question #26 of 119
Question ID: 413046
The unconditional probability of an event, given conditional probabilities, is determined by using the:
✗ A) multiplication rule of probability.
✗ B) addition rule of probability.
✓ C) total probability rule.
Explanation
The total probability rule us used to calculate the unconditional probability of an event from the conditional probabilities of the
event given a mutually exclusive and exhaustive set of outcomes. The rule is expressed as:
P(A) = P(A|B1)P(B1) + P(A|B2)P(B2) + ... + P(A|Bn)P(Bn)
References
Question From: Session 2 > Reading 9 > LOS e
Related Material:
Key Concepts by LOS
Question #27 of 119
Question ID: 413038
At a charity fundraiser there have been a total of 342 raffle tickets already sold. If a person then purchases two tickets rather than
one, how much more likely are they to win?
✗ A) 2.10.
✓ B) 1.99.
✗ C) 0.50.
Explanation
If you purchase one ticket, the probability of your ticket being drawn is 1/343 or 0.00292. If you purchase two tickets, your
probability becomes 2/344 or 0.00581, so you are 0.00581 / 0.00292 = 1.99 times more likely to win.
References
Question From: Session 2 > Reading 9 > LOS c
Related Material:
Key Concepts by LOS
Question #28 of 119
Question ID: 413078
A company says that whether it increases its dividends depends on whether its earnings increase. From this we know:
✗ A) P(dividend increase | earnings increase) is not equal to P(earnings increase).
✓ B) P(earnings increase | dividend increase) is not equal to P(earnings increase).
✗ C) P(both dividend increase and earnings increase) = P(dividend increase).
Explanation
If two events A and B are dependent, then the conditional probabilities of P(A | B) and P(B | A) will not equal their respective
unconditional probabilities (of P(A) and P(B), respectively). Both remaining choices may or may not occur, e.g., P(A | B) = P(B) is
possible but not necessary.
References
Question From: Session 2 > Reading 9 > LOS g
Related Material:
Key Concepts by LOS
Question #29 of 119
Question ID: 413111
After repeated experiments, the average of the outcomes should converge to:
✗ A) the variance.
✗ B) one.
✓ C) the expected value.
Explanation
This is the definition of the expected value. It is the long-run average of all outcomes.
References
Question From: Session 2 > Reading 9 > LOS l
Related Material:
Key Concepts by LOS
Question #30 of 119
Question ID: 413115
For assets A and B we know the following: E(RA) = 0.10, E(RB) = 0.10, Var(RA) = 0.18, Var(RB) = 0.36 and the correlation of the
returns is 0.6. What is the variance of the return of a portfolio that is equally invested in the two assets?
✗ A) 0.1102.
✓ B) 0.2114.
✗ C) 0.1500.
Explanation
You are not given the covariance in this problem but instead you are given the correlation coefficient and the variances of assets
A and B from which you can determine the covariance by Covariance = (correlation of A, B) × Standard Deviation of A) ×
(Standard Deviation of B).
Since it is an equally weighted portfolio, the solution is:
[( 0.52 ) × 0.18 ] + [(0.52) × 0.36 ] + [ 2 × 0.5 × 0.5 × 0.6 × ( 0.180.5 ) × ( 0.360.5 )]
= 0.045 + 0.09 + 0.0764 = 0.2114
References
Question From: Session 2 > Reading 9 > LOS l
Related Material:
Key Concepts by LOS
Question #31 of 119
Question ID: 413056
Given the following table about employees of a company based on whether they are smokers or nonsmokers and whether or not
they suffer from any allergies, what is the probability of being either a nonsmoker or not suffering from allergies?
Suffer from Allergies
Don't Suffer from Allergies
Total
Smoker
35
25
60
Nonsmoker
55
185
240
Total
90
210
300
✗ A) 0.38.
✓ B) 0.88.
✗ C) 0.50.
Explanation
The probability of being a nonsmoker is 240 / 300 = 0.80. The probability of not suffering from allergies is 210 / 300 = 0.70. The
probability of being a nonsmoker and not suffering from allergies is 185 / 300 = 0.62. Since the question asks for the probability of
being either a nonsmoker or not suffering from allergies we have to take the probability of being a nonsmoker plus the probability
of not suffering from allergies and subtract the probability of being both: 0.80 + 0.70 − 0.62 = 0.88.
Alternatively: 1 − P(Smoker & Allergies) = 1 − (35 / 300) = 88.3%.
References
Question From: Session 2 > Reading 9 > LOS f
Related Material:
Key Concepts by LOS
Question #32 of 119
Question ID: 413101
Joe Mayer, CFA, projects that XYZ Company's return on equity varies with the state of the economy in the following way:
State of Economy Probability of Occurrence Company Returns
Good
.20
20%
Normal
.50
15%
Poor
.30
10%
The standard deviation of XYZ's expected return on equity is closest to:
✓ A) 3.5%.
✗ B) 12.3%.
✗ C) 1.5%.
Explanation
In order to calculate the standard deviation of the company returns, first calculate the expected return, then the variance, and the standard
deviation is the square root of the variance.
The expected value of the company return is the probability weighted average of the possible outcomes: (0.20)(0.20) + (0.50)(0.15) +
(0.30)(0.10) = 0.145.
The variance is the sum of the probability of each outcome multiplied by the squared deviation of each outcome from the expected return:
(0.2)(0.20 - 0.145)2 + (0.5)(0.15 - 0.145)2 + (0.3)(0.1-0.145)2 = 0.000605 + 0.0000125 + 0.0006075 = 0.001225.
The standard deviation is the square root of 0.001225 = 0.035 or 3.5%.
References
Question From: Session 2 > Reading 9 > LOS l
Related Material:
Key Concepts by LOS
Question #33 of 119
Question ID: 434199
There is a 40% probability that the economy will be good next year and a 60% probability that it will be bad. If the economy is
good, there is a 50 percent probability of a bull market, a 30% probability of a normal market, and a 20% probability of a bear
market. If the economy is bad, there is a 20% probability of a bull market, a 30% probability of a normal market, and a 50%
probability of a bear market. What is the probability of a bull market next year?
✓ A) 32%.
✗ B) 20%.
✗ C) 50%.
Explanation
Because a good economy and a bad economy are mutually exclusive, the probability of a bull market is the sum of the joint
probabilities of (good economy and bull market) and (bad economy and bull market): (0.40 × 0.50) + (0.60 × 0.20) = 0.32 or 32%.
References
Question From: Session 2 > Reading 9 > LOS f
Related Material:
Key Concepts by LOS
Question #34 of 119
Question ID: 413094
Given the following probability distribution, find the covariance of the expected returns for stocks A and B.
Event
P(Ri)
RA
RB
Recession
0.10
-5%
4%
Below
0.30
-2%
8%
Normal
0.50
10%
10%
Boom
0.10
31%
12%
Average
✗ A) 0.00109.
✗ B) 0.00032.
✓ C) 0.00174.
Explanation
Find the weighted average return for each stock.
Stock A: (0.10)(-5) + (0.30)(-2) + (0.50)(10) + (0.10)(0.31) = 7%.
Stock B: (0.10)(4) + (0.30)(8) + (0.50)(10) + (0.10)(0.12) = 9%.
Next, multiply the differences of the two stocks by each other, multiply by the probability of the event occurring, and sum. This is
the covariance between the returns of the two stocks.
[(-0.05 − 0.07) × (0.04 − 0.09)] (0.1) + [(-0.02 − 0.07) × (0.08 − 0.09)](0.3) + [(0.10 − 0.07) × (0.10 − 0.09)](0.5) + [ (0.31 − 0.07) ×
(0.12 − 0.09)](0.1) = 0.0006 + 0.00027 + 0.00015 + 0.00072 = 0.00174.
References
Question From: Session 2 > Reading 9 > LOS k
Related Material:
Key Concepts by LOS
Question #35 of 119
Question ID: 413088
There is an 80% chance that the economy will be good next year and a 20% chance that it will be bad. If the economy is good,
there is a 60% chance that XYZ Incorporated will have EPS of $3.00 and a 40% chance that their earnings will be $2.50. If the
economy is bad, there is a 70% chance that XYZ Incorporated will have EPS of $1.50 and a 30% chance that their earnings will
be $1.00. What is the firm's expected EPS?
✗ A) $4.16.
✗ B) $2.00.
✓ C) $2.51.
Explanation
The expected EPS is calculated by multiplying the probability of the economic environment by the probability of the particular
EPS and the EPS in each case. The expected EPS in all four outcomes are then summed to arrive at the expected EPS:
(0.80 × 0.60 × $3.00) + (0.80 × 0.40 × $2.50) + (0.20 × 0.70 × $1.50) + (0.20 × 0.30 × $1.00) = $1.44 + $0.80 + $0.21 + $0.06
= $2.51.
References
Question From: Session 2 > Reading 9 > LOS j
Related Material:
Key Concepts by LOS
Question #36 of 119
Question ID: 413058
If two events are independent, the probability that they both will occur is:
✗ A) 0.50.
✓ B) Cannot be determined from the information given.
✗ C) 0.00.
Explanation
If two events are independent, their probability of their joint occurrence is computed as follows: P(A∩B) = P(A) × P(B). Since we are not
given any information on the respective probabilities of A or B, there is not enough information.
References
Question From: Session 2 > Reading 9 > LOS f
Related Material:
Key Concepts by LOS
Question #37 of 119
Question ID: 434195
Helen Pedersen has all her money invested in either of two mutual funds (A and B). She knows that there is a 40% probability
that fund A will rise in price and a 60% chance that fund B will rise in price if fund A rises in price. What is the probability that both
fund A and fund B will rise in price?
✗ A) 0.40.
✓ B) 0.24.
✗ C) 1.00.
Explanation
P(A) = 0.40, P(B|A) = 0.60. Therefore, P(AB) = P(A)P(B|A) = 0.40(0.60) = 0.24.
References
Question From: Session 2 > Reading 9 > LOS f
Related Material:
Key Concepts by LOS
Question #38 of 119
Question ID: 413027
Which of the following is an empirical probability?
✗ A) On a random draw, the probability of choosing a stock of a particular industry from the S&P 500
based on the number of firms.
✓ B) For a stock, based on prior patterns of up and down days, the probability of the stock having a down
day tomorrow.
✗ C) The probability the Fed will lower interest rates prior to the end of the year.
Explanation
There are three types of probabilities: a priori, empirical, and subjective. An empirical probability is calculated by analyzing past
data.
References
Question From: Session 2 > Reading 9 > LOS b
Related Material:
Key Concepts by LOS
Question #39 of 119
Question ID: 413121
Given P(X = 20, Y = 0) = 0.4, and P(X = 30, Y = 50) = 0.6, then COV(XY) is:
✗ A) 25.00.
✗ B) 125.00.
✓ C) 120.00.
Explanation
The expected values are: E(X) = (0.4 × 20) + (0.6 × 30) = 26, and E(Y) = (0.4 × 0) + (0.6 × 50) = 30. The covariance is COV(XY)
= (0.4 × ((20 − 26) × (0 − 30))) + ((0.6 × (30 − 26) × (50 − 30))) = 120.
References
Question From: Session 2 > Reading 9 > LOS m
Related Material:
Key Concepts by LOS
Question #40 of 119
Question ID: 413075
A bag of marbles contains 3 white and 4 black marbles. A marble will be drawn from the bag randomly three times and put back
into the bag. Relative to the outcomes of the first two draws, the probability that the third marble drawn is white is:
✓ A) independent.
✗ B) conditional.
✗ C) dependent.
Explanation
Each draw has the same probability, which is not affected by previous outcomes. Therefore each draw is an independent event.
References
Question From: Session 2 > Reading 9 > LOS g
Related Material:
Key Concepts by LOS
Question #41 of 119
Question ID: 413060
Tully Advisers, Inc., has determined four possible economic scenarios and has projected the portfolio returns for two portfolios for
their client under each scenario. Tully's economist has estimated the probability of each scenario as shown in the table below.
Given this information, what is the expected return on portfolio A?
Scenario Probability Return on Portfolio A Return on Portfolio B
A
15%
17%
19%
B
20%
14%
18%
C
25%
12%
10%
D
40%
8%
9%
✗ A) 10.75%.
✗ B) 9.25%.
✓ C) 11.55%.
Explanation
The expected return is equal to the sum of the products of the probabilities of the scenarios and their respective returns: = (0.15)
(0.17) + (0.20)(0.14) + (0.25)(0.12) + (0.40)(0.08) = 0.1155 or 11.55%.
References
Question From: Session 2 > Reading 9 > LOS f
Related Material:
Key Concepts by LOS
Question #42 of 119
Question ID: 413093
If given the standard deviations of the returns of two assets and the correlation between the two assets, which of the following
would an analyst least likely be able to derive from these?
✗ A) Covariance between the returns.
✗ B) Strength of the linear relationship between the two.
✓ C) Expected returns.
Explanation
The correlations and standard deviations cannot give a measure of central tendency, such as the expected value.
References
Question From: Session 2 > Reading 9 > LOS k
Related Material:
Key Concepts by LOS
Question #43 of 119
Question ID: 413032
Last year, the average salary increase for poultry research assistants was 2.5%. Of the 10,000 poultry research assistants, 2,000 received
raises in excess of this amount. The odds that a randomly selected poultry research assistant received a salary increase in excess of 2.5%
are:
✗ A) 20%.
✗ B) 1 to 5.
✓ C) 1 to 4.
Explanation
For event "E," the probability stated as odds is: P(E) / [1 - P(E)]. Here, the probability that a poultry research assistant received a salary
increase in excess of 2.5% = 2,000 / 10,000 = 0.20, or 1/5 and the odds are (1/5) / [1 - (1/5)] = 1/4, or 1 to 4.
References
Question From: Session 2 > Reading 9 > LOS c
Related Material:
Key Concepts by LOS
Question #44 of 119
Question ID: 413081
An investor is considering purchasing ACQ. There is a 30% probability that ACQ will be acquired in the next two months. If ACQ
is acquired, there is a 40% probability of earning a 30% return on the investment and a 60% probability of earning 25%. If ACQ is
not acquired, the expected return is 12%. What is the expected return on this investment?
✗ A) 12.3%.
✗ B) 18.3%.
✓ C) 16.5%.
Explanation
E(r) = (0.70 × 0.12) + (0.30 × 0.40 × 0.30) + (0.30 × 0.60 × 0.25) = 0.165.
References
Question From: Session 2 > Reading 9 > LOS h
Related Material:
Key Concepts by LOS
Question #45 of 119
Question ID: 413073
Given the following table about employees of a company based on whether they are smokers or nonsmokers and whether or not
they suffer from any allergies, what is the probability of both suffering from allergies and not suffering from allergies?
Suffer from Allergies
Don't Suffer from Allergies
Total
Smoker
35
25
60
Nonsmoker
55
185
240
Total
90
210
300
✗ A) 1.00.
✓ B) 0.00.
✗ C) 0.50.
Explanation
These are mutually exclusive, so the joint probability is zero.
References
Question From: Session 2 > Reading 9 > LOS f
Related Material:
Key Concepts by LOS
Question #46 of 119
Question ID: 413091
The covariance of returns on two investments over a 10-year period is 0.009. If the variance of returns for investment A is 0.020
and the variance of returns for investment B is 0.033, what is the correlation coefficient for the returns?
✓ A) 0.350.
✗ B) 0.687.
✗ C) 0.444.
Explanation
The correlation coefficient is: Cov(A,B) / [(Std Dev A)(Std Dev B)] = 0.009 / [(√0.02)(√0.033)] = 0.350.
References
Question From: Session 2 > Reading 9 > LOS k
Related Material:
Key Concepts by LOS
Question #47 of 119
Which of the following sets of numbers does NOT meet the requirements for a set of probabilities?
Question ID: 413029