CFA 2019 level 1 schwesernotes book quiz bank SS 03 quiz 1 answers
Bạn đang xem bản rút gọn của tài liệu. Xem và tải ngay bản đầy đủ của tài liệu tại đây (808.67 KB, 64 trang )
SS 03 Quantitative Methods: Application
Question #1 of 126
Answers
Question ID: 413359
A survey is taken to determine whether the average starting salaries of CFA charterholders is equal to or greater than $59,000
per year. What is the test statistic given a sample of 135 newly acquired CFA charterholders with a mean starting salary of
$64,000 and a standard deviation of $5,500?
✓ A) 10.56.
✗ B) -10.56.
✗ C) 0.91.
Explanation
With a large sample size (135) the z-statistic is used. The z-statistic is calculated by subtracting the hypothesized parameter from
the parameter that has been estimated and dividing the difference by the standard error of the sample statistic. Here, the test
statistic = (sample mean - hypothesized mean) / (population standard deviation / (sample size)1/2) = (X − µ) / (σ / n1/2) = (64,000 59,000) / (5,500 / 1351/2) = (5,000) / (5,500 / 11.62) = 10.56.
References
Question From: Session 3 > Reading 12 > LOS c
Related Material:
Key Concepts by LOS
Question #2 of 126
Question ID: 413419
Which of the following technical analysis observations most likely represents a change in polarity?
✗ A) Bars on a candlestick chart change from empty to filled.
✗ B) Following an "X" column, a point-and-figure chart begins a new "O" column.
✓ C) A resistance level on a line chart is breached and later acts as a support level.
Explanation
"Change in polarity" refers to a perceived tendency for breached support levels to become resistance levels and breached
resistance levels to become support levels.
References
Question From: Session 3 > Reading 13 > LOS c
Related Material:
Key Concepts by LOS
Question #3 of 126
Question ID: 413389
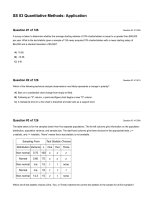
The table below is for five samples drawn from five separate populations. The far left columns give information on the population
distribution, population variance, and sample size. The right-hand columns give three choices for the appropriate tests: z =
z-statistic, and t = t-statistic. "None" means that a test statistic is not available.
Sampling From
Test Statistic Choices
Distribution Variance n
One
Two
Three
Non-normal
0.75
100
z
z
z
Normal
5.60
75
z
z
z
Non-normal
n/a
15
t
t
none
Normal
n/a
18
t
t
t
Non-normal
14.3
15
z
t
none
Which set of test statistic choices (One, Two, or Three) matches the correct test statistic to the sample for all five samples?
✗ A) Two.
✓ B) Three.
✗ C) One.
Explanation
For the exam: COMMIT THE FOLLOWING TABLE TO MEMORY!
When you are sampling from a:
Normal distribution with a known variance
Normal distribution with an unknown
variance
Nonnormal distribution with a known
variance
Nonnormal distribution with an unknown
variance
References
Question From: Session 3 > Reading 12 > LOS g
Related Material:
Key Concepts by LOS
and the sample size is small,
and the sample size is large,
use a:
use a:
z-statistic
z-statistic
t-statistic
t-statistic
not available
z-statistic
not available
t-statistic
Question #4 of 126
Question ID: 413404
A test of the population variance is equal to a hypothesized value requires the use of a test statistic that is:
✗ A) F-distributed.
✓ B) Chi-squared distributed.
✗ C) t-distributed.
Explanation
In tests of whether the variance of a population equals a particular value, the chi-squared test statistic is appropriate.
References
Question From: Session 3 > Reading 12 > LOS j
Related Material:
Key Concepts by LOS
Question #5 of 126
Question ID: 413427
A trend is most likely to continue if the price chart displays a(n):
✗ A) double top.
✗ B) inverse head and shoulders pattern.
✓ C) ascending triangle pattern.
Explanation
Triangles are considered to be continuation patterns. An inverse head and shoulders pattern would most likely indicate the
reversal of a downtrend, while a double top would most likely indicate the reversal of an uptrend.
References
Question From: Session 3 > Reading 13 > LOS d
Related Material:
Key Concepts by LOS
Question #6 of 126
Point and figure charts are most likely to illustrate:
✗ A) significant increases or decreases in volume.
✗ B) the length of time over which trends persist.
Question ID: 413417
✓ C) changes of direction in price trends.
Explanation
A point-and-figure chart includes only significant price changes, regardless of their timing or volume. The technician determines
what price interval to record as significiant (the box size) and when to note changes of direction in prices (the reversal size). Point
and figure charts do not show volume and are not scaled to even time periods.
References
Question From: Session 3 > Reading 13 > LOS b
Related Material:
Key Concepts by LOS
Question #7 of 126
Question ID: 413366
Which of the following statements about hypothesis testing is least accurate?
✗ A) A Type II error is the probability of failing to reject a null hypothesis that is not true.
✗ B) The significance level is the probability of making a Type I error.
✓ C) A Type I error is the probability of rejecting the null hypothesis when the null hypothesis is false.
Explanation
A Type I error is the probability of rejecting the null hypothesis when the null hypothesis is true.
References
Question From: Session 3 > Reading 12 > LOS c
Related Material:
Key Concepts by LOS
Question #8 of 126
Question ID: 498741
Asset allocation using technical analysis is most likely to be based on:
✓ A) intermarket analysis.
✗ B) a stochastic oscillator.
✗ C) correlations within asset classes.
Explanation
Intermarket analysis based on relative strength analysis is used to identify inflection points in the price trends of asset classes in
order to adjust asset class allocations.
References
Question From: Session 3 > Reading 13 > LOS h
Related Material:
Key Concepts by LOS
Question #9 of 126
Question ID: 413334
Jo Su believes that there should be a negative relation between returns and systematic risk. She intends to collect data on
returns and systematic risk to test this theory. What is the appropriate alternative hypothesis?
✗ A) Ha: ρ ≠ 0.
✓ B) Ha: ρ < 0.
✗ C) Ha: ρ > 0.
Explanation
The alternative hypothesis is determined by the theory or the belief. The researcher specifies the null as the hypothesis that she
wishes to reject (in favor of the alternative). The theory in this case is that the correlation is negative.
References
Question From: Session 3 > Reading 12 > LOS b
Related Material:
Key Concepts by LOS
Question #10 of 126
Question ID: 413436
A technical analyst who identifies a decennial pattern and a Kondratieff wave most likely:
✗ A) associates these phenomena with U.S. presidential elections.
✓ B) believes market prices move in cycles.
✗ C) is analyzing a daily or intraday price chart.
Explanation
The decennial pattern and the Kondratieff wave are cycles of ten and 54 years, respectively. A technical analyst would be most
likely to use these cycles to interpret long-term charts of monthly or annual data. Presidential elections in the United States are a
possible explanation for a four-year cycle.
References
Question From: Session 3 > Reading 13 > LOS f
Related Material:
Key Concepts by LOS
Question #11 of 126
Question ID: 413360
Which of the following statements regarding Type I and Type II errors is most accurate?
✗ A) A Type II error is rejecting the alternative hypothesis when it is actually true.
✓ B) A Type I error is rejecting the null hypothesis when it is actually true.
✗ C) A Type I error is failing to reject the null hypothesis when it is actually false.
Explanation
A Type I Error is defined as rejecting the null hypothesis when it is actually true. The probability of committing a Type I error is the
risk level or alpha risk.
References
Question From: Session 3 > Reading 12 > LOS c
Related Material:
Key Concepts by LOS
Question #12 of 126
One of the assumptions of technical analysis is:
✗ A) all analysts have all current information.
✗ B) the market is efficient.
✓ C) supply and demand are driven by rational and irrational behavior.
Explanation
The market is driven by rational and irrational behavior.
References
Question From: Session 3 > Reading 13 > LOS a
Related Material:
Key Concepts by LOS
Question ID: 413413
Question #13 of 126
Question ID: 413372
For a two-tailed test of hypothesis involving a z-distributed test statistic and a 5% level of significance, a calculated z-statistic of
1.5 indicates that:
✗ A) the test is inconclusive.
✗ B) the null hypothesis is rejected.
✓ C) the null hypothesis cannot be rejected.
Explanation
For a two-tailed test at a 5% level of significance the calculated z-statistic would have to be greater than the critical z value of
1.96 for the null hypothesis to be rejected.
References
Question From: Session 3 > Reading 12 > LOS c
Related Material:
Key Concepts by LOS
Question #14 of 126
Question ID: 413356
Identify the error type associated with the level of significance and the meaning of a 5 percent significance level.
α = 0.05 means there is
Error type
a 5 percent probability
of
✗ A)
✓ B)
✗ C)
Type I error
Type I error
Type II error
failing to reject a true
null hypothesis
rejecting a true null
hypothesis
rejecting a true null
hypothesis
Explanation
The significance level is the risk of making a Type 1 error and rejecting the null hypothesis when it is true.
References
Question From: Session 3 > Reading 12 > LOS c
Related Material:
Key Concepts by LOS
Question #15 of 126
Question ID: 434227
Student's t-Distribution
Level of Significance for One-Tailed Test
df 0.100 0.050 0.025 0.01 0.005 0.0005
Level of Significance for Two-Tailed Test
df 0.20
0.10
0.05
0.02
0.01
0.001
28 1.313 1.701 2.048 2.467 2.763
3.674
29 1.311 1.699 2.045 2.462 2.756
3.659
30 1.310 1.697 2.042 2.457 2.750
3.646
In order to test whether the mean IQ of employees in an organization is greater than 100, a sample of 30 employees is taken and
the sample value of the computed test statistic, tn-1 = 3.4. If you choose a 5% significance level you should:
✓ A) reject the null hypothesis and conclude that the population mean is greater that 100.
✗ B) fail to reject the null hypothesis and conclude that the population mean is less than or equal to 100.
✗ C) fail to reject the null hypothesis and conclude that the population mean is greater than 100.
Explanation
At a 5% significance level, the critical t-statistic using the Student's t distribution table for a one-tailed test and 29 degrees of
freedom (sample size of 30 less 1) is 1.699 (with a large sample size the critical z-statistic of 1.645 may be used). Because the
calculated t-statistic of 3.4 is greater than the critical t-statistic of 1.699, meaning that the calculated t-statistic is in the rejection
range, we reject the null hypothesis and we conclude that the population mean is greater than 100.
References
Question From: Session 3 > Reading 12 > LOS g
Related Material:
Key Concepts by LOS
Question #16 of 126
Which of the following is an accurate formulation of null and alternative hypotheses?
✗ A) Greater than for the null and less than or equal to for the alternative.
✗ B) Less than for the null and greater than for the alternative.
✓ C) Equal to for the null and not equal to for the alternative.
Explanation
A correctly formulated set of hypotheses will have the "equal to" condition in the null hypothesis.
References
Question ID: 448954
Question From: Session 3 > Reading 12 > LOS b
Related Material:
Key Concepts by LOS
Question #17 of 126
Question ID: 413363
If we fail to reject the null hypothesis when it is false, what type of error has occured?
✗ A) Type I.
✓ B) Type II.
✗ C) Type III.
Explanation
A Type II error is defined as failing to reject the null hypothesis when it is actually false.
References
Question From: Session 3 > Reading 12 > LOS c
Related Material:
Key Concepts by LOS
Question #18 of 126
Question ID: 434225
Student's t-Distribution
Level of Significance for One-Tailed Test
df 0.100 0.050 0.025 0.01 0.005 0.0005
Level of Significance for Two-Tailed Test
df 0.20
0.10
0.05
0.02
0.01
0.001
40 1.303 1.684 2.021 2.423 2.704
3.551
Ken Wallace is interested in testing whether the average price to earnings (P/E) of firms in the retail industry is 25. Using a
t-distributed test statistic and a 5% level of significance, the critical values for a sample of 41 firms is (are):
✗ A) -1.685 and 1.685.
✗ B) -1.96 and 1.96.
✓ C) -2.021 and 2.021.
Explanation
There are 41 − 1 = 40 degrees of freedom and the test is two-tailed. Therefore, the critical t-values are ± 2.021. The value 2.021
is the critical value for a one-tailed probability of 2.5%.
References
Question From: Session 3 > Reading 12 > LOS g
Related Material:
Key Concepts by LOS
Question #19 of 126
Question ID: 413392
In a test of the mean of a population, if the population variance is:
✗ A) unknown, a z-distributed test statistic is appropriate.
✗ B) known, a t-distributed test statistic is appropriate.
✓ C) known, a z-distributed test statistic is appropriate.
Explanation
If the population sampled has a known variance, the z-test is the correct test to use. In general, a t-test is used to test the mean
of a population when the population variance is unknown. Note that in special cases when the sample is extremely large, the
z-test may be used in place of the t-test, but the t-test is considered to be the test of choice when the population variance is
unknown.
References
Question From: Session 3 > Reading 12 > LOS g
Related Material:
Key Concepts by LOS
Question #20 of 126
Question ID: 413350
A researcher is testing whether the average age of employees in a large firm is statistically different from 35 years (either above
or below). A sample is drawn of 250 employees and the researcher determines that the appropriate critical value for the test
statistic is 1.96. The value of the computed test statistic is 4.35. Given this information, which of the following statements is least
accurate? The test:
✗ A) indicates that the researcher is 95% confident that the average employee age is different than 35
years.
✗ B) indicates that the researcher will reject the null hypothesis.
✓ C) has a significance level of 95%.
Explanation
This test has a significance level of 5%. The relationship between confidence and significance is: significance level = 1 −
confidence level. We know that the significance level is 5% because the sample size is large and the critical value of the test
statistic is 1.96 (2.5% of probability is in both the upper and lower tails).
References
Question From: Session 3 > Reading 12 > LOS c
Related Material:
Key Concepts by LOS
Question #21 of 126
Question ID: 413340
Given the following hypothesis:
The null hypothesis is H0 : µ = 5
The alternative is H1 : µ ≠ 5
The mean of a sample of 17 is 7
The population standard deviation is 2.0
What is the calculated z-statistic?
✗ A) 8.00.
✗ B) 4.00.
✓ C) 4.12.
Explanation
The z-statistic is calculated by subtracting the hypothesized parameter from the parameter that has been estimated and dividing
the difference by the standard error of the sample statistic. Here, the test statistic = (sample mean − hypothesized mean) /
(population standard deviation / (sample size)1/2 = (X − μ) / (σ / n1/2) = (7 − 5) / (2 / 171/2) = (2) / (2 / 4.1231) = 4.12.
References
Question From: Session 3 > Reading 12 > LOS g
Related Material:
Key Concepts by LOS
Question #22 of 126
Constructing a candlestick chart requires data on:
✗ A) high, low, and closing prices only.
✗ B) opening, high, low, and closing prices, and trading volume.
✓ C) opening, high, low, and closing prices only.
Explanation
Question ID: 413416
Candlestick charts require the open, high, low, and close for each trading period.
References
Question From: Session 3 > Reading 13 > LOS b
Related Material:
Key Concepts by LOS
Question #23 of 126
Question ID: 413425
A head and shoulders pattern is most likely to precede a reversal in trend if:
✗ A) volume decreases between the left shoulder and the head, then increases between the head and the
right shoulder.
✗ B) the left shoulder, the head, and the right shoulder occur on increasing volume.
✓ C) the left shoulder, the head, and the right shoulder occur on decreasing volume.
Explanation
Decreasing volume on each of the high prices in a head and shoulders pattern (or each of the low prices in an inverse head and
shoulders) suggests weakening in the supply and demand forces that were driving the price trend.
References
Question From: Session 3 > Reading 13 > LOS d
Related Material:
Key Concepts by LOS
Question #24 of 126
Question ID: 413385
An analyst is testing the hypothesis that the mean excess return from a trading strategy is less than or equal to zero. The analyst
reports that this hypothesis test produces a p-value of 0.034. This result most likely suggests that the:
✓ A) null hypothesis can be rejected at the 5% significance level.
✗ B) best estimate of the mean excess return produced by the strategy is 3.4%.
✗ C) smallest significance level at which the null hypothesis can be rejected is 6.8%.
Explanation
A p-value of 0.035 means the hypothesis can be rejected at a significance level of 3.5% or higher. Thus, the hypothesis can be
rejected at the 10% or 5% significance level, but cannot be rejected at the 1% significance level.
References
Question From: Session 3 > Reading 12 > LOS f
Related Material:
Key Concepts by LOS
Question #25 of 126
Question ID: 413423
A support level is the price range at which a technical analyst would expect the:
✗ A) supply of a stock to decrease substantially.
✓ B) demand for a stock to increase substantially.
✗ C) demand for a stock to decrease substantially.
Explanation
Support and resistance levels. Most stock prices remain relatively stable and fluctuate up and down from their true value. The
lower limit to these fluctuations is called a support level - the price range where a stock appears cheap and attracts buyers. The
upper limit is called a resistance level - the price range where a stock appears expensive and initiates selling.
Generally, a support level will develop after a stock has experienced a steady decline from a higher price level. Technicians
believe that, at some price below the recent peak, other investors will buy who did not buy prior to the first price increase and
have been waiting for a small reversal to get into the stock. When the price reaches this support price, demand surges and price
and volume begin to increase again.
References
Question From: Session 3 > Reading 13 > LOS c
Related Material:
Key Concepts by LOS
Question #26 of 126
Question ID: 434222
Student's t-Distribution
Level of Significance for One-Tailed Test
df 0.100 0.050 0.025 0.01 0.005 0.0005
Level of Significance for Two-Tailed Test
df 0.20
0.10
0.05
0.02
0.01
0.001
18 1.330 1.734 2.101 2.552 2.878
3.922
19 1.328 1.729 2.093 2.539 2.861
3.883
20 1.325 1.725 2.086 2.528 2.845
3.850
21 1.323 1.721 2.080 2.518 2.831
3.819
In a two-tailed test of a hypothesis concerning whether a population mean is zero, Jack Olson computes a t-statistic of 2.7 based
on a sample of 20 observations where the distribution is normal. If a 5% significance level is chosen, Olson should:
✗ A) fail to reject the null hypothesis that the population mean is not significantly different from zero.
✗ B) reject the null hypothesis and conclude that the population mean is not significantly different from
zero.
✓ C) reject the null hypothesis and conclude that the population mean is significantly different from zero.
Explanation
At a 5% significance level, the critical t-statistic using the Student's t-distribution table for a two-tailed test and 19 degrees of
freedom (sample size of 20 less 1) is ± 2.093 (with a large sample size the critical z-statistic of 1.960 may be used). Because the
critical t-statistic of 2.093 is to the left of the calculated t-statistic of 2.7, meaning that the calculated t-statistic is in the rejection
range, we reject the null hypothesis and we conclude that the population mean is significantly different from zero.
References
Question From: Session 3 > Reading 12 > LOS g
Related Material:
Key Concepts by LOS
Question #27 of 126
Question ID: 413348
Susan Bellows is comparing the return on equity for two industries. She is convinced that the return on equity for the discount
retail industry (DR) is greater than that of the luxury retail (LR) industry. What are the hypotheses for a test of her comparison of
return on equity?
✗ A) H0: µDR = µLR versus Ha: µDR < µLR.
✗ B) H0: µDR = µLR versus Ha: µDR ≠ µLR.
✓ C) H0: µDR ≤ µLR versus Ha: µDR > µLR.
Explanation
The alternative hypothesis is determined by the theory or the belief. The researcher specifies the null as the hypothesis that she
wishes to reject (in favor of the alternative). Note that this is a one-sided alternative because of the "greater than" belief.
References
Question From: Session 3 > Reading 12 > LOS b
Related Material:
Key Concepts by LOS
Question #28 of 126
Question ID: 599869
Simone Mak is a television network advertising executive. One of her responsibilities is selling commercial spots for a successful weekly
sitcom. If the average share of viewers for this season exceeds 8.5%, she can raise the advertising rates by 50% for the next season. The
population of viewer shares is normally distributed. A sample of the past 18 episodes results in a mean share of 9.6% with a standard
deviation of 10.0%. If Mak is willing to make a Type 1 error with a 5% probability, which of the following statements is most accurate?
✓ A) Mak cannot charge a higher rate next season for advertising spots based on this sample.
✗ B) With an unknown population variance and a small sample size, Mak cannot test a hypothesis based on her
sample data.
✗ C) The null hypothesis Mak needs to test is that the mean share of viewers is greater than 8.5%.
Explanation
Mak cannot conclude with 95% confidence that the average share of viewers for the show this season exceeds 8.5 and thus she cannot
charge a higher advertising rate next season.
Hypothesis testing process:
Step 1: State the hypothesis. Null hypothesis: mean ≤ 8.5%; Alternative hypothesis: mean > 8.5%
Step 2: Select the appropriate test statistic. Use a t statistic because we have a normally distributed population with an unknown variance
(we are given only the sample variance) and a small sample size (less than 30). If the population were not normally distributed, no test
would be available to use with a small sample size.
Step 3: Specify the level of significance. The significance level is the probability of a Type I error, or 0.05.
Step 4: State the decision rule. This is a one-tailed test. The critical value for this question will be the t-statistic that corresponds to a
significance level of 0.05 and n-1 or 17 degrees of freedom. Using the t-table, we determine that we will reject the null hypothesis if the
calculated test statistic is greater than the critical value of 1.74.
Step 5: Calculate the sample (test) statistic. The test statistic = t = (9.6 - 8.5) / (10.0 / √ 18) = 0.4667. (Note: Remember to use standard
error in the denominator because we are testing a hypothesis about the population mean based on the mean of 18 observations.)
Step 6: Make a decision. The calculated statistic is less than the critical value. Mak cannot conclude with 95% confidence that the mean
share of viewers exceeds 8.5% and thus she cannot charge higher rates.
Note: By eliminating the two incorrect choices, you can select the correct response to this question without performing the calculations.
References
Question From: Session 3 > Reading 12 > LOS g
Related Material:
Key Concepts by LOS
Question #29 of 126
Which of the following statements about hypothesis testing is most accurate?
✗ A) If you can disprove the null hypothesis, then you have proven the alternative hypothesis.
✓ B) The probability of a Type I error is equal to the significance level of the test.
✗ C) The power of a test is one minus the probability of a Type I error.
Question ID: 413343
Explanation
The probability of getting a test statistic outside the critical value(s) when the null is true is the level of significance and is the
probability of a Type I error. The power of a test is 1 minus the probability of a Type II error. Hypothesis testing does not prove a
hypothesis, we either reject the null or fail to reject it.
References
Question From: Session 3 > Reading 12 > LOS d
Related Material:
Key Concepts by LOS
Question #30 of 126
Question ID: 498737
For a test of the equality of the means of two normally distributed independent populations, the appropriate test statistic follows a:
✗ A) chi square distribution.
✓ B) t-distribution.
✗ C) F-distribution.
Explanation
The test statistic for the equality of the means of two normally distributed independent populations is a t-statistic and equality is
rejected if it lies outside the upper and lower critical values.
References
Question From: Session 3 > Reading 12 > LOS h
Related Material:
Key Concepts by LOS
Question #31 of 126
Question ID: 413327
Which one of the following best characterizes the alternative hypothesis? The alternative hypothesis is usually the:
✓ A) hoped-for outcome.
✗ B) hypothesis that is accepted after a statistical test is conducted.
✗ C) hypothesis to be proved through statistical testing.
Explanation
The alternative hypothesis is typically the hypothesis that a researcher hopes to support after a statistical test is carried out. We
can reject or fail to reject the null, not 'prove' a hypothesis.
References
Question From: Session 3 > Reading 12 > LOS a
Related Material:
Key Concepts by LOS
Question #32 of 126
Question ID: 413347
In the process of hypothesis testing, what is the proper order for these steps?
✗ A) Collect the sample and calculate the sample statistics. State the hypotheses. Specify the level of
significance. Make a decision.
✓ B) State the hypotheses. Specify the level of significance. Collect the sample and calculate the test
statistics. Make a decision.
✗ C) Specify the level of significance. State the hypotheses. Make a decision. Collect the sample and
calculate the sample statistics.
Explanation
The hypotheses must be established first. Then the test statistic is chosen and the level of significance is determined. Following
these steps, the sample is collected, the test statistic is calculated, and the decision is made.
References
Question From: Session 3 > Reading 12 > LOS a
Related Material:
Key Concepts by LOS
Question #33 of 126
Question ID: 710151
Which of the following technical analysis indicators is least accurately described as an oscillator?
✗ A) Moving Average Convergence/Divergence.
✓ B) Bollinger bands.
✗ C) Relative Strength Index.
Explanation
Bollinger bands are price-based indicators with unbounded values. Oscillators, such as the MACD and RSI, are indexed around
a given value (such as zero) or within a given range (such as zero to 100).
References
Question From: Session 3 > Reading 13 > LOS e
Related Material:
Key Concepts by LOS
Question #34 of 126
Question ID: 434221
Student's t-Distribution
Level of Significance for One-Tailed Test
df 0.100 0.050 0.025 0.01 0.005 0.0005
Level of Significance for Two-Tailed Test
df 0.20
0.10
0.05
0.02
0.01
0.001
28 1.313 1.701 2.048 2.467 2.763
3.674
29 1.311 1.699 2.045 2.462 2.756
3.659
30 1.310 1.697 2.042 2.457 2.750
3.646
In order to test if the mean IQ of employees in an organization is greater than 100, a sample of 30 employees is taken and the
sample value of the computed test statistic, tn-1 = 1.2. If you choose a 5% significance level you should:
✗ A) fail to reject the null hypothesis and conclude that the population mean is greater than 100.
✓ B) fail to reject the null hypothesis and conclude that the population mean is not greater than 100.
✗ C) reject the null hypothesis and conclude that the population mean is greater than 100.
Explanation
At a 5% significance level, the critical t-statistic using the Student's t distribution table for a one-tailed test and 29 degrees of
freedom (sample size of 30 less 1) is 1.699 (with a large sample size the critical z-statistic of 1.645 may be used). Because the
critical t-statistic is greater than the calculated t-statistic, meaning that the calculated t-statistic is not in the rejection range, we fail
to reject the null hypothesis and we conclude that the population mean is not significantly greater than 100.
References
Question From: Session 3 > Reading 12 > LOS g
Related Material:
Key Concepts by LOS
Question #35 of 126
Question ID: 413358
A survey is taken to determine whether the average starting salaries of CFA charterholders is equal to or greater than $58,500
per year. What is the test statistic given a sample of 175 newly acquired CFA charterholders with a mean starting salary of
$67,000 and a standard deviation of $5,200?
✓ A) 21.62.
✗ B) -1.63.
✗ C) 1.63.
Explanation
With a large sample size (175) the z-statistic is used. The z-statistic is calculated by subtracting the hypothesized parameter from
the parameter that has been estimated and dividing the difference by the standard error of the sample statistic. Here, the test
statistic = (sample mean - hypothesized mean) / (population standard deviation / (sample size)1/2 = (X − µ) / (σ / n1/2) = (67,000 58,500) / (5,200 / 1751/2) = (8,500) / (5,200 / 13.22) = 21.62.
References
Question From: Session 3 > Reading 12 > LOS c
Related Material:
Key Concepts by LOS
Question #36 of 126
Question ID: 413367
Which of the following statements about hypothesis testing is most accurate? A Type I error is the probability of:
✓ A) rejecting a true null hypothesis.
✗ B) failing to reject a false hypothesis.
✗ C) rejecting a true alternative hypothesis.
Explanation
The Type I error is the error of rejecting the null hypothesis when, in fact, the null is true.
References
Question From: Session 3 > Reading 12 > LOS c
Related Material:
Key Concepts by LOS
Question #37 of 126
Question ID: 434226
Student's t-Distribution
Level of Significance for One-Tailed Test
df 0.100 0.050 0.025 0.01 0.005 0.0005
Level of Significance for Two-Tailed Test
df 0.20
0.10
0.05
0.02
0.01
0.001
18 1.330 1.734 2.101 2.552 2.878
3.922
19 1.328 1.729 2.093 2.539 2.861
3.883
20 1.325 1.725 2.086 2.528 2.845
3.850
21 1.323 1.721 2.080 2.518 2.831
3.819
In a two-tailed hypothesis test, Jack Olson observes a t-statistic of -1.38 based on a sample of 20 observations where the
population mean is zero. If you choose a 5% significance level, you should:
✗ A) reject the null hypothesis and conclude that the population mean is significantly different from zero.
✗ B) reject the null hypothesis and conclude that the population mean is not significantly different from
zero.
✓ C) fail to reject the null hypothesis that the population mean is not significantly different from zero.
Explanation
At a 5% significance level, the critical t-statistic using the Student's t distribution table for a two-tailed test and 19 degrees of
freedom (sample size of 20 less 1) is ± 2.093 (with a large sample size the critical z-statistic of 1.960 may be used). Because the
critical t-statistic of -2.093 is to the left of the calculated t-statistic of -1.38, meaning that the calculated t-statistic is not in the
rejection range, we fail to reject the null hypothesis that the population mean is not significantly different from zero.
References
Question From: Session 3 > Reading 12 > LOS g
Related Material:
Key Concepts by LOS
Question #38 of 126
Question ID: 413438
Elliott wave theory describes the typical pattern of price movements as:
✗ A) four waves with the direction of the trend, followed by three waves against the direction of the trend.
✗ B) five waves with the direction of the trend, followed by four waves against the direction of the trend.
✓ C) five waves with the direction of the trend, followed by three waves against the direction of the trend.
Explanation
According to Elliott wave theory, prices tend to move in five waves with the direction of the trend and three waves against the
direction of the trend.
References
Question From: Session 3 > Reading 13 > LOS g
Related Material:
Key Concepts by LOS
Question #39 of 126
Question ID: 413355
A survey is taken to determine whether the average starting salaries of CFA charterholders is equal to or greater than $57,000
per year. Assuming a normal distribution, what is the test statistic given a sample of 115 newly acquired CFA charterholders with
a mean starting salary of $65,000 and a standard deviation of $4,500?
✗ A) -19.06.
✗ B) 1.78.
✓ C) 19.06.
Explanation
With a large sample size (115) the z-statistic is used. The z-statistic is calculated by subtracting the hypothesized parameter from
the parameter that has been estimated and dividing the difference by the standard error of the sample statistic. Here, the test
statistic = (sample mean - hypothesized mean) / (population standard deviation / (sample size)1/2 = (X − µ) / (σ / n1/2) = (65,000 57,000) / (4,500 / 1151/2) = (8,000) / (4,500 / 10.72) = 19.06.
References
Question From: Session 3 > Reading 12 > LOS c
Related Material:
Key Concepts by LOS
Question #40 of 126
Question ID: 413352
If the probability of a Type I error decreases, then the probability of:
✗ A) incorrectly rejecting the null increases.
✓ B) a Type II error increases.
✗ C) incorrectly accepting the null decreases.
Explanation
If P(Type I error) decreases, then P(Type II error) increases. A null hypothesis is never accepted. We can only fail to reject the null.
References
Question From: Session 3 > Reading 12 > LOS c
Related Material:
Key Concepts by LOS
Question #41 of 126
Question ID: 413407
The use of the F-distributed test statistic, F = s12 / s22, to compare the variances of two populations does NOT require which of
the following?
✗ A) populations are normally distributed.
✗ B) samples are independent of one another.
✓ C) two samples are of the same size.
Explanation
The F-statistic can be computed using samples of different sizes. That is, n1 need not be equal to n2.
References
Question From: Session 3 > Reading 12 > LOS j
Related Material:
Key Concepts by LOS
Question #42 of 126
Question ID: 413349
Which of the following statements about testing a hypothesis using a Z-test is least accurate?
✗ A) If the calculated Z-statistic lies outside the critical Z-statistic range, the null hypothesis can be
rejected.
✗ B) The confidence interval for a two-tailed test of a population mean at the 5% level of significance is
that the sample mean falls between ±1.96 σ/√n of the null hypothesis value.
✓ C) The calculated Z-statistic determines the appropriate significance level to use.
Explanation
The significance level is chosen before the test so the calculated Z-statistic can be compared to an appropriate critical value.
References
Question From: Session 3 > Reading 12 > LOS g
Related Material:
Key Concepts by LOS
Question #43 of 126
Question ID: 413331
George Appleton believes that the average return on equity in the amusement industry, µ, is greater than 10%. What is the null
(H0) and alternative (Ha) hypothesis for his study?
✓ A) H0: ≤ 0.10 versus Ha: > 0.10.
✗ B) H0: > 0.10 versus Ha: < 0.10.
✗ C) H0: > 0.10 versus Ha: ≤ 0.10.
Explanation
The alternative hypothesis is determined by the theory or the belief. The researcher specifies the null as the hypothesis that he
wishes to reject (in favor of the alternative). Note that this is a one-sided alternative because of the "greater than" belief.
References
Question From: Session 3 > Reading 12 > LOS b
Related Material:
Key Concepts by LOS
Question #44 of 126
Question ID: 710150
A technical analyst who wishes to observe the state of capital flows in the financial markets is least likely to examine:
✓ A) the short interest ratio.
✗ B) margin debt.
✗ C) the cash position of mutual funds.
Explanation
The short interest ratio is most commonly interpreted as an indicator of investor sentiment. Mutual fund cash positions are an
indicator of the flow of funds in financial markets. The level of margin debt can be useful as an indicator of both investor
sentiment and the flow of funds.
References
Question From: Session 3 > Reading 13 > LOS e
Related Material:
Key Concepts by LOS
Question #45 of 126
Question ID: 413382
Of the following explanations, which is least likely to be a valid explanation for divergence between statistical significance and
economic significance?
✗ A) Transactions costs.
✓ B) Data errors.
✗ C) Adjustment for risk.
Explanation
While data errors would certainly come to bear on the analysis, in their presence we would not be able to assert either statistical
or economic significance. In other words, data errors are not a valid explanation. The others are all mitigating factors that can
cause statistically significant results to be less than economically significant.
References
Question From: Session 3 > Reading 12 > LOS e
Related Material:
Key Concepts by LOS
Question #46 of 126
Question ID: 413433
Which of the following would a technical analyst most likely interpret as a "buy" signal?
✗ A) 20-day moving average crosses below a 100-day moving average.
✓ B) 10-day moving average crosses above a 60-day moving average.
✗ C) 30-day moving average crosses above a 5-day moving average.
Explanation
When using moving averages to generate trading signals, a "golden cross" of a shorter-term average above a longer-term
average is a buy signal, while a "dead cross" under the longer-term average is a sell signal.
References
Question From: Session 3 > Reading 13 > LOS e
Related Material:
Key Concepts by LOS
Question #47 of 126
Question ID: 498738
For a test of the equality of the mean returns of two non-independent populations based on a sample, the numerator of the
appropriate test statistic is the:
✓ A) average difference between pairs of returns.
✗ B) larger of the two sample means.
✗ C) difference between the sample means for each population.
Explanation
A hypothesis test of the equality of the means of two normally distributed non-independent populations (hypothesized mean
difference = 0) is a t-test and the numerator is the average difference between the sample returns over the sample period.
References
Question From: Session 3 > Reading 12 > LOS i
Related Material:
Key Concepts by LOS
Question #48 of 126
Question ID: 413376
A bottler of iced tea wishes to ensure that an average of 16 ounces of tea is in each bottle. In order to analyze the accuracy of
the bottling process, a random sample of 150 bottles is taken. Using a t-distributed test statistic of -1.09 and a 5% level of
significance, the bottler should:
✗ A) not reject the null hypothesis and conclude that bottles do not contain an average of 16 ounces of
tea.
✓ B) not reject the null hypothesis and conclude that bottles contain an average 16 ounces of tea.
✗ C) reject the null hypothesis and conclude that bottles contain an average 16 ounces of tea.
Explanation
Ho: µ = 16; Ha: µ ≠ 16. Do not reject the null since |t| = 1.09 < 1.96 (critical value).
References
Question From: Session 3 > Reading 12 > LOS d
Related Material:
Key Concepts by LOS
Question #49 of 126
Question ID: 413325
James Ambercrombie believes that the average return on equity in the utility industry, µ, is greater than 10%. What is null (H0)
and alternative (Ha) hypothesis for his study?
✗ A) H0: µ ≥ 0.10 versus Ha: µ < 0.10.
✓ B) H0: µ ≤ 0.10 versus Ha: µ > 0.10.
✗ C) H0: µ = 0.10 versus Ha: µ ≠ 0.10.
Explanation
This is a one-sided alternative because of the "greater than" belief. We expect to reject the null.
References
Question From: Session 3 > Reading 12 > LOS b
Related Material:
Key Concepts by LOS
Question #50 of 126
Which of the following statements about parametric and nonparametric tests is least accurate?
Question ID: 413409