CFA 2019 level 1 schwesernotes book quiz bank SS 03 quiz 1
Bạn đang xem bản rút gọn của tài liệu. Xem và tải ngay bản đầy đủ của tài liệu tại đây (551.7 KB, 35 trang )
SS 03 Quantitative Methods: Application
Question #1 of 126
Question ID: 413359
A survey is taken to determine whether the average starting salaries of CFA charterholders is equal to or greater than $59,000
per year. What is the test statistic given a sample of 135 newly acquired CFA charterholders with a mean starting salary of
$64,000 and a standard deviation of $5,500?
A) 10.56.
B) -10.56.
C) 0.91.
Question #2 of 126
Question ID: 413419
Which of the following technical analysis observations most likely represents a change in polarity?
A) Bars on a candlestick chart change from empty to filled.
B) Following an "X" column, a point-and-figure chart begins a new "O" column.
C) A resistance level on a line chart is breached and later acts as a support level.
Question #3 of 126
Question ID: 413389
The table below is for five samples drawn from five separate populations. The far left columns give information on the population
distribution, population variance, and sample size. The right-hand columns give three choices for the appropriate tests: z =
z-statistic, and t = t-statistic. "None" means that a test statistic is not available.
Sampling From
Test Statistic Choices
Distribution Variance n
One
Two
Three
Non-normal
0.75
100
z
z
z
Normal
5.60
75
z
z
z
Non-normal
n/a
15
t
t
none
Normal
n/a
18
t
t
t
Non-normal
14.3
15
z
t
none
Which set of test statistic choices (One, Two, or Three) matches the correct test statistic to the sample for all five samples?
A) Two.
B) Three.
C) One.
Question #4 of 126
Question ID: 413404
A test of the population variance is equal to a hypothesized value requires the use of a test statistic that is:
A) F-distributed.
B) Chi-squared distributed.
C) t-distributed.
Question #5 of 126
Question ID: 413427
A trend is most likely to continue if the price chart displays a(n):
A) double top.
B) inverse head and shoulders pattern.
C) ascending triangle pattern.
Question #6 of 126
Question ID: 413417
Point and figure charts are most likely to illustrate:
A) significant increases or decreases in volume.
B) the length of time over which trends persist.
C) changes of direction in price trends.
Question #7 of 126
Which of the following statements about hypothesis testing is least accurate?
A) A Type II error is the probability of failing to reject a null hypothesis that is not true.
B) The significance level is the probability of making a Type I error.
C) A Type I error is the probability of rejecting the null hypothesis when the null hypothesis is false.
Question ID: 413366
Question #8 of 126
Question ID: 498741
Asset allocation using technical analysis is most likely to be based on:
A) intermarket analysis.
B) a stochastic oscillator.
C) correlations within asset classes.
Question #9 of 126
Question ID: 413334
Jo Su believes that there should be a negative relation between returns and systematic risk. She intends to collect data on
returns and systematic risk to test this theory. What is the appropriate alternative hypothesis?
A) Ha: ρ ≠ 0.
B) Ha: ρ < 0.
C) Ha: ρ > 0.
Question #10 of 126
Question ID: 413436
A technical analyst who identifies a decennial pattern and a Kondratieff wave most likely:
A) associates these phenomena with U.S. presidential elections.
B) believes market prices move in cycles.
C) is analyzing a daily or intraday price chart.
Question #11 of 126
Question ID: 413360
Which of the following statements regarding Type I and Type II errors is most accurate?
A) A Type II error is rejecting the alternative hypothesis when it is actually true.
B) A Type I error is rejecting the null hypothesis when it is actually true.
C) A Type I error is failing to reject the null hypothesis when it is actually false.
Question #12 of 126
Question ID: 413413
One of the assumptions of technical analysis is:
A) all analysts have all current information.
B) the market is efficient.
C) supply and demand are driven by rational and irrational behavior.
Question #13 of 126
Question ID: 413372
For a two-tailed test of hypothesis involving a z-distributed test statistic and a 5% level of significance, a calculated z-statistic of
1.5 indicates that:
A) the test is inconclusive.
B) the null hypothesis is rejected.
C) the null hypothesis cannot be rejected.
Question #14 of 126
Question ID: 413356
Identify the error type associated with the level of significance and the meaning of a 5 percent significance level.
α = 0.05 means there is
Error type
a 5 percent probability
of
A)
B)
C)
Type I error
Type I error
Type II error
failing to reject a true
null hypothesis
rejecting a true null
hypothesis
rejecting a true null
hypothesis
Question #15 of 126
Question ID: 434227
Student's t-Distribution
Level of Significance for One-Tailed Test
df 0.100 0.050 0.025 0.01 0.005 0.0005
Level of Significance for Two-Tailed Test
df 0.20
0.10
0.05
0.02
0.01
0.001
28 1.313 1.701 2.048 2.467 2.763
3.674
29 1.311 1.699 2.045 2.462 2.756
3.659
30 1.310 1.697 2.042 2.457 2.750
3.646
In order to test whether the mean IQ of employees in an organization is greater than 100, a sample of 30 employees is taken and
the sample value of the computed test statistic, tn-1 = 3.4. If you choose a 5% significance level you should:
A) reject the null hypothesis and conclude that the population mean is greater that 100.
B) fail to reject the null hypothesis and conclude that the population mean is less than or equal to 100.
C) fail to reject the null hypothesis and conclude that the population mean is greater than 100.
Question #16 of 126
Question ID: 448954
Which of the following is an accurate formulation of null and alternative hypotheses?
A) Greater than for the null and less than or equal to for the alternative.
B) Less than for the null and greater than for the alternative.
C) Equal to for the null and not equal to for the alternative.
Question #17 of 126
Question ID: 413363
If we fail to reject the null hypothesis when it is false, what type of error has occured?
A) Type I.
B) Type II.
C) Type III.
Question #18 of 126
Question ID: 434225
Student's t-Distribution
Level of Significance for One-Tailed Test
df 0.100 0.050 0.025 0.01 0.005 0.0005
Level of Significance for Two-Tailed Test
df 0.20
0.10
0.05
0.02
0.01
0.001
40 1.303 1.684 2.021 2.423 2.704
3.551
Ken Wallace is interested in testing whether the average price to earnings (P/E) of firms in the retail industry is 25. Using a
t-distributed test statistic and a 5% level of significance, the critical values for a sample of 41 firms is (are):
A) -1.685 and 1.685.
B) -1.96 and 1.96.
C) -2.021 and 2.021.
Question #19 of 126
Question ID: 413392
In a test of the mean of a population, if the population variance is:
A) unknown, a z-distributed test statistic is appropriate.
B) known, a t-distributed test statistic is appropriate.
C) known, a z-distributed test statistic is appropriate.
Question #20 of 126
Question ID: 413350
A researcher is testing whether the average age of employees in a large firm is statistically different from 35 years (either above
or below). A sample is drawn of 250 employees and the researcher determines that the appropriate critical value for the test
statistic is 1.96. The value of the computed test statistic is 4.35. Given this information, which of the following statements is least
accurate? The test:
A) indicates that the researcher is 95% confident that the average employee age is different than 35
years.
B) indicates that the researcher will reject the null hypothesis.
C) has a significance level of 95%.
Question #21 of 126
Given the following hypothesis:
The null hypothesis is H0 : µ = 5
The alternative is H1 : µ ≠ 5
The mean of a sample of 17 is 7
The population standard deviation is 2.0
What is the calculated z-statistic?
Question ID: 413340
A) 8.00.
B) 4.00.
C) 4.12.
Question #22 of 126
Question ID: 413416
Constructing a candlestick chart requires data on:
A) high, low, and closing prices only.
B) opening, high, low, and closing prices, and trading volume.
C) opening, high, low, and closing prices only.
Question #23 of 126
Question ID: 413425
A head and shoulders pattern is most likely to precede a reversal in trend if:
A) volume decreases between the left shoulder and the head, then increases between the head and the
right shoulder.
B) the left shoulder, the head, and the right shoulder occur on increasing volume.
C) the left shoulder, the head, and the right shoulder occur on decreasing volume.
Question #24 of 126
Question ID: 413385
An analyst is testing the hypothesis that the mean excess return from a trading strategy is less than or equal to zero. The analyst
reports that this hypothesis test produces a p-value of 0.034. This result most likely suggests that the:
A) null hypothesis can be rejected at the 5% significance level.
B) best estimate of the mean excess return produced by the strategy is 3.4%.
C) smallest significance level at which the null hypothesis can be rejected is 6.8%.
Question #25 of 126
A support level is the price range at which a technical analyst would expect the:
A) supply of a stock to decrease substantially.
B) demand for a stock to increase substantially.
Question ID: 413423
C) demand for a stock to decrease substantially.
Question #26 of 126
Question ID: 434222
Student's t-Distribution
Level of Significance for One-Tailed Test
df 0.100 0.050 0.025 0.01 0.005 0.0005
Level of Significance for Two-Tailed Test
df 0.20
0.10
0.05
0.02
0.01
0.001
18 1.330 1.734 2.101 2.552 2.878
3.922
19 1.328 1.729 2.093 2.539 2.861
3.883
20 1.325 1.725 2.086 2.528 2.845
3.850
21 1.323 1.721 2.080 2.518 2.831
3.819
In a two-tailed test of a hypothesis concerning whether a population mean is zero, Jack Olson computes a t-statistic of 2.7 based
on a sample of 20 observations where the distribution is normal. If a 5% significance level is chosen, Olson should:
A) fail to reject the null hypothesis that the population mean is not significantly different from zero.
B) reject the null hypothesis and conclude that the population mean is not significantly different from
zero.
C) reject the null hypothesis and conclude that the population mean is significantly different from zero.
Question #27 of 126
Question ID: 413348
Susan Bellows is comparing the return on equity for two industries. She is convinced that the return on equity for the discount
retail industry (DR) is greater than that of the luxury retail (LR) industry. What are the hypotheses for a test of her comparison of
return on equity?
A) H0: µDR = µLR versus Ha: µDR < µLR.
B) H0: µDR = µLR versus Ha: µDR ≠ µLR.
C) H0: µDR ≤ µLR versus Ha: µDR > µLR.
Question #28 of 126
Question ID: 599869
Simone Mak is a television network advertising executive. One of her responsibilities is selling commercial spots for a successful weekly
sitcom. If the average share of viewers for this season exceeds 8.5%, she can raise the advertising rates by 50% for the next season. The
population of viewer shares is normally distributed. A sample of the past 18 episodes results in a mean share of 9.6% with a standard
deviation of 10.0%. If Mak is willing to make a Type 1 error with a 5% probability, which of the following statements is most accurate?
A) Mak cannot charge a higher rate next season for advertising spots based on this sample.
B) With an unknown population variance and a small sample size, Mak cannot test a hypothesis based on her
sample data.
C) The null hypothesis Mak needs to test is that the mean share of viewers is greater than 8.5%.
Question #29 of 126
Question ID: 413343
Which of the following statements about hypothesis testing is most accurate?
A) If you can disprove the null hypothesis, then you have proven the alternative hypothesis.
B) The probability of a Type I error is equal to the significance level of the test.
C) The power of a test is one minus the probability of a Type I error.
Question #30 of 126
Question ID: 498737
For a test of the equality of the means of two normally distributed independent populations, the appropriate test statistic follows a:
A) chi square distribution.
B) t-distribution.
C) F-distribution.
Question #31 of 126
Question ID: 413327
Which one of the following best characterizes the alternative hypothesis? The alternative hypothesis is usually the:
A) hoped-for outcome.
B) hypothesis that is accepted after a statistical test is conducted.
C) hypothesis to be proved through statistical testing.
Question #32 of 126
In the process of hypothesis testing, what is the proper order for these steps?
A) Collect the sample and calculate the sample statistics. State the hypotheses. Specify the level of
significance. Make a decision.
Question ID: 413347
B) State the hypotheses. Specify the level of significance. Collect the sample and calculate the test
statistics. Make a decision.
C) Specify the level of significance. State the hypotheses. Make a decision. Collect the sample and
calculate the sample statistics.
Question #33 of 126
Question ID: 710151
Which of the following technical analysis indicators is least accurately described as an oscillator?
A) Moving Average Convergence/Divergence.
B) Bollinger bands.
C) Relative Strength Index.
Question #34 of 126
Question ID: 434221
Student's t-Distribution
Level of Significance for One-Tailed Test
df 0.100 0.050 0.025 0.01 0.005 0.0005
Level of Significance for Two-Tailed Test
df 0.20
0.10
0.05
0.02
0.01
0.001
28 1.313 1.701 2.048 2.467 2.763
3.674
29 1.311 1.699 2.045 2.462 2.756
3.659
30 1.310 1.697 2.042 2.457 2.750
3.646
In order to test if the mean IQ of employees in an organization is greater than 100, a sample of 30 employees is taken and the
sample value of the computed test statistic, tn-1 = 1.2. If you choose a 5% significance level you should:
A) fail to reject the null hypothesis and conclude that the population mean is greater than 100.
B) fail to reject the null hypothesis and conclude that the population mean is not greater than 100.
C) reject the null hypothesis and conclude that the population mean is greater than 100.
Question #35 of 126
Question ID: 413358
A survey is taken to determine whether the average starting salaries of CFA charterholders is equal to or greater than $58,500
per year. What is the test statistic given a sample of 175 newly acquired CFA charterholders with a mean starting salary of
$67,000 and a standard deviation of $5,200?
A) 21.62.
B) -1.63.
C) 1.63.
Question #36 of 126
Question ID: 413367
Which of the following statements about hypothesis testing is most accurate? A Type I error is the probability of:
A) rejecting a true null hypothesis.
B) failing to reject a false hypothesis.
C) rejecting a true alternative hypothesis.
Question #37 of 126
Question ID: 434226
Student's t-Distribution
Level of Significance for One-Tailed Test
df 0.100 0.050 0.025 0.01 0.005 0.0005
Level of Significance for Two-Tailed Test
df 0.20
0.10
0.05
0.02
0.01
0.001
18 1.330 1.734 2.101 2.552 2.878
3.922
19 1.328 1.729 2.093 2.539 2.861
3.883
20 1.325 1.725 2.086 2.528 2.845
3.850
21 1.323 1.721 2.080 2.518 2.831
3.819
In a two-tailed hypothesis test, Jack Olson observes a t-statistic of -1.38 based on a sample of 20 observations where the
population mean is zero. If you choose a 5% significance level, you should:
A) reject the null hypothesis and conclude that the population mean is significantly different from zero.
B) reject the null hypothesis and conclude that the population mean is not significantly different from
zero.
C) fail to reject the null hypothesis that the population mean is not significantly different from zero.
Question #38 of 126
Elliott wave theory describes the typical pattern of price movements as:
Question ID: 413438
A) four waves with the direction of the trend, followed by three waves against the direction of the trend.
B) five waves with the direction of the trend, followed by four waves against the direction of the trend.
C) five waves with the direction of the trend, followed by three waves against the direction of the trend.
Question #39 of 126
Question ID: 413355
A survey is taken to determine whether the average starting salaries of CFA charterholders is equal to or greater than $57,000
per year. Assuming a normal distribution, what is the test statistic given a sample of 115 newly acquired CFA charterholders with
a mean starting salary of $65,000 and a standard deviation of $4,500?
A) -19.06.
B) 1.78.
C) 19.06.
Question #40 of 126
Question ID: 413352
If the probability of a Type I error decreases, then the probability of:
A) incorrectly rejecting the null increases.
B) a Type II error increases.
C) incorrectly accepting the null decreases.
Question #41 of 126
Question ID: 413407
The use of the F-distributed test statistic, F = s12 / s22, to compare the variances of two populations does NOT require which of
the following?
A) populations are normally distributed.
B) samples are independent of one another.
C) two samples are of the same size.
Question #42 of 126
Which of the following statements about testing a hypothesis using a Z-test is least accurate?
Question ID: 413349
A) If the calculated Z-statistic lies outside the critical Z-statistic range, the null hypothesis can be
rejected.
B) The confidence interval for a two-tailed test of a population mean at the 5% level of significance is
that the sample mean falls between ±1.96 σ/√n of the null hypothesis value.
C) The calculated Z-statistic determines the appropriate significance level to use.
Question #43 of 126
Question ID: 413331
George Appleton believes that the average return on equity in the amusement industry, µ, is greater than 10%. What is the null
(H0) and alternative (Ha) hypothesis for his study?
A) H0: ≤ 0.10 versus Ha: > 0.10.
B) H0: > 0.10 versus Ha: < 0.10.
C) H0: > 0.10 versus Ha: ≤ 0.10.
Question #44 of 126
Question ID: 710150
A technical analyst who wishes to observe the state of capital flows in the financial markets is least likely to examine:
A) the short interest ratio.
B) margin debt.
C) the cash position of mutual funds.
Question #45 of 126
Question ID: 413382
Of the following explanations, which is least likely to be a valid explanation for divergence between statistical significance and
economic significance?
A) Transactions costs.
B) Data errors.
C) Adjustment for risk.
Question #46 of 126
Which of the following would a technical analyst most likely interpret as a "buy" signal?
Question ID: 413433
A) 20-day moving average crosses below a 100-day moving average.
B) 10-day moving average crosses above a 60-day moving average.
C) 30-day moving average crosses above a 5-day moving average.
Question #47 of 126
Question ID: 498738
For a test of the equality of the mean returns of two non-independent populations based on a sample, the numerator of the
appropriate test statistic is the:
A) average difference between pairs of returns.
B) larger of the two sample means.
C) difference between the sample means for each population.
Question #48 of 126
Question ID: 413376
A bottler of iced tea wishes to ensure that an average of 16 ounces of tea is in each bottle. In order to analyze the accuracy of
the bottling process, a random sample of 150 bottles is taken. Using a t-distributed test statistic of -1.09 and a 5% level of
significance, the bottler should:
A) not reject the null hypothesis and conclude that bottles do not contain an average of 16 ounces of
tea.
B) not reject the null hypothesis and conclude that bottles contain an average 16 ounces of tea.
C) reject the null hypothesis and conclude that bottles contain an average 16 ounces of tea.
Question #49 of 126
Question ID: 413325
James Ambercrombie believes that the average return on equity in the utility industry, µ, is greater than 10%. What is null (H0)
and alternative (Ha) hypothesis for his study?
A) H0: µ ≥ 0.10 versus Ha: µ < 0.10.
B) H0: µ ≤ 0.10 versus Ha: µ > 0.10.
C) H0: µ = 0.10 versus Ha: µ ≠ 0.10.
Question #50 of 126
Question ID: 413409
Which of the following statements about parametric and nonparametric tests is least accurate?
A) Nonparametric tests rely on population parameters.
B) The test of the mean of the differences is used when performing a paired comparison.
C) The test of the difference in means is used when you are comparing means from two independent
samples.
Question #51 of 126
Question ID: 413393
Which of the following statements about test statistics is least accurate?
A) In a test of the population mean, if the population variance is unknown, we should use a t-distributed
test statistic.
B) In the case of a test of the difference in means of two independent samples, we use a t-distributed
test statistic.
C) In a test of the population mean, if the population variance is unknown and the sample is small, we
should use a z-distributed test statistic.
Question #52 of 126
Question ID: 683837
Kyra Mosby, M.D., has a patient who is complaining of severe abdominal pain. Based on an examination and the results from laboratory
tests, Mosby states the following diagnosis hypothesis: Ho: Appendicitis, HA: Not Appendicitis. Dr. Mosby removes the patient's appendix
and the patient still complains of pain. Subsequent tests show that the gall bladder was causing the problem. By taking out the patient's
appendix, Dr. Mosby:
A) is correct.
B) made a Type II error.
C) made a Type I error.
Question #53 of 126
Question ID: 413374
For a t-distributed test statistic with 30 degrees of freedom, a one-tailed test specifying the parameter greater than some value
and a 95% confidence level, the critical value is:
A) 1.697.
B) 1.640.
C) 2.042.
Question #54 of 126
Question ID: 413344
Which of the following is the correct sequence of events for testing a hypothesis?
A) State the hypothesis, formulate the decision rule, select the level of significance, compute the test
statistic, and make a decision.
B) State the hypothesis, select the level of significance, formulate the decision rule, compute the test
statistic, and make a decision.
C) State the hypothesis, select the level of significance, compute the test statistic, formulate the
decision rule, and make a decision.
Question #55 of 126
Question ID: 434220
A researcher is testing the hypothesis that a population mean is equal to zero. From a sample with 64 observations, the
researcher calculates a sample mean of -2.5 and a sample standard deviation of 8.0. At which levels of significance should the
researcher reject the hypothesis?
1% significance
5% significance
10% significance
A) Reject
Fail to reject
Fail to reject
B) Fail to reject
Fail to reject
Reject
C) Fail to reject
Reject
Reject
Question #56 of 126
Question ID: 413388
A survey is taken to determine whether the average starting salaries of CFA charterholders is equal to or greater than $62,500
per year. What is the test statistic given a sample of 125 newly acquired CFA charterholders with a mean starting salary of
$65,000 and a standard deviation of $2,600?
A) 0.96.
B) -10.75.
C) 10.75.
Question #57 of 126
Question ID: 413420
The trend line for a stock in an uptrend is constructed by drawing a straight line through the:
A) highs.
B) periodic averages.
C) lows.
Question #58 of 126
Question ID: 498739
An analyst has calculated the sample variances for two random samples from independent normally distributed populations. The
test statistic for the hypothesis that the true population variances are equal is a(n):
A) t-statistic.
B) chi square statistic.
C) F-statistic.
Question #59 of 126
Question ID: 413397
A test of a hypothesis that the means of two normally distributed populations are equal based on two independent random
samples:
A) is based on a Chi Square statistic.
B) is done with a t-statistic.
C) is a paired-comparisons test.
Question #60 of 126
Question ID: 413396
Brandee Shoffield is the public relations manager for Night Train Express, a local sports team. Shoffield is trying to sell advertising spots
and wants to know if she can say with 90% confidence that average home game attendance is greater than 3,000. Attendance is
approximately normally distributed. A sample of the attendance at 15 home games results in a mean of 3,150 and a standard deviation of
450. Which of the following statements is most accurate?
A) With an unknown population variance and a small sample size, no statistic is available to test Shoffield's
hypothesis.
B) Shoffield should use a two-tailed Z-test.
C) The calculated test statistic is 1.291.
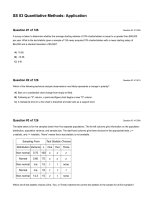
Question #61 of 126
Question ID: 413400
Joe Sutton is evaluating the effects of the 1987 market decline on the volume of trading. Specifically, he wants to test whether the
decline affected trading volume. He selected a sample of 500 companies and collected data on the total annual volume for one
year prior to the decline and for one year following the decline. What is the set of hypotheses that Sutton is testing?
A) H0: µd ≠ µd0 versus Ha: µd = µd0.
B) H0: µd = µd0 versus Ha: µd > µd0.
C) H0: µd = µd0 versus Ha: µd ≠ µd0.
Question #62 of 126
Question ID: 710147
An analyst wants to determine whether the monthly returns on two stocks over the last year were the same or not. What test
should she use, assuming returns are normally distributed?
A) Difference in means test.
B) Chi-square test.
C) Paired comparisons test.
Question #63 of 126
Question ID: 413406
The variance of 100 daily stock returns for Stock A is 0.0078. The variance of 90 daily stock returns for Stock B is 0.0083. Using
a 5% level of significance, the critical value for this test is 1.61. The most appropriate conclusion regarding whether the variance
of Stock A is different from the variance of Stock B is that the:
A) variances are equal.
B) variances are not equal.
C) variance of Stock B is significantly greater than the variance of Stock A.
Question #64 of 126
Question ID: 413411
Which of the following is least likely an underlying assumption of technical analysis?
A) Markets are efficient and all known information is reflected in prices.
B) Prices are determined by supply and demand.
C) Supply and demand for a stock is driven by rational and irrational behavior.
Question #65 of 126
Question ID: 413381
Which of the following statements about statistical results is most accurate?
A) If a result is statistically significant and economically meaningful, the relationship will continue into
the future.
B) If a result is statistically significant, it must also be economically meaningful.
C) A result may be statistically significant, but may not be economically meaningful.
Question #66 of 126
Question ID: 413437
Technical analysts who employ Elliott Wave Theory are most likely to use Fibonacci numbers to forecast the:
A) number of subwaves within a larger wave.
B) timing of wave direction changes.
C) sizes of waves.
Question #67 of 126
Question ID: 413326
Jill Woodall believes that the average return on equity in the retail industry, µ, is less than 15%. What is null (H0) and alternative
(Ha) hypothesis for her study?
A) H0: µ ≥ 0.15 versus Ha: µ < 0.15.
B) H0: µ < 0.15 versus Ha: µ = 0.15.
C) H0: µ = 0.15 versus Ha: µ ≠ 0.15.
Question #68 of 126
Question ID: 413332
Brian Ci believes that the average return on equity in the airline industry, µ, is less than 5%. What are the appropriate null (H0)
and alternative (Ha) hypotheses to test this belief?
A) H0: µ < 0.05 versus Ha: µ > 0.05.
B) H0: µ ≥ 0.05 versus Ha: µ < 0.05.
C) H0: µ < 0.05 versus Ha: µ ≥ 0.05.
Question #69 of 126
Question ID: 413403
The test of the equality of the variances of two normally distributed populations requires the use of a test statistic that is:
A) Chi-squared distributed.
B) F-distributed.
C) z-distributed.
Question #70 of 126
Question ID: 413339
What kind of test is being used for the following hypothesis and what would a z-statistic of 1.68 tell us about a hypothesis with the
appropriate test and a level of significance of 5%, respectively?
H 0: B ≤ 0
HA: B > 0
A) One-tailed test; reject the null.
B) One-tailed test; fail to reject the null.
C) Two-tailed test; fail to reject the null.
Question #71 of 126
Which of the following statements least accurately describes the procedure for testing a hypothesis?
A) Develop a hypothesis, compute the test statistic, and make a decision.
B) Select the level of significance, formulate the decision rule, and make a decision.
C) Compute the sample value of the test statistic, set up a rejection (critical) region, and make a
decision.
Question ID: 448953
Question #72 of 126
Question ID: 413379
An analyst calculates that the mean of a sample of 200 observations is 5. The analyst wants to determine whether the calculated
mean, which has a standard error of the sample statistic of 1, is significantly different from 7 at the 5% level of significance.
Which of the following statements is least accurate?:
A) The mean observation is significantly different from 7, because the calculated Z-statistic is less than
the critical Z-statistic.
B) The alternative hypothesis would be Ha: mean > 7.
C) The null hypothesis would be: H0: mean = 7.
Question #73 of 126
Question ID: 413440
The most appropriate tool to use for intermarket analysis of two different asset classes is a:
A) relative strength chart.
B) stochastic oscillator.
C) moving average convergence/divergence chart.
Question #74 of 126
Question ID: 710146
Which of the following statements about hypothesis testing is most accurate?
A) A hypothesis that the population mean is less than or equal to 5 should be rejected when the critical
Z-statistic is greater than the sample Z-statistic.
B) A Type I error is rejecting the null hypothesis when it is true, and a Type II error is rejecting the
alternative hypothesis when it is true.
C) A hypothesized mean of 3, a sample mean of 6, and a standard error of the sampling means of 2
give a sample Z-statistic of 1.5.
Question #75 of 126
Question ID: 710149
After trending upward for several weeks, the price of Vibex, Inc. stock reaches a high of $54 before falling to $48 over the
following week. The stock then rallies to $57 but then declines again to $48. The following week, the stock increases to $52 on
light volume before ending the week at $46. A technical analyst observing this pattern would most likely describe it as a:
A) continuation pattern.
B) head-and-shoulders pattern.
C) triangle pattern.
Question #76 of 126
Question ID: 413337
In order to test whether the mean IQ of employees in an organization is greater than 100, a sample of 30 employees is taken and
the sample value of the computed test statistic, tn-1 = 3.4. The null and alternative hypotheses are:
A) H0: µ ≤ 100; Ha: µ > 100.
B) H0: X ≤ 100; Ha: X > 100.
C) H0: µ = 100; Ha: µ ≠ 100.
Question #77 of 126
Question ID: 413383
A p-value of 0.02% means that a researcher:
A) can reject the null hypothesis at both the 5% and 1% significance levels.
B) cannot reject the null hypothesis at either the 5% or 1% significance levels.
C) can reject the null hypothesis at the 5% significance level but cannot reject at the 1% significance
level.
Question #78 of 126
Question ID: 413342
An analyst conducts a two-tailed z-test to determine if small cap returns are significantly different from 10%. The sample size was
200. The computed z-statistic is 2.3. Using a 5% level of significance, which statement is most accurate?
A) You cannot determine what to do with the information given.
B) Fail to reject the null hypothesis and conclude that small cap returns are close enough to 10% that
we cannot say they are significantly different from 10%.
C) Reject the null hypothesis and conclude that small cap returns are significantly different from 10%.
Question #79 of 126
Question ID: 413333
Jill Woodall believes that the average return on equity in the retail industry, µ, is less than 15%. What are the null (H0) and
alternative (Ha) hypotheses for her study?
A) H0: µ ≥ 0.15 versus Ha: µ < 0.15.
B) H0: µ ≤ 0.15 versus Ha: µ > 0.15.
C) H0: µ < 0.15 versus Ha: µ ≥ 0.15.
Question #80 of 126
Question ID: 413410
The advantages of using technical analysis include:
A) the incorporation of psychological reasons behind price changes.
B) complete objectivity.
C) ease in interpreting reasons behind stock price trends.
Question #81 of 126
Question ID: 413435
Technical analysts who use cycles define a Kondratieff wave as a cycle of:
A) 18 years.
B) 10 years.
C) 54 years.
Question #82 of 126
Question ID: 413373
Ryan McKeeler and Howard Hu, two junior statisticians, were discussing the relation between confidence intervals and
hypothesis tests. During their discussion each of them made the following statement:
McKeeler: A confidence interval for a two-tailed hypothesis test is calculated as adding and subtracting the
product of the standard error and the critical value from the sample statistic. For example, for a level of
confidence of 68%, there is a 32% probability that the true population parameter is contained in the interval.
Hu: A 99% confidence interval uses a critical value associated with a given distribution at the 1% level of
significance. A hypothesis test would compare a calculated test statistic to that critical value. As such, the
confidence interval is the range for the test statistic within which a researcher would not reject the null
hypothesis for a two-tailed hypothesis test about the value of the population mean of the random variable.
With respect to the statements made by McKeeler and Hu:
A) both are correct.
B) both are incorrect.
C) only one is correct.
Question #83 of 126
Question ID: 413375
The power of the test is:
A) equal to the level of confidence.
B) the probability of rejecting a true null hypothesis.
C) the probability of rejecting a false null hypothesis.
Question #84 of 126
Question ID: 434224
Student's t-Distribution
Level of Significance for One-Tailed Test
df 0.100 0.050 0.025 0.01 0.005 0.0005
Level of Significance for Two-Tailed Test
df 0.20
0.10
0.05
0.02
0.01
0.001
24 1.318 1.711 2.064 2.492 2.797
3.745
25 1.316 1.708 2.060 2.485 2.787
3.725
A pitching machine is calibrated to deliver a fastball at a speed of 98 miles per hour. Every day, a technician samples the speed
of twenty-five fastballs in order to determine if the machine needs adjustment. Today, the sample showed a mean speed of 99
miles per hour with a standard deviation of 1.75 miles per hour. Assume the population is normally distributed. At a 95%
confidence level, what is the t-value in relation to the critical value?
A) The t-value exceeds the critical value by 1.5 standard deviations.
B) The critical value exceeds the t-value by 1.3 standard deviations.
C) The t-value exceeds the critical value by 0.8 standard deviations.
Question #85 of 126
Student's t-Distribution
Level of Significance for One-Tailed Test
df 0.100 0.050 0.025 0.01 0.005 0.0005
Question ID: 434230
Level of Significance for Two-Tailed Test
df 0.20
0.10
0.05
0.02
0.01
0.001
10 1.372 1.812 2.228 2.764 3.169
4.587
11 1.363 1.796 2.201 2.718 3.106
4.437
12 1.356 1.782 2.179 2.681 3.055
4.318
22 1.321 1.717 2.074 2.508 2.819
3.792
23 1.319 1.714 2.069 2.500 2.807
3.768
24 1.318 1.711 2.064 2.492 2.797
3.745
Roy Fisher, CFA, wants to determine whether there is a significant difference, at the 5% significance level, between the mean
monthly return on Stock GHI and the mean monthly return on Stock JKL. Fisher assumes the variances of the two stocks' returns
are equal. Using the last 12 months of returns on each stock, Fisher calculates a t-statistic of 2.0 for a test of equality of means.
Based on this result, Fisher's test:
A) rejects the null hypothesis, and Fisher can conclude that the means are equal.
B) rejects the null hypothesis, and Fisher can conclude that the means are not equal.
C) fails to reject the null hypothesis.
Question #86 of 126
Question ID: 413412
A technical analyst believes stock prices are primarily driven by:
A) market supply and demand forces.
B) specialist trading.
C) the random walk hypothesis.
Question #87 of 126
Question ID: 413428
A trend is most likely to reverse if the price chart displays a:
A) descending triangle pattern.
B) head and shoulders pattern.
C) rectangle pattern.
Question #88 of 126
Question ID: 413357
A survey is taken to determine whether the average starting salaries of CFA charterholders is equal to or greater than $54,000
per year. Assuming a normal distribution, what is the test statistic given a sample of 75 newly acquired CFA charterholders with a
mean starting salary of $57,000 and a standard deviation of $1,300?