CFA 2018 SS 03 quiz 1 answers
Bạn đang xem bản rút gọn của tài liệu. Xem và tải ngay bản đầy đủ của tài liệu tại đây (1003.73 KB, 98 trang )
SS 03 Quantitative Methods: Application
Question #1 of 193
Answers
Question ID: 413226
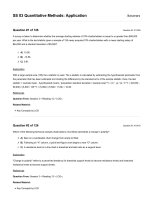
Assume an investor purchases a stock for $50. One year later, the stock is worth $60. After one more year, the stock price has
fallen to the original price of $50. Calculate the continuously compounded return for year 1 and year 2.
Year 1
Year 2
✓ A) 18.23%
-18.23%
✗ B) -18.23%
-18.23%
✗ C) 18.23%
16.67%
Explanation
Given a holding period return of R, the continuously compounded rate of return is: ln(1 + R) = ln(Price1/Price0). Here, if the stock
price increases to $60, r = ln(60/50) = 0.18232, or 18.23%.
Note: Calculator keystrokes are as follows. First, obtain the result of 60/50, or 1. On the TI BA II Plus, enter 1.20 and then click
on LN. On the HP12C, 1.2 [ENTER] g [LN] (the LN appears in blue on the %T key).
The return for year 2 is ln(50/60), or ln(0.833) = negative 18.23%.
References
Question From: Session 3 > Reading 10 > LOS p
Related Material:
Key Concepts by LOS
Question #2 of 193
Question ID: 434210
Student's t-Distribution
Level of Significance for One-Tailed Test
df 0.100 0.050 0.025 0.01 0.005 0.0005
Level of Significance for Two-Tailed Test
df
0.20
0.10
0.05
0.02
0.01
0.001
40 1.303 1.684 2.021 2.423 2.704 3.551
60 1.296 1.671 2.000 2.390 2.660 3.460
120 1.289 1.658 1.980 2.358 2.617 3.373
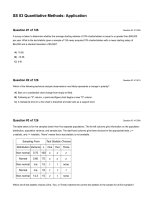
The approximate 99% confidence interval for the population mean based on a sample of 60 returns with a mean of 7% and a
sample standard deviation of 25% is closest to:
✗ A) 0.546% to 13.454%.
✓ B) -1.584% to 15.584%.
✗ C) 1.584% to 14.584%.
Explanation
The standard error for the mean = s / (n)0.5 = 25% / (60)0.5 = 3.227%. The critical value from the t-table should be based on 60 −
1 = 59 df. Since the standard tables do not provide the critical value for 59 df the closest available value is for 60 df. This leaves
us with an approximate confidence interval. Based on 99% confidence and df = 60, the critical t-value is 2.660. Therefore the
99% confidence interval is approximately: 7% ± 2.660(3.227) or 7% ± 8.584% or -1.584% to 15.584%.
If you use a z-statistic, the confidence interval is 7% ± 2.58(3.227) = -1.326% to 15.326%, which is closest to the correct choice.
References
Question From: Session 3 > Reading 11 > LOS j
Related Material:
Key Concepts by LOS
Question #3 of 193
Question ID: 434204
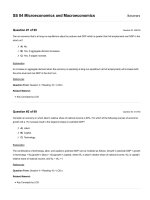
Assume 30% of the CFA candidates have a degree in economics. A random sample of three CFA candidates is selected. What is
the probability that none of them has a degree in economics?
✗ A) 0.027.
✓ B) 0.343.
✗ C) 0.900.
Explanation
The probability of 0 successes in 3 trials is: [3! / (0!3!)] (0.3)0 (0.7)3 = 0.343
References
Question From: Session 3 > Reading 10 > LOS f
Related Material:
Key Concepts by LOS
Question #4 of 193
Question ID: 413257
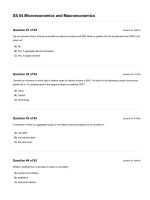
If the true mean of a population is 16.62, according to the central limit theorem, the mean of the distribution of sample means, for
all possible sample sizes n will be:
✗ A) 16.62 / √n.
✗ B) indeterminate for sample with n < 30.
✓ C) 16.62.
Explanation
According to the central limit theorem, the mean of the distribution of sample means will be equal to the population mean. n > 30
is only required for distributions of sample means to approach normal distribution.
References
Question From: Session 3 > Reading 11 > LOS e
Related Material:
Key Concepts by LOS
Question #5 of 193
Question ID: 413312
An article in a trade journal suggests that a strategy of buying the seven stocks in the S&P 500 with the highest earnings-to-price
ratio at the end of the calendar year and holding them until March 20 of the following year produces significant trading profits.
Upon reading further, you discover that the study is based on data from 1993 to 1997, and the earnings-to-price ratio is
calculated using the stock price on December 31 of each year and the annual reported earnings per share for that year. Which of
the following biases is least likely to influence the reported results?
✗ A) Time-period bias.
✓ B) Survivorship bias.
✗ C) Look-ahead bias.
Explanation
Survivorship bias is not likely to significantly influence the results of this study because the authors looked at the stocks in the
S&P 500 at the beginning of the year and measured performance over the following three months. Look-ahead bias could be a
problem because earnings-price ratios are calculated and the trading strategy implemented at a time before earnings are actually
reported. Finally, the study is conducted over a relatively short time period during the long bull market of the 1990s. This
suggests the results may be time-specific and the result of time-period bias.
References
Question From: Session 3 > Reading 11 > LOS k
Related Material:
Key Concepts by LOS
Question #6 of 193
The mean and standard deviation of returns on three portfolios are listed below in percentage terms:
Question ID: 413212
Portfolio X: Mean 5%, standard deviation 3%.
Portfolio Y: Mean 14%, standard deviation 20%.
Portfolio Z: Mean 19%, standard deviation 28%.
Using Roy's safety first criteria and a threshold of 3%, which of these is the optimal portfolio?
✗ A) Portfolio Z.
✗ B) Portfolio Y.
✓ C) Portfolio X.
Explanation
According to the safety-first criterion, the optimal portfolio is the one that has has the largest value for the SFRatio (mean −
threshold) / standard deviation.
For Portfolio X, (5 − 3) / 3 = 0.67.
For Portfolio Y, (14 - 3) / 20 = 0.55.
For Portfolio Z, (19 - 3) / 28 = 0.57.
References
Question From: Session 3 > Reading 10 > LOS n
Related Material:
Key Concepts by LOS
Question #7 of 193
Question ID: 413234
Joan Biggs, CFA, acquires a large database of past returns on a variety of assets. Biggs then draws random samples of sets of
returns from the database and analyzes the resulting distributions. Biggs is engaging in:
✗ A) discrete analysis.
✓ B) historical simulation.
✗ C) Monte Carlo simulation.
Explanation
This is a typical example of historical simulation.
References
Question From: Session 3 > Reading 10 > LOS r
Related Material:
Key Concepts by LOS
Question #8 of 193
Question ID: 413278
Which of the following statements about confidence intervals is least accurate? A confidence interval:
✓ A) expands as the probability that a point estimate falls within the interval decreases.
✗ B) has a significance level that is equal to one minus the degree of confidence.
✗ C) is constructed by adding and subtracting a given amount from a point estimate.
Explanation
A confidence interval contracts as the probability that a point estimate falls within the interval decreases.
References
Question From: Session 3 > Reading 11 > LOS h
Related Material:
Key Concepts by LOS
Question #9 of 193
Question ID: 710142
Consider a random variable X that follows a continuous uniform distribution: 7 ≤ X ≤ 20. Which of the following statements is least
accurate?
✗ A) F(10) = 0.23.
✗ B) F(12 ≤ X ≤ 16) = 0.307.
✓ C) F(21) = 0.00.
Explanation
F(21) = 1.00. For a cumulative distribution function, the expression F(x) refers to the probability of an outcome less than or equal
to x. In this distribution all the possible outcomes are between 7 and 20. Therefore the probability of an outcome less than or
equal to 21 is 100%.
The other choices are true.
F(10) = (10 - 7) / (20 - 7) = 3 / 13 = 0.23
F(12 ≤ X ≤ 16) = F(16) - F(12) = [(16 - 7) / (20 - 7)] − [(12 - 7) / (20 - 7)] = 0.692 − 0.385 = 0.307
References
Question From: Session 3 > Reading 10 > LOS i
Related Material:
Key Concepts by LOS
Question #10 of 193
Question ID: 413259
Frank Grinder is trying to introduce sampling into the quality control program of an old-line manufacturer. Grinder samples 38
items and finds that the standard deviation in size is 0.019 centimeters. What is the standard error of the sample mean?
✗ A) 0.00204.
✓ B) 0.00308.
✗ C) 0.00615.
Explanation
If we do not know the standard deviation of the population (in this case we do not), then we estimate the standard error of the
sample mean = the standard deviation of the sample / the square root of the sample size = 0.019 / √38 = 0.00308 centimeters.
References
Question From: Session 3 > Reading 11 > LOS f
Related Material:
Key Concepts by LOS
Question #11 of 193
Question ID: 413293
The average U.S. dollar/Euro exchange rate from a sample of 36 monthly observations is $1.00/Euro. The population variance is
0.49. What is the 95% confidence interval for the mean U.S. dollar/Euro exchange rate?
✗ A) $0.8075 to $1.1925.
✓ B) $0.7713 to $1.2287.
✗ C) $0.5100 to $1.4900.
Explanation
The population standard deviation is the square root of the variance (√0.49 = 0.7). Because we know the population standard
deviation, we use the z-statistic. The z-statistic reliability factor for a 95% confidence interval is 1.960. The confidence interval is
$1.00 ± 1.960($0.7 / √36) or $1.00 ± $0.2287.
References
Question From: Session 3 > Reading 11 > LOS j
Related Material:
Key Concepts by LOS
Question #12 of 193
Which of the following would least likely be categorized as a multivariate distribution?
✗ A) The returns of the stocks in the DJIA.
Question ID: 413186
✗ B) The return of a stock and the return of the DJIA.
✓ C) The days a stock traded and the days it did not trade.
Explanation
The number of days a stock traded and did not trade describes only one random variable. Both of the other cases involve two or more
random variables.
References
Question From: Session 3 > Reading 10 > LOS k
Related Material:
Key Concepts by LOS
Question #13 of 193
Question ID: 413137
A probability distribution is least likely to:
✗ A) contain all the possible outcomes.
✗ B) have only non-negative probabilities.
✓ C) give the probability that the distribution is realistic.
Explanation
The probability distribution may or may not reflect reality. But the probability distribution must list all possible outcomes, and
probabilities can only have non-negative values.
References
Question From: Session 3 > Reading 10 > LOS a
Related Material:
Key Concepts by LOS
Question #14 of 193
Question ID: 413158
Which of the following could be the set of all possible outcomes for a random variable that follows a binomial distribution?
✗ A) (-1, 0, 1).
✓ B) (0, 1, 2, 3, 4, 5, 6, 7, 8, 9, 10, 11).
✗ C) (1, 2).
Explanation
This reflects a basic property of binomial outcomes. They take on whole number values that must start at zero up to the upper
limit n. The upper limit in this case is 11.
References
Question From: Session 3 > Reading 10 > LOS f
Related Material:
Key Concepts by LOS
Question #15 of 193
Question ID: 413147
Which of the following could least likely be a probability function?
✓ A) X:(1,2,3,4) p(x) = 0.2.
✗ B) X:(1,2,3,4) p(x) = x / 10.
✗ C) X:(1,2,3,4) p(x) = (x × x) / 30.
Explanation
In a probability function, the sum of the probabilities for all of the outcomes must equal one. Only one of the probability functions
in these answers fails to sum to one.
References
Question From: Session 3 > Reading 10 > LOS c
Related Material:
Key Concepts by LOS
Question #16 of 193
Question ID: 413287
The table below is for five samples drawn from five separate populations. The far left columns give information on the population
distribution, population variance, and sample size. The right-hand columns give three choices for the appropriate tests: Z =
z-statistic, and t = t-statistic. "None" means that a test statistic is not available.
Sampling From
Distribution Variance
Test Statistic Choices
n
One
Two
Three
Normal
5.60
75
Z
Z
Z
Non-normal
n/a
45
Z
t
t
Normal
n/a
1000
Z
t
t
Non-normal
14.3
15
t
none
t
Normal
0.056
10
Z
Z
t
Which set of test statistic choices (One, Two, or Three) matches the correct test statistic to the sample for all five samples?
✓ A) Two.
✗ B) One.
✗ C) Three.
Explanation
For the exam: COMMIT THE FOLLOWING TABLE TO MEMORY!
When you are sampling from a:
and the sample size is small, use a: and the sample size is large, use a:
Normal distribution with a known variance
Z-statistic
Z-statistic
Normal distribution with an unknown variance
t-statistic
t-statistic
Nonnormal distribution with a known variance
not available
Z-statistic
Nonnormal distribution with an unknown variance
not available
t-statistic
References
Question From: Session 3 > Reading 11 > LOS j
Related Material:
Key Concepts by LOS
Question #17 of 193
Question ID: 413190
The mean return of a portfolio is 20% and its standard deviation is 4%. The returns are normally distributed. Which of the
following statements about this distribution are least accurate? The probability of receiving a return:
✗ A) of less than 12% is 0.025.
✓ B) in excess of 16% is 0.16.
✗ C) between 12% and 28% is 0.95.
Explanation
The probability of receiving a return greater than 16% is calculated by adding the probability of a return between 16% and 20%
(given a mean of 20% and a standard deviation of 4%, this interval is the left tail of one standard deviation from the mean, which
includes 34% of the observations.) to the area from 20% and higher (which starts at the mean and increases to infinity and
includes 50% of the observations.) The probability of a return greater than 16% is 34 + 50 = 84%.
Note: 0.16 is the probability of receiving a return less than 16%.
References
Question From: Session 3 > Reading 10 > LOS l
Related Material:
Key Concepts by LOS
Question #18 of 193
Question ID: 413224
Given a holding period return of R, the continuously compounded rate of return is:
✗ A) eR − 1.
✓ B) ln(1 + R).
✗ C) ln(1 − R) − 1.
Explanation
This is the formula for the continuously compounded rate of return.
References
Question From: Session 3 > Reading 10 > LOS p
Related Material:
Key Concepts by LOS
Question #19 of 193
Question ID: 413316
A research paper that reports finding a profitable trading strategy without providing any discussion of an economic theory that
makes predictions consistent with the empirical results is most likely evidence of:
✗ A) a sample that is not large enough.
✗ B) a non-normal population distribution.
✓ C) data mining.
Explanation
Data mining occurs when the analyst continually uses the same database to search for patterns or trading rules until he finds one
that works. If you are reading research that suggests a profitable trading strategy, make sure you heed the following warning
signs of data mining:
Evidence that the author used many variables (most unreported) until he found ones that were significant.
The lack of any economic theory that is consistent with the empirical results.
References
Question From: Session 3 > Reading 11 > LOS k
Related Material:
Key Concepts by LOS
Question #20 of 193
Question ID: 434206
The safety-first criterion focuses on:
✗ A) SEC regulations.
✓ B) shortfall risk.
✗ C) margin requirements.
Explanation
The safety-first criterion focuses on shortfall risk which is the probability that a portfolio's value or return will fall below a given
threshold level. The safety-first criterion minimizes the probability of falling below the threshold level or return.
References
Question From: Session 3 > Reading 10 > LOS n
Related Material:
Key Concepts by LOS
Question #21 of 193
Question ID: 413164
A stock priced at $20 has an 80% probability of moving up and a 20% probability of moving down. If it moves up, it increases by
a factor of 1.05. If it moves down, it decreases by a factor of 1/1.05. What is the expected stock price after two successive
periods?
✗ A) $22.05.
✓ B) $21.24.
✗ C) $20.05.
Explanation
If the stock moves up twice, it will be worth $20 × 1.05 × 1.05 = $22.05. The probability of this occurring is 0.80 × 0.80 = 0.64. If
the stock moves down twice, it will be worth $20 × (1/1.05) × (1/1.05) = $18.14. The probability of this occurring is 0.20 × 0.20 =
0.04. If the stock moves up once and down once, it will be worth $20 × 1.05 × (1/1.05) = $20.00. This can occur if either the stock
goes up then down or down then up. The probability of this occurring is 0.80 × 0.20 + 0.20 × 0.80 = 0.32. Multiplying the potential
stock prices by the probability of them occurring provides the expected stock price: ($22.05 × 0.64) + ($18.14 × 0.04) + ($20.00 ×
0.32) = $21.24.
References
Question From: Session 3 > Reading 10 > LOS g
Related Material:
Key Concepts by LOS
Question #22 of 193
Question ID: 413166
A total return index begins the year at 1350.23 and ends the year at 1412.95. A portfolio that tracks this index earns a total return
of 3.65% for the year. The tracking error of this portfolio is closest to:
✓ A) -1.0%.
✗ B) 4.7%.
✗ C) 0.9%.
Explanation
The return for the index is 1412.95 / 1350.23 − 1 = 4.65%. Tracking error is 3.65% − 4.65% = -1.00%.
References
Question From: Session 3 > Reading 10 > LOS h
Related Material:
Key Concepts by LOS
Question #23 of 193
Question ID: 413142
A random variable that has a countable number of possible values is called a:
✗ A) continuous random variable.
✗ B) probability distribution.
✓ C) discrete random variable.
Explanation
A discrete random variable is one for which the number of possible outcomes are countable, and for each possible outcome,
there is a measurable and positive probability. A continuous random variable is one for which the number of outcomes is not
countable.
References
Question From: Session 3 > Reading 10 > LOS b
Related Material:
Key Concepts by LOS
Question #24 of 193
Question ID: 652911
Cumulative Z-Table
z
0.05
0.06
0.07
0.08
0.09
2.4 0.9929 0.9931 0.9932 0.9934 0.9936
2.5 0.9946 0.9948 0.9949 0.9951 0.9952
2.6 0.9960 0.9961 0.9962 0.9963 0.9964
2.7 0.9970 0.9971 0.9972 0.9973 0.9974
The average return on the Russell 2000 index for 121 monthly observations was 1.5%. The population standard deviation is
assumed to be 8.0%. What is a 99% confidence interval for the mean monthly return on the Russell 2000 index?
✓ A) -0.4% to 3.4%.
✗ B) 0.1% to 2.9%.
✗ C) -6.5% to 9.5%.
Explanation
Because we know the population standard deviation, we use the z-statistic. The z-statistic reliability factor for a 99% confidence
interval is 2.575. The confidence interval is 1.5% ± 2.575[(8.0%)/√121] or 1.5% ± 1.9%.
References
Question From: Session 3 > Reading 11 > LOS j
Related Material:
Key Concepts by LOS
Question #25 of 193
Question ID: 413146
If a smooth curve is to represent a probability density function, what two requirements must be satisfied? The area under the
curve must be:
✓ A) one and the curve must not fall below the horizontal axis.
✗ B) one and the curve must not rise above the horizontal axis.
✗ C) zero and the curve must not fall below the horizontal axis.
Explanation
If a smooth curve is to represent a probability density function, the total area under the curve must be one (probability of all
outcomes equals 1) and the curve must not fall below the horizontal axis (no outcome can have a negative chance of occurring).
References
Question From: Session 3 > Reading 10 > LOS c
Related Material:
Key Concepts by LOS
Question #26 of 193
Question ID: 413238
An analyst wants to generate a simple random sample of 500 stocks from all 10,000 stocks traded on the New York Stock
Exchange, the American Stock Exchange, and NASDAQ. Which of the following methods is least likely to generate a random
sample?
✓ A) Using the 500 stocks in the S&P 500.
✗ B) Listing all the stocks traded on all three exchanges in alphabetical order and selecting every 20th
stock.
✗ C) Assigning each stock a unique number and generating a number using a random number generator.
Then selecting the stock with that number for the sample and repeating until there are 500 stocks in
the sample.
Explanation
The S&P 500 is not a random sample of all stocks traded in the U.S. because it represents the 500 largest stocks. The other two
choices are legitimate methods of selecting a simple random sample.
References
Question From: Session 3 > Reading 11 > LOS a
Related Material:
Key Concepts by LOS
Question #27 of 193
Question ID: 413317
The practice of repeatedly using the same database to search for patterns until one is found is called:
✓ A) data mining.
✗ B) data snooping.
✗ C) sample selection bias.
Explanation
The practice of data mining involves analyzing the same data so as to detect a pattern, which may not replicate in other data
sets, also known as torturing the data until it confesses.
References
Question From: Session 3 > Reading 11 > LOS k
Related Material:
Key Concepts by LOS
Question #28 of 193
Question ID: 413145
In a continuous probability density function, the probability that any single value of a random variable occurs is equal to what?
✓ A) Zero.
✗ B) 1/N.
✗ C) One.
Explanation
Since there are infinite potential outcomes in a continuous pdf, the probability of any single value of a random variable occurring is 1/infinity
= 0.
References
Question From: Session 3 > Reading 10 > LOS c
Related Material:
Key Concepts by LOS
Question #29 of 193
Question ID: 434219
Student's t-Distribution
Level of Significance for One-Tailed Test
df 0.100 0.050 0.025 0.01 0.005 0.0005
Level of Significance for Two-Tailed Test
df
0.20
0.10
0.05
0.02
0.01
0.001
40 1.303 1.684 2.021 2.423 2.704 3.551
60 1.296 1.671 2.000 2.390 2.660 3.460
120 1.289 1.658 1.980 2.358 2.617 3.373
The average salary for a sample of 61 CFA charterholders with 10 years experience is $200,000, and the sample standard
deviation is $80,000. Assume the population is normally distributed. Which of the following is a 99% confidence interval for the
population mean salary of CFA charterholders with 10 years of experience?
✗ A) $172,514 to $227,486.
✓ B) $172,754 to $227,246.
✗ C) $160,000 to $240,000.
Explanation
If the distribution of the population is normal, but we don't know the population variance, we can use the Student's t-distribution to
construct a confidence interval. Because there are 61 observations, the degrees of freedom are 60. From the student's t table,
we can determine that the reliability factor for tα/2, or t0.005, is 2.660. Then the 99% confidence interval is $200,000 ±
2.660($80,000 / √61) or $200,000 ± 2.660 × $10,243, or $200,000 ± $27,246.
References
Question From: Session 3 > Reading 11 > LOS j
Related Material:
Key Concepts by LOS
Question #30 of 193
Question ID: 413251
Which of the following statements regarding the central limit theorem (CLT) is least accurate? The CLT:
✓ A) states that for a population with mean µ and variance σ2, the sampling distribution of the sample
means for any sample of size n will be approximately normally distributed.
✗ B) holds for any population distribution, assuming a large sample size.
✗ C) gives the variance of the distribution of sample means as σ2 / n, where σ2 is the population variance
and n is the sample size.
Explanation
This question is asking you to select the inaccurate statement. The CLT states that for a population with mean µ and a finite
variance σ2, the sampling distribution of the sample means becomes approximately normally distributed as the sample size
becomes large. The other statements are accurate.
References
Question From: Session 3 > Reading 11 > LOS e
Related Material:
Key Concepts by LOS
Question #31 of 193
A multivariate distribution:
✗ A) gives multiple probabilities for the same outcome.
✗ B) applies only to binomial distributions.
✓ C) specifies the probabilities associated with groups of random variables.
Explanation
This is the definition of a multivariate distribution.
References
Question From: Session 3 > Reading 10 > LOS k
Related Material:
Key Concepts by LOS
Question ID: 413185
Question #32 of 193
Question ID: 413228
Over a period of one year, an investor's portfolio has declined in value from 127,350 to 108,427. What is the continuously compounded rate
of return?
✗ A) -13.84%.
✓ B) -16.09%.
✗ C) -14.86%.
Explanation
The continuously compounded rate of return = ln( S1 / S0 ) = ln(108,427 / 127,350) = -16.09%.
References
Question From: Session 3 > Reading 10 > LOS p
Related Material:
Key Concepts by LOS
Question #33 of 193
Question ID: 413315
The average mutual fund return calculated from a sample of funds with significant survivorship bias would most likely be:
✓ A) larger than the mean return of the population of all mutual funds.
✗ B) smaller than the mean return of the population of all mutual funds.
✗ C) an unbiased estimate of the mean return of the population of all mutual funds if the sample size was
large enough.
Explanation
If we try to draw any conclusions from an analysis of a mutual fund database with survivorship bias, we overestimate the average
mutual fund return, because we don't include the poorer-performing funds that dropped out. A larger sample size from a
database with survivorship bias will still result in a biased estimate.
References
Question From: Session 3 > Reading 11 > LOS k
Related Material:
Key Concepts by LOS
Question #34 of 193
Question ID: 413208
Which of the following portfolios provides the best "safety first" ratio if the minimum acceptable return is 6%?
Portfolio Expected Return (%) Standard Deviation (%)
1
13
5
2
11
3
3
9
2
✗ A) 1.
✓ B) 2.
✗ C) 3.
Explanation
Roy's safety-first criterion requires the maximization of the SF Ratio:
SF Ratio = (expected return - threshold return) / standard deviation
Portfolio Expected Return (%) Standard Deviation SF Ratio
(%)
1
13
5
1.40
2
11
3
1.67
3
9
2
1.50
Portfolio #2 has the highest safety-first ratio at 1.67.
References
Question From: Session 3 > Reading 10 > LOS n
Related Material:
Key Concepts by LOS
Question #35 of 193
Question ID: 413242
A sample of five numbers drawn from a population is (5, 2, 4, 5, 4). Which of the following statements concerning this sample is
most accurate?
✗ A) The sampling error of the sample is equal to the standard error of the sample.
✗ B) The mean of the sample is ∑X / (n − 1) = 5.
✓ C) The variance of the sample is: ∑(x1 − mean of the sample)2 / (n − 1) = 1.5.
Explanation
The mean of the sample is ∑X / n = 20 / 5 = 4. The sampling error of the sample is the difference between a sample statistic and
its corresponding population parameter.
References
Question From: Session 3 > Reading 11 > LOS b
Related Material:
Key Concepts by LOS
Question #36 of 193
Question ID: 413167
A portfolio begins the year with a value of $100,000 and ends the year with a value of $95,000. The manager's performance is
measured against an index that declined by 7% on a total return basis during the year. The tracking error of this portfolio is
closest to:
✗ A) −5%.
✗ B) −2%.
✓ C) 2%.
Explanation
Tracking error is the portfolio total return minus the benchmark total return. The portfolio return is ($95,000 − $100,000) /
$100,000 = −5%. Tracking error = −5% − (−7%) = +2%.
References
Question From: Session 3 > Reading 10 > LOS h
Related Material:
Key Concepts by LOS
Question #37 of 193
Question ID: 413241
Which of the following statements about sampling errors is least accurate?
✓ A) Sampling errors are errors due to the wrong sample being selected from the population.
✗ B) Sampling error is the error made in estimating the population mean based on a sample mean.
✗ C) Sampling error is the difference between a sample statistic and its corresponding population
parameter.
Explanation
Sampling error is the difference between a sample statistic (the mean, variance, or standard deviation of the sample) and its
corresponding population parameter (the mean, variance, or standard deviation of the population).
References
Question From: Session 3 > Reading 11 > LOS b
Related Material:
Key Concepts by LOS
Question #38 of 193
Question ID: 413248
An analyst is asked to calculate standard deviation using monthly returns over the last five years. These data are best described
as:
✓ A) time series data.
✗ B) cross-sectional data.
✗ C) systematic sampling data.
Explanation
Time series data are taken at equally spaced intervals, such as monthly, quarterly, or annual. Cross sectional data are taken at a
single point in time. An example of cross-sectional data is dividend yields on 500 stocks as of the end of a year.
References
Question From: Session 3 > Reading 11 > LOS d
Related Material:
Key Concepts by LOS
Question #39 of 193
Question ID: 413196
If a stock's return is normally distributed with a mean of 16% and a standard deviation of 50%, what is the probability of a
negative return in a given year?
✓ A) 0.3745.
✗ B) 0.5000.
✗ C) 0.0001.
Explanation
The selected random value is standardized (its z-value is calculated) by subtracting the mean from the selected value and
dividing by the standard deviation. This results in a z-value of (0 − 16) / 50 = -0.32. Changing the sign and looking up +0.32 in the
z-value table yields 0.6255 as the probability that a random variable is to the right of the standardized value (i.e. more than zero).
Accordingly, the probability of a random variable being to the left of the standardized value (i.e. less than zero) is 1 − 0.6255 =
0.3745.
References
Question From: Session 3 > Reading 10 > LOS m
Related Material:
Key Concepts by LOS
Question #40 of 193
Question ID: 413204
The standard normal distribution is most completely described as a:
✗ A) symmetrical distribution with a mean equal to its median.
✗ B) distribution that exhibits zero skewness and no excess kurtosis.
✓ C) normal distribution with a mean of zero and a standard deviation of one.
Explanation
The standard normal distribution is defined as a normal distribution that has a mean of zero and a standard deviation of one. The
other choices apply to any normal distribution.
References
Question From: Session 3 > Reading 10 > LOS m
Related Material:
Key Concepts by LOS
Question #41 of 193
The mean and standard deviation of returns for three portfolios are listed below in percentage terms.
Portfolio X: Mean 5%, standard deviation 3%.
Portfolio Y: Mean 14%, standard deviation 20%.
Portfolio Z: Mean 19%, standard deviation 28%.
Using Roy's safety-first criteria and a threshold of 4%, select the optimal portfolio.
✗ A) Portfolio X.
✗ B) Portfolio Y.
✓ C) Portfolio Z.
Explanation
Portfolio Z has the largest value for the SFRatio: (19 − 4) / 28 = 0.5357.
For Portfolio X, the SFRatio is (5 - 4) / 3 = 0.3333.
For Portfolio Y, the SFRatio is (14 - 4) / 20 = 0.5000.
References
Question From: Session 3 > Reading 10 > LOS n
Question ID: 413207
Related Material:
Key Concepts by LOS
Question #42 of 193
Question ID: 413314
A study reports that from 2002 to 2004 the average return on growth stocks was twice as large as that of value stocks. These
results most likely reflect:
✗ A) survivorship bias.
✗ B) look-ahead bias.
✓ C) time-period bias.
Explanation
Time-period bias can result if the time period over which the data is gathered is either too short because the results may reflect
phenomenon specific to that time period, or if a change occurred during the time frame that would result in two different return
distributions. In this case the time period sampled is probably not large enough to draw any conclusions about the long-term
relative performance of value and growth stocks, even if the sample size within that time period is large.
Look-ahead bias occurs when the analyst uses historical data that was not publicly available at the time being studied.
Survivorship bias is a form of sample selection bias in which the observations in the sample are biased because the elements of
the sample that survived until the sample was taken are different than the elements that dropped out of the population.
References
Question From: Session 3 > Reading 11 > LOS k
Related Material:
Key Concepts by LOS
Question #43 of 193
Question ID: 413260
Joseph Lu calculated the average return on equity for a sample of 64 companies. The sample average is 0.14 and the sample
standard deviation is 0.16. The standard error of the mean is closest to:
✗ A) 0.0025.
✗ B) 0.1600.
✓ C) 0.0200.
Explanation
The standard error of the mean = σ/√n = 0.16/√64 = 0.02.
References
Question From: Session 3 > Reading 11 > LOS f
Related Material:
Key Concepts by LOS
Question #44 of 193
Question ID: 413300
A local high school basketball team had 18 home games this season and averaged 58 points per game. If we assume that the
number of points made in home games is normally distributed, which of the following is most likely the range of points for a
confidence interval of 90%?
✗ A) 26 to 80.
✗ B) 24 to 78.
✓ C) 34 to 82.
Explanation
This question has a bit of a trick. To answer this question, remember that the mean is at the midpoint of the confidence interval.
The correct confidence interval will have a midpoint of 58. (34 + 82) / 2 = 58.
References
Question From: Session 3 > Reading 11 > LOS j
Related Material:
Key Concepts by LOS
Question #45 of 193
Question ID: 413295
A traffic engineer is trying to measure the effects of carpool-only lanes on the expressway. Based on a sample of 1,000 cars at
rush hour, he finds that the mean number of occupants per car is 2.5, with a standard deviation of 0.4. Assuming that the
population is normally distributed, what is the confidence interval at the 5% significance level for the number of occupants per
car?
✓ A) 2.475 to 2.525.
✗ B) 2.288 to 2.712.
✗ C) 2.455 to 2.555.
Explanation
The Z-score corresponding with a 5% significance level (95% confidence level) is 1.96. The confidence interval is equal to: 2.5 ±
1.96(0.4 / √1,000) = 2.475 to 2.525. (We can use Z-scores because the size of the sample is so large.)
References
Question From: Session 3 > Reading 11 > LOS j
Related Material:
Key Concepts by LOS
Question #46 of 193
Question ID: 413281
When is the t-distribution the appropriate distribution to use? The t-distribution is the appropriate distribution to use when
constructing confidence intervals based on:
✗ A) small samples from populations with known variance that are at least approximately normal.
✓ B) small samples from populations with unknown variance that are at least approximately normal.
✗ C) large samples from populations with known variance that are nonnormal.
Explanation
The t-distribution is the appropriate distribution to use when constructing confidence intervals based on small samples from
populations with unknown variance that are either normal or approximately normal.
References
Question From: Session 3 > Reading 11 > LOS i
Related Material:
Key Concepts by LOS
Question #47 of 193
Question ID: 413133
Which of the following statements about probability distributions is most accurate?
✗ A) A discrete uniform random variable has varying probabilities for each outcome that total to one.
✓ B) A binomial distribution counts the number of successes that occur in a fixed number of independent trials
that have mutually exclusive (i.e. yes or no) outcomes.
✗ C) A continuous uniform distribution has a lower limit but no upper limit.
Explanation
Binomial probability distributions give the result of a single outcome and are used to study discrete random variables where you want to
know the probability that an exact event will happen. A continuous uniform distribution has both an upper and a lower limit. A discrete
uniform random variable has equal probabilities for each outcome.
References
Question From: Session 3 > Reading 10 > LOS a
Related Material:
Key Concepts by LOS
Question #48 of 193
Question ID: 413253
According to the Central Limit Theorem, the distribution of the sample means is approximately normal if:
✗ A) the underlying population is normal.
✗ B) the standard deviation of the population is known.
✓ C) the sample size n > 30.
Explanation
The Central Limit Theorem states that if the sample size is sufficiently large (i.e. greater than 30) the sampling distribution of the
sample means will be approximately normal.
References
Question From: Session 3 > Reading 11 > LOS e
Related Material:
Key Concepts by LOS
Question #49 of 193
Question ID: 413140
Which of the following is least likely a probability distribution?
✓ A) Zeta Corp.: P(dividend increases) = 0.60, P(dividend decreases) = 0.30.
✗ B) Roll an irregular die: p(1) = p(2) = p(3) = p(4) = 0.2 and p(5) = p(6) = 0.1.
✗ C) Flip a coin: P(H) = P(T) = 0.5.
Explanation
All the probabilities must be listed. In the case of Zeta Corp. the probabilities do not sum to one.
References
Question From: Session 3 > Reading 10 > LOS a
Related Material:
Key Concepts by LOS
Question #50 of 193
When sampling from a population, the most appropriate sample size:
✓ A) involves a trade-off between the cost of increasing the sample size and the value of increasing the
precision of the estimates.
Question ID: 413322