Characteristics of hydrogen production from food waste and waste activated sludge
Bạn đang xem bản rút gọn của tài liệu. Xem và tải ngay bản đầy đủ của tài liệu tại đây (230.59 KB, 11 trang )
Journal of Water and Environment Technology, Vol.1, No.2, 2003
Characteristics of hydrogen production from
food waste and waste activated sludge
*Hang-Sik Shin1, Sang-Hyoun Kim1 and Byung-Chun Paik2
1
Department of Civil and Environmental Engineering, Korea Advanced Institute of Science
and Technology, 373-1 Guseong-dong, Yuseong-gu, Daejeon, 305-701, Korea
2
Division of Civil and Environmental Engineering, Yosu National University,
San 96-1, Dundeok-dong, Yeosu-si, Jeollanam-do, 550-749, Korea
ABSTRACT
This study was conducted for microbial hydrogen production from food waste and sewage
sludge. Thirty three batch tests with different VS concentration (from 0.5 to 5.0 %, w/v) and
mixing ratio of food waste to sewage sludge (from 0:100 to 100:0) were performed at 35°C.
Heat-treated anaerobic sludge was used to seed the serum bottles. In all the tests, cumulative
hydrogen production reached the maximum values within 2.5 days. n-Butyrate was produced
simultaneously with hydrogen production, of which the amount was proportional to that of nbutyrate. Clostridium sp. are, therefore, considered to be the dominant microorganisms in this
study because these microorganisms are responsible for n-butyrate fermentation. The
hydrogen production potential of food waste was found over 34.0 mL/g VS at all the VS
concentration. The maximum potential of 59.2 mL/g VS was found at 3.0 % of VS
concentration. The potential decreased as sewage sludge composition increased due to the
methanogens contained in sewage sludge and low carbohydrate concentration; however, the
addition of sewage sludge to food waste enhanced hydrogen yield because of sufficient
protein. The maximum hydrogen yield of 1.01 mole H2/mole hexoseadded was achieved at the
food waste to sewage sludge ratio of 80:20 at the VS concentration of 3.0 %. The specific
hydrogen production rate increased up to 22.6 mL H2/g VSS/h as both food waste
composition and VS concentration increased.
Key Words: Food waste, hydrogen, mixing ratio, sewage sludge, VS concentration
INTRODUCTION
Due to the finite quantities and pollutants emission (CO2, CO, CnHm, Sox, NOx, ashes, etc.),
fossil fuels should be alternated by renewable and non-polluting energy sources in recent
- 177 -
Journal of Water and Environment Technology, Vol.1, No.2, 2003
future (Momirlan and Veziroğlu, 1999). As a sustainable energy source with minimal or zero
use of hydrocarbons, hydrogen is a promising alternative to fossil fuels. With high energy
yield (122 kJ/g), hydrogen is clean and renewable. In addition, hydrogen can be directly used
to produce electricity through fuel cells (Rifkin, 2002). Since conventional physico-chemical
production methods (e.g. water electrolysis or chemical cracking of hydrocarbons) require
electricity derived from fossil fuel combustion, interest in biohydrogen production has
increased significantly (BenneHawkes et al., 2002). Between two biological processes,
fermentative process that uses refuse or organic wastes seems technically simpler than
photosynthetic process.
Clostridium species (sp.) are the representative anaerobic fermentative hydrogen producing
bacteria (Hawkes et al., 2002). Due to the ability to produce endospore, they can be easily
selected from natural environments such as anaerobic sludge, compost and soil by inhibiting
other bacteria using heat, acid/base, ultrasound, chemicals, freezing/thawing, etc (Sparling et
al., 1997; Van Ginkel et al., 2001; Chen et al., 2002; Wang et al., 2003). Clostridium sp. are
also able to use wide range of biopolymers with various extracellular enzymes or enzyme
complexes (Mitchell, 2001). Carbohydrates are the preferred organic carbon source for
hydrogen producing fermentation. Stoichiometrically, Clostridium sp. can produce 2 moles of
hydrogen with 1 mole of n-butyrate or 4 moles of hydrogen with 1 mole of acetate from 1
mole of hexose. In most cases using soluble defined substrates, hydrogen production yield
and major byproduct were 0.7-2.1 mole/hexoseconsumed and n-butyrate, respectively (Mizuno et
al., 2000; Fang and Liu, 2002). However, hydrogen was hardly produced from protein and
lipids (Okamoto et al., 2000; Noike and Mizuno, 2000).
Up to now, fermentative hydrogen production was studied using organic wastes such as
high-strength wastewater (Ueno et al., 1996), lignocellulosic waste (Sparling et al., 1997),
municipal solid waste (Lay et al., 1999; Okamoto et al., 2000; Lay et al., 2003), food
manufacturing waste (Noike et al., 2000; Noike et al., 2002) and waste acitivated sludge
(Wang et al., 2003a; Wang et al., 2003b). The maximum hydrogen production potentials were
in the range of 10-70 mL H2/g VS. However, systematic studies of the anaerobic fermentation
of solid wastes are still lacking, although hydrogen yield and hydrogen production rate may
significantly depend on the characteristics of organic wastes, such as water content,
carbohydrate composition, carbohydrate/nutrient balance, etc.
Food waste and sewage sludge are the most abundant and problematic organic solid wastes
in Korea. The generation of food waste reaches 11,237 tons per day in Korea, accounting for
23.2 % of municipal solid wastes (Ministry of environment, 2002). Food waste is the major
source of decay, odor, and leachate in collection and transportation due to the high volatile
solids (VS; 80~90%) and moisture content (75~85%). Food waste, consolidated in landfills
with other wastes, has resulted in serious environmental problems such as odor emanation,
vermin attraction, toxic gas emission and groundwater contamination. However, food waste
- 178 -
Journal of Water and Environment Technology, Vol.1, No.2, 2003
might be suitable for anaerobic hydrogen production, because it is the carbohydrate-rich, and
easily hydrolysable waste (Han and Shin, 2002). 5,689 tons of digested and dewatered sewage
sludge cakes are generated per day (Ministry of environment, 2002). Now, 72 % of them are
disposed by ocean dumping, however it will be prohibited according to London Convention in
recent future. The enhancement of anaerobic digester is, therefore, urgent to reduce the
amounts of the sludge cakes and improve the quality for reuse. Phase separation and/or codigestion with carbon-rich waste is known as an economic and feasible approach to retrofit
the conventional digester (Lafitte-Trouquē and Forster, 2000; Schafer and Farrell, 2000). If
hydrogen can be produced in acidogenesis of sewage sludge or sewage sludge/food waste codigestion, sewage sludge will be the important source for hydrogen production due to its
amounts. Thus, in this work, food waste and sewage sludge were used for fermentative
production of hydrogen. Effects of VS concentrations and mixing ratio of two substrates were
investigated by serum bottle tests.
MATERIALS AND METHODS
Seed
The seed sludge was taken from an anaerobic digester in a local wastewater treatment plant
and heat-shocked at 90°C for 10 min to inhibit the bioactivity of hydrogen consumers and to
harvest spore-forming anaerobic bacteria (Hawkes et al., 2002). The pH value, alkalinity, and
volatile suspended solids (VSS) concentration of the sludge were 7.6, 2.83 g CaCO3/L, and
5.5 g/L, respectively.
Substrate
The feed was a mixture of food waste and sewage sludge, representing typical Korean food
waste and sewage sludge. Food waste, sampled from a dining hall, was crushed by an
electrical blender under anaerobic condition. Sewage sludge was sampled from a local
wastewater treatment plant. All the substrates were filtered through a stainless steel sieve (U.S.
Mesh No. 10 with corresponding sieve opening of 2.00 mm). The characteristics of the
substrate were summarized in Table 1.
Operating procedure
The experiments were conducted using 415 mL Wheaton media lab bottles. A total of 33
bottles with different volatile solids (VS) concentrations and mixing ratios of food waste and
sewage sludge were simultaneously operated. Total VS concentrations were controlled to 0.5,
1.0, 1.5, 2.0, 3.0, and 5.0 %. The mixing ratios of food waste to sewage sludge were designed
100:0, 80:20, 60:40, 40:60, 20:80, and 0:100 on VS basis; however, the experiments at 20:80
- 179 -
Journal of Water and Environment Technology, Vol.1, No.2, 2003
and 0:100 for 3.0 and 5.0 % of total VS concentrations could not be conducted because of low
VS concentration of sewage sludge. 20 mL of seed sludge and appropriate amounts of food
waste and sewage sludge were added in individual bottles. Each bottle was supplemented with
200 mg of KH2PO4, 14 mg of MgCl2•4H2O, 2 mg of Na2MoO4•4H2O, 2 mg of CaCl2•2H2O,
2.5 mg of MnCl2•6H2O, and 10 mg of FeCl2•4H2O, which was modified from Lay et al.
(1999). NaHCO3 was also added to adjust total carbohydrate : alkalinity ratio to 1.0±0.1. Each
bottle was then filled to 200 mL with distilled water and pH value was adjusted to 6.0 using
either 1 M HCl or 1 M KOH. Subsequently, the headspaces of the bottles were flushed with
N2 gas for 1 min and the bottles were tightly sealed using open-top screw caps with rubber
septum. The bottles were then placed in a reciprocating shaker at 35oC and 100 rpm. The
biogas production was determined using a glass syringe of 20-200 mL (Owen et al., 1979).
At the same time, gas composition was measured and the sample from the supernatant was
taken to analyze pH and organic concentrations. If the pH value was out of the range from 5.0
to 6.0, it was re-adjusted using injection of either 1 M HCl or 1 M KOH by syringes.
Table 1. Characteristics of substrate
Parameter
Total solids
Volatile solids
Total COD
Soluble COD
Total carbohydrate
Soluble carbohydrate
Total protein
Soluble protein
Total Kjeldahl nitrogen
pH
Alkalinity
Unit
Food waste
Sewage sludge
%, w/v
%, w/v
g/L
mg/L
g COD/L
mg COD/L
g COD/L
mg COD/L
g N/L
15.92
15.17
158.4
50,300
84.9
33,100
37.7
5,793
4.4
4.6
0.4
5.01
2.53
31.9
143.1
5.0
71.4
18.4
68.2
2.3
7.5
4.7
g CaCO3/L
Analytical methods
Hydrogen content in biogas was measured by a gas chromatography (GC, Gow Mac series
580) using a thermal conductivity detector and a 1.8 m × 3.2 mm stainless-steel column
packed with molecular sieve 5A with N2 as carrier gas. The contents of CH4, N2, and CO2
were measured using a GC of the same model noted previously with a 1.8 m × 3.2 mm
stainless-steel column packed with porapak Q (80/100 mesh) using helium as a carrier gas.
The temperatures of injector, detector, and column were kept at 80, 90, and 50°C, respectively,
in both GCs. VFA (C2-C6), and lactate were analyzed by a high performance liquid
chromatograph (Spectrasystem P2000) with an ultraviolet (210 nm) detector and an 300 mm ×
- 180 -
Journal of Water and Environment Technology, Vol.1, No.2, 2003
7.8 mm Aminex HPX-97H column using H2SO4 of 0.005 M as mobile phase. Aliphatic
alcohol was determined using another high performance liquid chromatograph (DX-600,
Dionex) with an electrochemical detector (ED50A) and an 250 mm × 4 mm Dionex CarboPac
PA10 column using NaOH of 0.01 M as mobile phase. The liquid samples were pretreated
with 0.45 µm membrane filter before injection to both HPLCs. Chemical oxygen demands
(COD), Suspended solids (SS), VSS, TKN, ammonia, and pH were determined according to
Standard Methods (APHA, 1998). Carbohydrate was determined by the colorimetric method
of Dubois et al. (1956) with UV wavelength at 480, 484 and 490 nm using glucose as
standard. Soluble protein was also measured by the colorimetric method at a wavelength of
562 nm with bovine serum albumin as standard (Smith et al., 1985). Total protein was
calculated from organic nitrogen (9.375 g COD/g organic nitrogen) (Miron et al., 2000).
RESULTS AND DISCUSSION
Fermentation characteristics
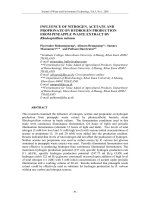
In all the tests, cumulative hydrogen production reached the maximum values within 2.5
days as shown in Fig. 1. The hydrogen production curve was fitted to a modified Gompertz
equation (1), which has been used as a suitable model for describing the hydrogen production
in batch tests (Lay, 2001; Lee et al., 2001; Chen et al., 2002).
H = P ∗ exp[− exp{
Rm
(λ − t )e + 1}]
P
(1)
where H was cumulative hydrogen production (mL), P was hydrogen production potential
(mL), Rm was hydrogen production rate (mL/day), λ was lag-phase time (days), and e was
exponential 1.
All the correlation coefficients, R2, were larger than 0.98. Additionally, all the t-values for
parameters were larger than t0.975, 5 = 2.571 (table value). The specific hydrogen production
potential (mL/g VS) was obtained by dividing P by the substrate weight (g VS), while the
specific hydrogen production rate was calculated by dividing Rm by the inoculum weight (g
VSS). Hydrogen production yield (mole/mole hexose) was determined by dividing P by
22,400 (mL/mole) and by either carbohydrate added (mole hexose) or carbohydrate consumed
(mole hexose). Lag-phase times (λ) for hydrogen production were not longer than 0.8 day,
which was shorter than reported values (2-4 days) in batch tests with heat-treated inocula (Lay
et al., 1999; Lay 2001). It was seemed that environmental conditions such as substrate, amino
acids, inorganic nutrients, and pH were sufficient for spore germination in this study (Hawkes
et al., 2002).
- 181 -
Journal of Water and Environment Technology, Vol.1, No.2, 2003
Carbohydrate (mg COD/L) Cumulative CH4 production
(mL, STP)
Cumulative H2 production
(mL, STP)
250
200
150
100
50
0
30
25
20
15
10
5
0
12000
Food waste composition 1.00
Food waste composition 0.80
Food waste composition 0.60
Food waste composition 0.40
Food waste composition 0.20
Food waste composition 0.00
Organic acids (mg COD/L)
10000
8000
6000
4000
2000
0
12000
10000
8000
6000
4000
2000
n-Butyrate (mg COD/L)
0
5000
4000
3000
2000
1000
Alcohols (mg COD/L)
0
5000
4000
3000
2000
1000
0
0.0
0.5
1.0
1.5
2.0
2.5
3.0
Time (days)
Fig. 1. Development of biogas (H2 and CH4),
carbohydrate and soluble products
with time at 2.0 % of VS
concentration
Methane was observed in all the bottles
where sewage sludge was added, due to
methanogenic bacteria in sewage sludge
(Wang et al., 2003). However, the amount of
methane was less than 8.1 mL/g VS, which
was much lower than reported values (17.5
L/g VS) in which the methanogenic bacteria
was externally dosed (Chu et al., 2002).
Carbohydrate degradation and organic
acids production almost ceased as hydrogen
production ended up. In most cases, nbutyrate was produced simultaneously with
hydrogen production. Simultaneous nbutyrate production with hydrogen was also
reported in anaerobic hydrogen fermentation
(Lay et al., 1999; Noike et al., 2000),
meaning that Clostridium sp. were related
with hydrogen production in this study
(Payot et al., 1998; Yokoi et al., 1998).
H2/VFA production was followed by
alcohols production. In normal batch culture,
Clostridium sp. form H2/VFAs during the
exponential growth phase, and alcohols in
the late growth phase (Lay et al., 1999;
Ueno et al., 2001). Alcohols represent
hydrogen that has not been liberated as a gas
(Hawkes et al., 2002). Ethanol was the most
abundant alcohol, and small amounts of 2propanol, butanol and 2-pentanol were also
detected.
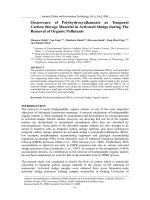
Effects of VS concentration and mixing ratios on hydrogen fermentation
The hydrogen production potential of food waste was found over 34.0 mL/g VS at all the
VS concentrations as shown in Fig. 2 It is known that hydrogen production using
concentrated substrates higher than 1% TS is needed for suitable energy production system
- 182 -
Journal of Water and Environment Technology, Vol.1, No.2, 2003
(Hawkes et al., 2002). In this study, hydrogen production potential increased as VS
concentration increased up to 3.0 % (3.15 % as TS). The maximum potential was 59.2 mL/g
VS, which was in the range of reported maximum potential of carbohydrate-rich biomass such
as rice bran, carrot, cabbage (Okamoto et al., 2000; Noike et al., 2000). The hydrogen
production potential decreased as VS concentration increased further. Product inhibition by
H2 and VFAs might cause the decrease in the hydrogen production potential at 5.0 % of VS
concentration (Van Ginkel et al., 2001; Lay, 2001). The hydrogen production potential
decreased as sewage sludge composition increased. Hydrogen production over 2.2 mL/g VS
could be achieved only when food waste composition was higher than 20%. The reasons of
insignificant hydrogen production from sewage sludge might be the methanogens contained
in sludge and low carbohydrate concentration (Wang et al., 2003a).
5
5
15
25
30
35
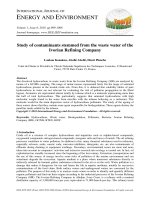
However, the maximum hydrogen yield
of 1.01 mole H2/mole hexoseadded (1.12 mole
4
45
35
50
15
H2/mole hexoseconsumed) was found at the
25 30
40
5
20
55
mixing ratio of 80:20 (food waste:sewage
3
10
45 50
35
sludge) and at the VS concentration of 3.0 %
55
30
40
15
25
5
as shown in Fig. 3 Addition of sewage
50
20
2
45
sludge to 20 % of total VS enhanced
10
35
40
20
30
25
hydrogen yield (based on carbohydrate) at
15 20
1
5
35
VS concentrations ranging 1.0 to 5.0 %. It
10
30
25
15
20
5
was reported that adequate control of
0
20
40
60
80
100
Food waste composition (%, VS basis)
inorganic nutrient can enhance the hydrogen
Fig. 2 Constant hydrogen production
production (Hawkes et al., 2002). In this
potential (mL H2/g VS) contour lines
study, however, the concentrations of
against food waste composition and
nutrients such as phosphorus and iron were
VS concentration
sufficiently supplemented (Lee et al., 2001;
Fang et al., 2002). Nitrogen was not externally dosed, but carbohydrate to nitrogen ratio was
less than 19.3 g carbohydrate-COD/g TKN-N, which meant nitrogen was also sufficient
(Mizuno et al., 2000; Van Ginkel et al., 2001; Lin and Chang, 2003).
Protein would be a better explanation for the synergic effect. It was well known that protein
such as peptone or yeast extract was better a nitrogen source than ammonium salts or urea for
activation and growth of Clostridium sp. (Mitchell, 2001). Addition of protein was helpful or
even indispensable, sometimes, for the hydrogen production in both pure and mixed culture
(Taguchi et al., 1996; Ueno et al., 2001; Yokoi et al., 2001). Food waste is a carbohydrate-rich
waste (0.56 g carbohydrate-COD/g VS and 0.25 g protein-COD/g VS), while sewage sludge
is a protein-rich waste (0.20 g carbohydrate-COD/g VS and 0.73 g protein-COD/g VS).
Addition of sewage sludge from 0 to 20 % of total VS decreased carbohydrate to protein ratio
20
40
VS concentration (%)
10
- 183 -
Journal of Water and Environment Technology, Vol.1, No.2, 2003
from 2.24 to 1.85 g carbohydrate-COD/g protein-COD.
The specific hydrogen production rate increased as both food waste composition and VS
concentration increased as shown in Fig. 4 It was reported that the production rate was less
inhibited than the production yield (Lay, 2001; Van Ginkel et al., 2001). The maximum
hydrogen production rate was 22.6 mL H2/g VSS/h, which was in the range of reported values
in serum bottle tests using organic wastes (Lay et al., 1999; Lay, 2001).
5
5
0.10
0.20
6
0.60
0.30
10
0.40 0.50
14
20
4
4
0.60
0.10
0.20
0.30
0.80
0.70 0.80
0.50
0.40
0.90
3
0.90
0.90
0.60
0.10
0.20
0.70
0.30
2
0.80
0.50
0.40
0.80
0.60
6
VS concentration (%)
VS concentration (%)
18
8
2
0.70
22
16
12
4
8
3
16
12
4
10
18
14
2
16
6
12
4
2
8
2
10
0.70
14
8
6
0.30
0.10
0.20
20
40
6
0.50
0.40
1
0.60
0.30
0.20
0.10
0
12
4
4
1
10
60
2
2
0.50
0.40
80
0
100
Food waste composition (%, VS basis)
Fig. 3 Constant hydrogen yield (mole
H2/mole hexoseadded) contour lines
against food waste composition and
VS concentration
20
40
60
80
100
Food waste composition (%, VS basis)
Fig 4 Constant specific hydrogen production
rate (mL H2/g VSS./h) contour lines
against food waste composition and
VS concentration
CONCLUSIONS
Food waste and sewage sludge at various VS concentration (from 0.5 to 5.0 %, w/v) and
mixing ratio of food waste to sewage sludge (from 0:100 to 100:0) were used for fermentative
production of hydrogen. After lag-phase shorter than 0.8 day, hydrogen was produced rapidly.
The metabolic results indicated that the characteristics of the heat-shocked digester sludge
converting the organic wastes were similar to those of anaerobic spore-forming bacteria,
Clostridium sp. The hydrogen production potential of food waste was found over 34.0 mL/g
VS at all the VS concentrations. The maximum potential of 59.2 mL/g VS was found at 3.0 %
of VS concentration. The potential decreased as sewage sludge composition increased. The
maximum hydrogen yield of 1.01 mole H2/mole hexoseadded was, however, achieved at the
sewage sludge composition of 20 % and at the VS concentration of 3.0 %. Increase of protein
concentration by adding sewage sludge might cause the synergic effect. The specific
- 184 -
Journal of Water and Environment Technology, Vol.1, No.2, 2003
hydrogen production rate increased up to 22.6 mL H2/g VSS/h as both food waste
composition and VS concentration increased. Use of food waste and sewage sludge as the
main and the auxiliary substrates seems feasible way to produce hydrogen.
ACKNOWEDGEMENT
This work was supported by grant No. M1-0203-00-0063 from the National Research
Laboratory Program of the Korean Ministry of Science and Technology.
REFERENCES
APHA, AWWA, WEF, 1998. Standard Methods for the examination of Water and Wastewater,
20 th ed., APHA, Washington, D.C.
Chen, C.-C., Lin, C.-Y. and Lin, M.-C., 2002. Acid-base enrichment enhances anaerobic
hydrogen production process, Appl. Microbiol. Biotechnol., 58, 224-228.
Chu, C. P., Lee, D. J., Chang, B.-V. and You, C. S., 2002. Weak ultrasonic pretreatment on
anaerobic digestion of polyelectrolyte flocculated activated biosolids. Wat. Res. 36, 26812688.
Dubois, M., Gilles, K. A., Hamilton, J. K., Rebers, P. A. and Smith, F., 1956. Colorimetric
method for determination of sugars and related substances. Anal Chem., 28, 350-356.
Fang, H. H. P. and Liu, H., 2002. Effect of pH on hydrogen production from glucose by a
mixed culture, Bioresource Technol., 82, 87-93.
Hallenbeck, P. C. and Benemann, J. R., 2002. Biological hydrogen production; fundamentals
and limiting processes, Int. J. Hydrogen Energy, 27, 1185-1193.
Han, S.-K. and Shin, H.-S., 2002. Enhanced acidogenic fermentation of food waste in a
continuous-flow reactor, Waste Manage. Res., 20, 110-118.
Hanaki, K., Matsuo, T. and Nagase, M, 1981. Mechanism of inhibition caused by long-chain
fatty acids in anaerobic digestion process, Biotechnol. Bioeng., 23, 1591-1610.
Hawkes, F. R., Dinsdale, R., Hawkes, D. L., Hussy, I., 2002. Sustainable fermentative
hydrogen production: challenges for process optimization. Int. J. hydrogen energy, 27,
1339-1347.
Lafitte-Trouquē, S. and Forster, C. F., 2000. Dual anaerobic co-digestion of sewage sludge
and confectionery waste, Bioresource Technol., 71, 77-82.
Lay, J.-J., 2000. Modeling and optimization of anaerobic digested sludge converting starch to
hydrogen, Biotech. Bioeng., 68(3), 269-278.
Lay, J.-J., 2001. Biohydrogen generation by mesophilic anaerobic fermentation of
microcrystalline cellulose, Biotechnol. Bioeng., 74(4), 280-287.
Lay J.-J., Lee, Y. J. and Noike, T., 1999. Feasibility of biological hydrogen production from
- 185 -
Journal of Water and Environment Technology, Vol.1, No.2, 2003
organic fraction of municipal solid waste. Wat. Res. 33(11), 2579-2586.
Lay, J.-J., Fan, K.-S., Chang, J.-1, Ku and C.-H., 2003. Influence of chemical nature of
organic wastes on their conversion to hydrogen by heat-shock digested sludge. Int. J.
Hydrogen Energy, 28, 1361-1367.
Lee, Y. J., Miyahara, T. and Noike, T., 2001. Effect of iron concentration on hydrogen
fermentation. Bioresource Technol., 80, 227-231.
Lin, C. Y. and Lay, C. H., 2003. Carbon/nitrogen-ratio effect on fermentative hydrogen
production by mixed microflora, Int. J. Hydrogen Energy (accepted).
Ministry of Environment, 2002. The state of solid waste generation and treatment in 2001,
Seoul, Korea: Ministry of Environment, Korea.
Miron, Y., Zeeman, G, Van Lier, J. B. and Lettinga, G., 2000. The role of sludge retention time
in the hydrolysis and acidification of lipids, carbohydrates and proteins during digestion of
primary sludge in CSTR systems, Wat. Res., 34(5), 1705-1713.
Mitchell, W. J., 2001. Biology and physiology. In: Bahl, H. and Pűrre, P., Clostrida:
Biotechnology and medical applications. Weinheim, Germany: Wiley-VCH, pp. 53-68.
Mizuno, O., Dinsdale, R., Hawkes, F. R., Hawkes, D. L. and Noike, T., 2000. Enhancement of
hydrogen production from glucose by nitrogen gas sparging, Bioresource Technol., 73,
59-65.
Momirlan, M. and Veziroğlu, T., 1999. Recent directions of world hydrogen production,
Renew. Sust. Energ. Rev., 3, 219-231.
Noike, T. and Mizuno, O., 2000., Hydrogen fermentation of organic municipal wastes, Wat.
Sci. Tech., 42(12), 155-162.
Noike, T., Takabatake, H., Mizuno, O. and Ohba, M., 2002. Inhibition of hydrogen
fermentation of organic wastes by lactic acid bacteria, Int. J. Hydrogen Energy, 27, 13671371.
Okamoto, M., Miyahara, T., Minuno, O. and Noike, T., 2000. Biological hydrogen potential of
materials characteristic of the organic fraction of municipal solids wastes, Wat. Sci. Tech.,
41(3), 25-32.
Owen, W. F. and Stuckey D. C., Healy, J. B., Jr., Young, L. Y. and McCarty, P. L., 1979.
Bioassay for monitoring biochemical methane potential and anaerobic toxicity. Wat Res.,
13, 485-493.
Payot, R., Guedon, E., Cailliez, C., Gelhage, E. and Petitdemange, H., 1998. Metabolism of
cellobiose by Clostridium celluolyticum growing in continuous culture: evidence for
decreased NADH reoxidation as a factor limiting growth, Microbiology, 144, 375-384.
Rifkin, J., 2002. The hydrogen economy: the creation of the worldwide energy web and the
redistribution of the power on earth. New Work, NY, US: Penguin Putnam, pp. 15-17.
Schafer, P. L. and Farrell, J. B., 2000. Advanced anaerobic digestion systems, Wat. Environ.
Tech., 12(11), 26-32.
- 186 -
Journal of Water and Environment Technology, Vol.1, No.2, 2003
Smith, P. K., Krohn, R. I., Hermanson, G. T., Mallia, A. K., Gartner, F. H., Provenzano, M. D.,
Fujimoto, E. K., Goeke N. M., Olson, B. J. and Klenk D. C., 1985. Measurement of
protein using bicinchoninic acid, Anal. Biochem., 150, 76-85.
Sparling, R., Risbey, D. and Poggi-Varaldo, H. M., 1997. Hydrogen production from inhibited
anaerobic composters, Int. J. Hydrogen Energy, 22(6), 563-566.
Taguchi, F., Yamada, K., Hasegawa, K., Taki-Saito, T. and Hara, K., 1996. Continuous
hydrogen production by Clostridium sp. Strain No. 2 from cellulose hydrolysate in an
aqueous two-phase system, J. Ferment. Bioeng., 82(1), 80-83.
Ueno, Y., Otauka, S. and Morimoto, M., 1996. Hydrogen production from industrial
wastewater by anaerobic microflora in chemostat culture, J. Ferment. Bioeng., 82, 94-207.
Ueno, Y., Haruta, S., Ishii, M. and Igarashi, Y., 2001. Microbial community in anaerobic
hydrogen-producing microflora enriched from sludge compost, Appl. Microbiol.
Biotechnol., 57, 555-562.
Van Ginkel, S., Sung, S. and Lay, J.-J., 2001. Biohydrogen production as a function of pH and
substrate concentration, Environ. Sci. Technol., 35, 4726-4730.
Wang, C. C., Chang, C.W., Chu, C. P., Lee, D. J., Chang, B.-V., Liao, C. S. and Tay, J. H.,
2003a. Using filtrate of waste biosolids to effectively produce bio-hydrogen by anaerobic
fermentation, Wat. Res., 37, 2789-2793.
Wang, C. C., Chang, C. W., Chu C. P., Lee D. J., Chang, B.-V. and Liao, C. S., 2003b.
Producing hydrogen from wastewater sludge by Clostridium bifermentans, J. Biotechnol.,
102, 83-92.
Yokoi, H., Tokushige, T., Hirose, J., Hayashi, S. and Takasaki, Y., 1998. H2 production from
starch by a mixed culture of Clostridium butyricum and Enterobacter aerogenes,
Biotechnology Letters, 20(2), 143-147.
Yokoi, H., Saitsu, A., Uchida, H., Hirose, J., Hayashi, S. and Takasaki, Y., 2001. Microbial
hydrogen production from sweet potato starch residue, J. Biosci. Bioeng., 91(1), 58-63.
- 187 -