Sustainability of an energy conversion system in Canada involving large-scale integrated hydrogen production using solid fuels
Bạn đang xem bản rút gọn của tài liệu. Xem và tải ngay bản đầy đủ của tài liệu tại đây (823.67 KB, 38 trang )
INTERNATIONAL JOURNAL OF
ENERGY AND ENVIRONMENT
Volume 2, Issue 1, 2011 pp.1-38
Journal homepage: www.IJEE.IEEFoundation.org
Sustainability of an energy conversion system in Canada
involving large-scale integrated hydrogen production using
solid fuels
Nirmal V. Gnanapragasam, Bale V. Reddy, Marc A. Rosen
Faculty of Engineering and Applied Science, University of Ontario Institute of Technology, Oshawa ON,
L1H 7K4, Canada.
Abstract
The sustainability of a large-scale hydrogen production system is assessed qualitatively. The system uses
solid fuels and aims to increase the sustainability of the energy system in Canada through the use of
alternative energy forms. The system involves significant technology integration, with various energy
conversion processes (e.g., gasification, chemical looping combustion, anaerobic digestion, combustion
power cycles-electrolysis and solar-thermal convertors) interconnected to increase the utilization of solid
fuels as much as feasible in a sustainable manner within cost, environmental and other constraints. The
qualitative analysis involves ten different indicators for each of the three dimensions of sustainability:
ecology, sociology and technology, applied to each process in the system and assessed based on a tenpoint quality scale. The results indicate that biomasses have better sustainability than coals while newer
secondary processes are essential for primary conversion to be sustainable, especially when using coals.
Also, new developments in CO2 use (for algae-to-oil and commercial applications) and storage will in
time help improve sustainability.
Copyright © 2011 International Energy and Environment Foundation - All rights reserved.
Keywords: Centralized hydrogen production, Hydrogen energy, Solid fuels, Coal, Biomass, Municipal
solid waste, Gasification, Anaerobic digestion, Sustainability, Canada energy market.
1. Introduction
Technologies to convert carbon-based solid fuels to useful energy forms are available, although some
challenges remain regarding pollution capture. These technologies include advanced gasification,
combustion and gas-solid looping processes. Some are at the developmental stage while others are
commercially available [1-3]. Single-function systems (i.e. a system with only one product, like
electricity or a fuel or a chemical commodity) predominate in the existing Canadian energy market [4]. A
polygeneration system involves a mix of electricity, chemical commodity, fuel and heat production
within a single plant. In recent years, the integration of various energy conversion technologies and
processes so as to form polygeneration systems has received increasing attention from the Canadian
industry and government [5].
Current scientific data on global warming [6] have added momentum to the initiatives being considered
by governments and industries to switch to non-carbon-based energy sources. For example, many
propose for a hydrogen energy system in which hydrogen and electricity are the primary energy carriers,
facilitating the use of non-fossil-based energy resources [3,7]. Many feel that the shift to alternative
ISSN 2076-2895 (Print), ISSN 2076-2909 (Online) ©2011 International Energy & Environment Foundation. All rights reserved.
2
International Journal of Energy and Environment (IJEE), Volume 2, Issue 1, 2011, pp.1-38
energy sources would also help to improve national economies by creating new industries and
employment opportunities, advance policies to facilitate new investments and business models and create
funds for development through large government stimulus packages [7-9]. The most advantageous
alternative energy carrier is often predicted to be hydrogen, along with hydrogen-based fuels. Hydrogen
energy could find significant applications in the transportation sector and distributed power generation,
and would further facilitate renewable energy implementation by acting as a storage medium [10,11].
Many countries including Canada have already initiated research and commercial programs to produce
alternative fuels such as ethanol and hydrogen [3,7,10,12,13].
Hydrogen energy systems could also lead to an increase in the contribution of coal and natural gas to
local energy markets, where they are mainly used for heating and power generation. When using
hydrogen produced from coal or natural gas in vehicles, the CO2 emissions can be addressed at the
source (the hydrogen production process) before the energy carrier is delivered to the vehicles, making
the capture and storage of CO2 more economic [3]. Such a centralized ability to capture carbon dioxide is
not possible when using gasoline or ethanol or Fischer-Tropsch-derived diesel fuel. The post-combustion
capture of CO2 from coal and natural gas in power plants is less economic than CO2 capture associated
with hydrogen production when using these two energy sources [14], except when using oxy-fuel
combustion [15], which is currently at the developmental stage.
The need for large-scale hydrogen production, especially in countries with large transportation sectors,
has been suggested in numerous hydrogen initiatives [3,7,10,12,13,16]. In line with this need, an
integrated approach to large-scale hydrogen production using solid fuels is proposed here, which aims to
improve the sustainability of the energy system. The conceptual design for this approach is shown in
Figure 1. This approach involves a synthesis of multi-conversion sub-systems into a large single-function
system to produce hydrogen. Various solid fuels are used, including coal, biomass, municipal solid
wastes (MSWs), forestry-based solid wastes, energy crops, and agricultural and industrial solid residue.
These solid fuels provide the thermo-chemical energy required for several different primary conversion
processes (sub-systems) working together in one location, resulting in the simultaneous production of
several hydrogen streams (as shown in Figure 1). The hydrogen is derived in various stages from the
hydrogen portion of hydrocarbons and by splitting water.
The type of large-scale integration proposed here would create opportunities to enhance the utilization of
solid fuels by reducing overall material and energy waste [2], thereby reducing environmental pollution
while meeting proposed greenhouse gas limits in Canada [15]. These limits may be achieved in part by
replacing gasoline with non-carbon-based transportation fuels such as hydrogen or electricity. The
transportation sector is significant in Canada since it contributes 30% more CO2 than the power
generation sector [17]. A sustainability assessment of such a large-scale system in a fast changing
Canadian energy market is necessary to help in decision making, along with techno-economic
assessments of each component and sub-system within the proposed system, to identify the best
combination of components.
Measuring sustainability is a major issue as well as a driving force in determining the impact of various
indicators on each of the components within an advanced energy system [18]. An effective sustainability
indicator has to meet characteristics reflecting a problem and criteria to be considered [19]. Selection,
grouping, judging, weighing and normalizing of these indicators are somewhat subjective and dependent
on the domain for the sustainability analysis (the system shown in Figure 1 in this work) [18,20,21]. A
qualitative analysis on the system in Figure 1 is undertaken here, involving ten different indicators for
each of the three dimensions of sustainability: (i) ecology, (ii) sociology and (iii) technology. These
indicators are applied to each process in the system and assessed based on a ten point scale. Each process
or element is selected for the system, based on a near-average sustainability value for at least one of the
dimensions. Rather than estimating a hydrogen energy-based sustainability ratio [22], a content-oriented
quality grade is assigned to the ten indicators in each of the three dimensions for each process or element
involved in the proposed system.
The current work follows the work of Gnanapragasam et al. [23], where the large-scale system (Figure 1)
was proposed and its feasibility investigated within current and foreseeable Canadian energy markets.
The objective in this work is to perform a qualitative sustainability assessment of such a system in
Canada. The steps in the analysis include the following:
• Definition of qualitative sustainability indicators, ten for each of the three dimensions, for every
process or element involved in the proposed system.
ISSN 2076-2895 (Print), ISSN 2076-2909 (Online) ©2011 International Energy & Environment Foundation. All rights reserved.
International Journal of Energy and Environment (IJEE), Volume 2, Issue 1, 2011, pp.1-38
•
•
•
3
Generation of values for each these indicators using a ten point grade based on a high of 1 and
low of 0 as indices, depending on the characteristic of the problem or criteria associated with
each element or process.
Assessment (separately and jointly) of the generated indices for the six categories of elements or
processes.
Comparison of the indicators within each sustainability dimension, to highlight the processes
requiring attention for improving sustainability, by categorizing the components of the system
into six groups: (i) solid fuels; (ii) on-site fuel handling; (iii) primary conversion processes; (iv)
secondary conversion processes; (v) carbon capture and sequestration (CCS); and (vi) future
extensions.
Figure 1. Simplified concept for a large-scale, integrated hydrogen production system using solid fuels:
adapted from Gnanapragasam et al., 2010 [60]
ISSN 2076-2895 (Print), ISSN 2076-2909 (Online) ©2011 International Energy & Environment Foundation. All rights reserved.
4
International Journal of Energy and Environment (IJEE), Volume 2, Issue 1, 2011, pp.1-38
It is assumed that energy system changes will occur based on past trends from other projects within
Canada’s energy market. It is recognized that enhanced sustainability of such a large system depends on
the choice of technologies, which in turn is dependent on future changes in the global energy market.
2. Large-scale integrated hydrogen production system
The large-scale production of hydrogen using an integration of conversion technologies as shown in
Figure 1 is intended to exploit the advantages of each individual technology developed to use certain
types of solid fuels. The proposed system is described here by following the flow of materials starting
from solid fuels (top left-hand corner in Figure 1). The upstream processes address the steady supply of
solid fuels by storing and drying in large quantities, which is common to coals and biomass, with
commercially established methods [24]. The required utilities include air, water/steam and electricity for
various processes and equipment in the system. The primary energy conversion processes include
gasification, direct chemical looping, anaerobic digestion and combustion. Except for combustion, these
processes involve conversion of solids into gases containing varying proportions of hydrogen.
2.1 Gasification processes
Solid gasification is an established and tested commercial process for converting solid fuels into a
gaseous form (syngas), from which hydrogen can be enriched and separated with further processing
(secondary energy conversion stages).
The gasification process in general comprises the following devices: fuel delivery system, air separation
unit, ash collecting hoppers, syngas cooler and jacket steam generator [24]. Gasification is considered an
effective method for thermal hydrogen production [25] and is expected to play an important role in the
transition to a hydrogen economy [26]. A comparison of commercial gasification processes [27]
indicated that the transport gasifier has the lowest cost for electricity generation, while the Texaco and
British Gas Lurgi gasifiers have the highest electricity costs.
The plasma gasification in Figure 1 is a different type of gasification process, which can be used for
producing hydrogen-rich syngas with no limitation on the feedstock characteristics, and which requires
only a limited amount of air/oxygen [28]. Plasma gasification is a high-temperature pyrloysis process
that is becoming commercially popular in solid waste management facilities. This process can produce
30% (by volume) more syngas when steam is used as the gasifying medium. Plasma gasification is more
suitable for sewage sludge and solid fuels with higher moisture contents [29,30].
Ultra-superheated steam (USS) gasification yields ultra-superheated steam composed of substantial
amounts of water vapour, carbon dioxide and highly reactive free radicals at temperatures ranging from
1316 to 2760oC [31]. When this clear colourless flow comes into contact with solid fuels, it induces rapid
gasification to form a syngas with 50% more hydrogen content than other gasification processes [32].
This process offers better use of low-quality steam by using methane to produce the USS.
The supercritical water gasification (SCWG) process [33] exploits the physical and chemical properties
of water above its critical point (T = 374oC, P = 221 bar). These properties allow a nearly complete
conversion of the organic substances contained in solid fuels into an energy-rich syngas containing
hydrogen, carbon dioxide and methane. The break-even point between thermal gasification and
supercritical water gasification is approximately 40% moisture content [34].
Solar gasification is a hybrid of solar and fossil-fuel based endothermic processes, in which fossil fuels
are used exclusively as the chemical source for hydrogen production, and concentrated solar radiation as
the source of high-temperature process heat [35]. Methods for carrying out high-temperature reactions
such as biomass pyrolysis or gasification using solar energy have been reported [36], and they have been
coupled with chemical looping combustion for hydrogen production. Solar thermal gasification of corn
stover [37] showed that it has higher solid-to-gas conversion efficiencies than alternative processes.
More details on these processes are included in a review [38] of primary energy conversion technologies
for producing hydrogen from solid fuels.
2.2 Direct chemical looping combustion
Chemical looping combustion (CLC), developed in the mid 1990s [39], uses metallic oxide as an oxygen
carrier for the combustion process. During the reaction in the reduction reactor, the oxygen in the metal
oxide is exchanged with the carbon in the fuel, forming CO2 and water [40-42]. The water is condensed
to separate CO2, which is stored. Hydrogen is produced from water in the oxidation reactor where the
metal is converted back to its oxide. This process has a greater potential for CO2 separation compared to
ISSN 2076-2895 (Print), ISSN 2076-2909 (Online) ©2011 International Energy & Environment Foundation. All rights reserved.
International Journal of Energy and Environment (IJEE), Volume 2, Issue 1, 2011, pp.1-38
5
membrane separation of CO2. There are two options for using chemical looping combustion during the
reduction and oxidation processes to produce two streams (hydrogen and CO2). The first option is after
gasification by using syngas to reduce the metal oxides and the second is by using solid fuels directly
with metal oxides [42-44].
2.3 Anaerobic digestion
Anaerobic digestion is a biological process in which organic wastes are converted in the absence of air to
biogas, i.e. a mixture of methane (55-75 vol. %) and carbon dioxide (25-45 vol. %) as well as small
amounts of hydrogen sulphide (H2S) and ammonia (NH3). During anaerobic digestion, typically 30-60%
of the solid input is converted to biogas [45]. The by-products consist of an undigested residue and
various water-soluble substances. Depending on the digestion system (wet or dry), the average residence
time is between ten days and four weeks. The use of biomass and organic waste streams via anaerobic
digestion has the potential to play a key role in fostering energy recovery from biodegradable waste in a
sustainable manner [46]. With current developments in reformer technologies, hydrogen can be produced
from methane derived from anaerobic digestion of organic waste material, much of which is currently
land filled [47].
2.4 Advanced pressurized fluidized bed combustion
Pressurized fluidized bed combustion (PFBC) of solid fuels to produce electricity [48] uses a
combination of Brayton and Rankine power cycles. In the proposed system, electricity generated by
PFBC is used for several utilities within the system and the remainder is used to split water into
hydrogen and oxygen in an high temperature electrolyser [48,49]. The heat for the electrolyser is derived
from the PFBC. PFBC can also be coupled with a gasification process by having only part of the solid
fuel gasified (partial gasification) for hydrogen production and combusting the char remaining from the
partial gasification step in the PFBC unit to produce steam for electricity generation [14]. This is one of
the reasons for opting to use PFBC in the proposed system, which is in addition to it being one of the
most efficient combustion processes for solid fuels, along with ultra-super critical pulverized coal
combustion [2,14,50].
2.5 Secondary conversion processes
After a syngas is produced from gasification, it is cooled, cleaned of solids and sulphur (Figure 1)
through various processes [51] and sent to the water-gas shift reaction [24], where the CO in the syngas
is converted to H2 and CO2 using steam. Then, the hydrogen is separated from CO2 using membrane
reactors [50] and sent for purification using the pressure swing adsorption (PSA) process. The purified
hydrogen is stored. An alternative prospective approach is to use chemical looping combustion to reduce
CO and produce separate streams of hydrogen and CO2. The hydrogen from direct chemical looping is
also sent to the central hydrogen storage after cooling to remove water.
The methane and CO2 produced using anaerobic digestion passes through an auto-thermal reformer
(ATR), which has been reported to yield a product with fewer trace impurities than other coal-based
hydrogen production processes, mainly due to the higher operating temperature generated by the
oxidation step [51]. The produced hydrogen, which is part of a mixture containing CO and steam, is
separated using an appropriate membrane reactor for this type of mixture [52].
The hydrogen from the high temperature electrolyser, which follows the combustion-to-electricity-tohydrogen route [49,50], is directed to the central hydrogen storage.
2.6 Carbon capture and sequestration (CCS)
Although there are other pollutants, such as SO2, NOx, Hg and COS, the emphasis of this system’s
design in the pollution control aspect is to address the concerns associated with increasing CO2 emissions
[6], which are mainly associated with carbon-based solid fossil fuels. Thus, the hydrogen from various
gas streams, subsequent to cleaning and particle separation, is accompanied by CO2, which can be stored
[53]. Two paths for the CO2 are envisioned here, as shown in Figure 1. The commercial route is already
applied by several industries for using and storing CO2 in various forms. The main challenge for using
carbonaceous solid fuels in producing hydrogen is the disposal/storage of the captured CO2 in an
environmentally feasible manner [16]. The current commercial applications include industrial use of CO2
in supporting large refrigeration systems, making dry ice, enhanced oil recovery, and various chemical
manufacturing operations. Also some CO2 produced in the system may be used for transporting solid
ISSN 2076-2895 (Print), ISSN 2076-2909 (Online) ©2011 International Energy & Environment Foundation. All rights reserved.
6
International Journal of Energy and Environment (IJEE), Volume 2, Issue 1, 2011, pp.1-38
fuels into high-pressure reactors. The remaining CO2 is sent for large-scale underground storage [54].
Such processes are being implemented commercially in recent years through a process known as
geological sequestration (GS), where the CO2 is compressed and transported deep underground into
aquifers, depleted oil and gas reservoirs and dried underground coal beds. Some large-scale CO2 storage
projects are already in operation and under construction, while others are the subject of feasibility studies
[55].
The future route in Figure 1 for the CO2 storage is aimed at two strategies still at the research stage. One
involves a mineral storage where CO2 is reacted with naturally occurring Mg and Ca containing minerals
to form carbonates. This process has several advantages, the most significant of which is the fact that
carbonates have a lower energy state than CO2, which is why mineral carbonation is thermodynamically
favourable and occurs naturally [56]. Thus the carbonates are stable and are unlikely to convert back to
CO2 under standard conditions. The CO2 recycle or reuse is another option that involves metal oxides
such as Fe2O3, ZnO and CaO to split CO2 into CO and oxygen, for use in various processes [57]. The
latter option in which CO2 is split into CO and oxygen is an artificial photosynthesis process; it is a
greenhouse-type concept for controlled feeding of biologically-engineered plants that can consume, in a
controlled environment, high volumes of CO2 to store carbon and emit oxygen [58].
There is an upcoming and promising third option of disposing CO2, converting CO2 into microalgae
using sunlight and water, via algae-based artificial photosynthesis. Microalgae are microscopic
photosynthetic organisms. They generally produce more of the kinds of natural oils needed for biodiesel
extraction [59]. Autotrophic algae enable photosynthesis by utilizing light (from the sun or artificial
sources such as light through fiber optic cables), CO2 and water to grow the candidate algae (depending
on the conditions available for growth). Heterotrophic algae use thermal energy from waste heat
applications, CO2 and nutrients derived from biogas effluents, leachate in landfills and waste water from
fermenting processes.
2.7 Planned future extensions
Two sections in the proposed system in Figure 1 are intended for a planned future extension: (i) the
upstream cleaning of feedstock (top right corner) and (ii) solids recycle coupled with a cement plant
(bottom left corner). Upstream cleaning enhances the quality of feedstock thus improving the efficiency
of various conversion processes [1] and also simplifies the separation of pollutants associated with solid
fuels [2]. Some of the envisioned upstream cleaning process are (i) using a cartridge system, where all
solid feedstocks are blended to form a uniform mixture containing a standardized composition, (ii)
treating the feedstock with solvents to clean the fuel of unusable residue, (iii) blending of high-sulphur,
high-grade coals with low-sulphur, low-grade coals and high-ash biomass (to avoid sintering), and (iv)
upgrading low-grade solid fuels with pre-treatment using heavy oils [2]. Ash is among the most recycled
solid within the system; after utilization it may be used to produce concrete blocks as part of the cement
manufacturing extension plan.
The type of conversion technologies chosen in this work for hydrogen production and CO2 capture and
storage are based on the effectiveness of each technology, as determined by its demonstrated capabilities
from industrial and research data. Thus the system is anticipated to be capable of handling several types
of solid fuels at a given time and producing hydrogen in large quantities while delivering captured CO2
in an environmentally and economically viable manner. As illustrated at the bottom of Figure 1,
hydrogen represents a green means of energy distribution while CCS (in red) represents the potential to
hinder the use of carbon-based solid fuels if not adequately implemented.
2.8 Status of hydrogen market in Canada
Hydrogen is mostly used in Canada at present in chemical industries. Approximately 35% of the
hydrogen use is for chemical production, 24% for refining of oil, 23% for heavy oil upgrading and 18%
for chemical process by-products [17]. Hydrogen is not yet a significant part of the direct energy system
in Canada. Most of the hydrogen used in the chemical industry is produced from natural gas by steam
methane reforming (SMR). The crude oil refining industry produces hydrogen by reforming more
complex hydrocarbons available within the refining processes [60].
Because of its large fossil fuel resources, Western Canada dominates Canadian hydrogen production.
Canada’s largest hydrogen plants are located in the oil-upgrading facilities of this region. Three plants in
Alberta and one in Saskatchewan together produce nearly 790,000 tonnes of hydrogen annually [60]. The
upgrading of heavy oil from the Alberta oil sands has recently been one of Canada’s fastest-growing
ISSN 2076-2895 (Print), ISSN 2076-2909 (Online) ©2011 International Energy & Environment Foundation. All rights reserved.
International Journal of Energy and Environment (IJEE), Volume 2, Issue 1, 2011, pp.1-38
7
hydrogen demand sectors [15], with annual production predicted by some to rise to 2.8 megatonnes by
2020. Recent challenges to the global economies render such predictions questionable, unless economic
recoveries occur quickly. Potential future environmental limitations also can affect such predictions.
Electrolytic hydrogen production makes up an estimated five percent of Canada’s supply [60].
The amount of surplus hydrogen (hydrogen produced that is not used at the generating site) produced in
Western and Eastern Canada is estimated at 200,000 tonnes per year [60]. From an energy perspective,
this amount of hydrogen is equivalent to 760 million litres of gasoline [17] or the equivalent to fuel one
million light-duty fuel cell vehicles for a year.
3. Qualitative methodology and sustainability indicators
A qualitative methodology, which is partially quantitative, was introduced in our prior work [61], for
evaluating the sustainability of energy systems involving hydrogen production from solid fuels. The
indicators for each of the three dimensions of sustainability are chosen in this work, in the same manner
as the previous work [61], so that they are mostly independent of the indicators in other dimensions, but
related to them in the broader sense of the system’s end product – hydrogen. This is a new methodology
specific to this work in assessing the system’s sustainability within the Canadian energy market. The
methodology is developed by defining specific indicators whose values are assessed based on many other
contributions in the literature with respect to each indicator. The methodology may be applied to
sustainability assessments of similar energy conversion systems, provided appropriate variables and
indicators are specified.
The index values for each indicator are related to other indicators depending on their definitions, and
governed by the EEE platform – energy, economy and environment. The value of indices for each of the
indicators is chosen based on the collective information obtained from an extensive literature review
relating to the respective indicator. The index value ranges from 0 to 1 divided into 10 steps. Although
index values are chosen based on an examination of pertinent data and information, the assignment is
somewhat subjective. The expectations for a maximum value of 1 is kept very high in this work, so only
very few elements within the system are capable of receiving a value of 1 for some of the indicators.
The term ‘element’ in this work means a natural resource such as solid fuels, or any other unitary item
involved in the system. The term ‘process’ means an activity which involves more than one item in
making a desired output; process types considered here include conversion processes, fuel handling
processes, and carbon capture and storage processes. The term ‘system’ refers to the proposed system
shown in Figure 1.
The main product of the system, hydrogen is considered to be the most advantageous alternative fuel for
mitigating direct CO2 emissions to the atmosphere [7] from carbon based solid fuels, while still providing
the goods and services required by society. In Canada, hydrogen is not used extensively as a fuel, but is
utilized presently in large quantities as a feedstock for various chemical processes in industries and oil
refineries.
Sustainability for the proposed system is predicted based on the assumption that a hydrogen economy
will be in place when this system is operational, which is likely at least 10 years from now [7].
3.1 Ecology indicators
In this work, ecological indicators [18] help in assessing information about ecosystems and the impact of
human activity on ecosystems pertaining to the large-scale production of hydrogen. Here the ecosystem
is considered as Canada and its energy market. Human activity involves implementation and operation of
the proposed system to obtain hydrogen in large quantities. The values of these indicators specify the
sustainability position of a particular element or process within the system along the ecological
dimension. These indicators highlight the impact of each element or process on changes to the
environment.
1. Availability: Sustainable availability of the element within Canadian market [1-7,54,62]. The
highest value of 1 is assigned for such elements or processes that are available in the local market at
competitive price and the lowest value of 0 is assigned for lack of availability, which in the current
work is negligible since the elements and processes are selected based on minimum availability of
all of them within Canadian or American markets. For example, fossil fuels such as coals and tar
sands are mostly found in western Canada [4] and the coal market is bigger in the USA providing
ISSN 2076-2895 (Print), ISSN 2076-2909 (Online) ©2011 International Energy & Environment Foundation. All rights reserved.
8
International Journal of Energy and Environment (IJEE), Volume 2, Issue 1, 2011, pp.1-38
ample supply for longer periods of time at very low costs. Similarly, for any process that is
commercially available, the sustainability index will be higher.
2. Adaptability: Requiring less number of processes to acquire and process the element, minimizing
waste generation [1,3,10,17,50,51]. A value of 1 is chosen if an element or process is highly
adaptable and 0 for the least adaptable item in the system. Values for all items in the system fall in
between 0 and 1, some having higher adaptability than others based on the review of respective
elements. For example, ecological sustainability is higher for solids handling process in Canada than
for gasification process, since the former is already an established industry serving the coal power
plants in Canada [1,13].
3. Environmental capacity: How long in terms of time and material can the global ecosystem supply
and support the element or process, without creating massive imbalances within the global
ecosystem [4,6,13,15,16,63,64]. A value of 1 is assigned if an element or process can be sustained
for a long time even with an increase in demand for it in the market place. A value of 0 is assigned if
very little resources are available in the local market and they cause a high impact on the ecosystem.
For example, a process which is capable of recycling its working materials is assigned a higher
index than a process that has less probability for reusing some of its wastes or by-products.
4. Timeline: How new or mature is the element or process, weighted by its evolution [5, 24,54,65]
within the market place. A value of 1 denotes that a process is well established and has greatly
evolved since its creation, while a value of 0 denotes that the element is “fossilized” and the process
has little chance for further improvement in functionality. For example, commercial gasification is a
mature technology with small chance for major improvements or evolution, thus established and is
assigned a higher value (0.7).
5. Material rate: Rate at which the element/process or products for and from the element/process can
be procured [4,12,16,62,63,66,90], accounting for the effectiveness of raw material and product
distribution networks. A value of 1 is assigned to the best network and 0 for the worst. For example,
coals have higher material rate sustainability index (up to 0.9) than biomasses (up to 0.5), due to the
well established network of mining and distribution.
6. Energy rate: Rate at which energy can be supplied by the element or process [4,62,67,68]. A value
of 1 denotes a high energy supply rate and 0 a low energy supply rate. This indicator helps in
assessing the ecological energy density for an element or process, the amount of energy available
per unit volume of space per time period. For example, combustion processes have a very high
energy rate compared to other process due to higher rate of chemical reaction. Coals have a very
high energy rate in that they can deliver more energy per unit mass and time than biomasses.
7. Pollution rate: The rate of pollution or emissions of any kind associated with the element or process
[1-4,16,45,56,69-71]. A value of 1 is assigned if there is very low pollution rate and a value of 0 if
there is high pollution rate. For example, consider coal use either in air combustion or oxygasification. Since the technologies for pollution removal such as for sulphur compounds (SO2, H2S,
COS) are well evolved, these processes merit a higher value than for CO2 separation and storage,
since it is still new and commercialization is yet to begin.
8. Location: How near the element/process is from the point of use [15,50,21,27,50]. A value of 1 is
assigned if the source is very near to the point of use and 0 if it is very far (if it is outside the local
market, i.e., for this work Canada and the northern USA). The system can be placed near to the main
solid fuel source, which would be coals (which have high energy densities and still transfer more
energy with CCS than other fuels). The other elements and processes are to be moved to the
system’s geographical location, increasing the operating and maintenance costs of the system. Thus
for coals and other mine-based solid fuels, low values are assigned in this work.
9. Ecological balance: Element or process that creates an imbalance in the local ecosystem. This
measure also indicates the level of recyclability or reuse of the element or process [68,72,73]. A
value of 1 is assigned if most of the element or process is recyclable or reusable and a value of 0 is
assigned if there is no achievable recyclability. For example, fossil fuels score a 0 in this regard
whereas renewable solid fuels such as biomass or MSW score a higher value, which depends on the
availability as well. Regarding processes, air-combustion of fossil fuels emits CO2 along much
ISSN 2076-2895 (Print), ISSN 2076-2909 (Online) ©2011 International Energy & Environment Foundation. All rights reserved.
International Journal of Energy and Environment (IJEE), Volume 2, Issue 1, 2011, pp.1-38
9
nitrogen (thus receiving a low value due to the imbalance it causes in local energy consumption,
since higher compression energy is required for CO2 sequestration or even for CO2 separation).
Oxy-combustion or gasification, on the other hand, produces a relatively pure CO2 exhaust stream,
enabling low energy capture (thus a higher value is assigned since the local energy imbalance is
minimal).
10. Endurance: Element work load or demand factor and a process requiring equipment maintenance [14,68,72,73]. A value of 1 is assigned if the element or process has high load and demand with lower
maintenance and a value of 0 is assigned when there is high maintenance irrespective of high or low
load. For elements such as fuels that require high equipment maintenance, a lower index value is
assigned for this sustainability indicator.
3.2 Sociology indicators
In this work, sociology indicators help in assessing impacts on the social system if the proposed
hydrogen system is implemented, in order to guide intervention or alter the course of social change [74].
Here the social system represents the communities within Canada that will benefit directly and indirectly
from the operation and products of the hydrogen system. The expected changes to the social system from
implementing the proposed hydrogen system are considered via the 10 indicators that follow. The values
of these indicators, which range from a high of 1 to a low of 0, specify the sustainability of an element or
process within the social system, thus helping to avoid any negative or undesirable changes.
1. Economics: Economic and financial benefits from the element or process
[5,10,11,20,21,50,54,60,67,75-77]. A value of 1 is assigned if maximum net economic benefit
derived from the final product (hydrogen) and a value of 0 is assigned when there is a net economic
loss from transforming solid fuels into hydrogen. For example, commercial (large-scale) gasification
shown in Figure 1 provides better overall economic benefit than solar thermal gasification due to it
exhibiting a higher volume of hydrogen production in less time than is possible when using
commercial gasification.
2. Policy: Canadian government policies and implementation trends [1,5,7,10,13,15-17,63,64]. A value
of 1 is assigned if the policies and implementation strategies support the sustainability of an element
or process and a value of 0 is assigned if they act as hindrances. Values are chosen based on
advancements in technology in dealing with energy, environment and economics of processes and
ecological sustainability of solid fuels to help in obtaining the final product of hydrogen. For
example, a government initiative to increase funding for research on biochemical routes, to produce
alternate transport fuels, helps in improving the sustainability of such processes as anaerobic
digestion [47] and algae-based biodiesel production [59].
3. Human resources: Level of direct human work input involved in procuring, manufacturing,
installing and operating an element or process, within the Canadian market [5,70,68,72,73,90]. A
value of 1 is assigned if more human work is involved, owing to the job creation and resulting
economic benefit for the society. A value of 0 is assigned if no direct human work is involved with
an element or process. For example, solids handling processes and waste disposal involve more
human labour than primary or secondary conversion processes (except during installation and
maintenance).
4. Public opinion: Public opinion regarding the nature and operation/behaviour of an element or
process [78-81,90]. A value of 1 is assigned if the majority of the population have a positive opinion
relating to an element or process and a value of 0 is assigned if there is a negative opinion. For
example, CO2 emissions particularly from burning fossil fuels have been highlighted by the media
and government bodies as the main cause of a rise of mean earth’s surface temperature [6]. So, any
element or process which does not emit CO2 or reduces it concentration in the atmosphere, is
assigned a higher value since generates positive public opinion. In the bigger picture, public opinion
often transforms into government policies, which can lead to support for measures that curb harmful
emissions, especially in Canada.
5. Environmental obligation: Social expectations regarding the environmental obligation of an element
or a process and its by-products to be benign to the environment in which society functions
ISSN 2076-2895 (Print), ISSN 2076-2909 (Online) ©2011 International Energy & Environment Foundation. All rights reserved.
10
International Journal of Energy and Environment (IJEE), Volume 2, Issue 1, 2011, pp.1-38
[6,16,45,50,54]. A value of 1 is assigned if the operation and by-products of the element/process is
environmentally benign and a value of 0 is assigned if a process or element is necessary to the
system’s operation but is capable of harming the environment without another set of processes for
protecting the environment. This indicator encourages the elimination of any process that requires
such additional measures to protect the environment or that it be used only if no alternative can be
found. For example, converting CO2 into biodiesel using sunlight or nutrients from the biogas byproduct associated with using algae is environmentally friendly in that it not only consumes some of
the CO2 emitted from burning of fossil fuels but also provides an alternate transport fuel, thus
reducing additional emissions of CO2. So, converting CO2 to algae is assigned a higher social index
value than other CO2 sequestration methods that require further processes which in turn create more
ecological imbalance (underground CO2 storage).
6. Living standards: Impact of an element or process on human living standards (focussing on basic
requirements such as food, clothing and shelter) [54,82]. A value of 1 is assigned if an element or
process within the system improves human living standards indirectly. A value of 0 is assigned if an
element or process does not improve basic living standards. For example, coals are assigned a
higher index than biomass due to their higher energy densities, which helps in producing more
hydrogen; this in turn can provide additional goods and services compared to biomass, thereby
improving basic human living standards. Even with high energy and economic penalties for
pollution control measures, coal can still produce more hydrogen than biomass [54].
7. Human convenience: Impact of an element or process on human convenience (higher living
standards and comforts that are not necessary like basic living standards) [54,82]. A value of 1 is
assigned if an element or process within the system helps in providing human comforts and a value
of 0 is assigned if an element or process does not provide human comfort, through additional
hydrogen production. The index values for solid fuels are similar to those for the previous indicator
(#6). But for some processes, the index value may be lower, e.g., if more fuel is used due to
increased secondary and environmental protection process loads in producing hydrogen.
8. Future development: Possibilities for future economic and social growth based on the nature of an
element or process [1-6,60,67,75-77]. A value of 1 is assigned if using the element or process
increases the possibility for societal development. A value of 0 is assigned if using the element or
process within the proposed system does not provide opportunities for societal development, even in
the local community. The system involves many processes that produce several by-products in
producing hydrogen. These are given higher index values since the by-products help in increasing
the overall economic and social income to the local community.
9. Per capita demand: Impact of population/customer demand on producing hydrogen with the element
or process, affecting the ability to carry out the process sustainably [6,54,82]. A value of 1 is
assigned if fewer industries use the element or process, thereby increasing market availability and,
possibly, price competitiveness. A value of 0 is assigned when the element or process is used by
many industries, which hinders availability and can reduce sustainability. For example, coals are
mostly used for power generation and in steel industries, based on its per capita availability it is
assigned a high value. But biomass per capita availability is small and is mostly used in cocombustion processes or as manure, reducing the per capita demand sustainability index.
10. Lobbying: External influences on the impact of an element or process, through political and
economic lobbies, that can affect government policies related to sustainability
[16,17,54,63,65,66,83]. A value of 1 is assigned if the process or element has effective lobbying and
a value of 0 is assigned if no lobbying is attempted. Negative lobbying is not considered at this
point. For example, the coal industry is well established economically and is engaged in political
lobbying to maintain its use within the Canadian energy market and to promote government policies
that support the coal industry [83]. In recent years, green energy programs have received extensive
lobbying due to their potential long-term contributions in mitigating global warming. So, elements
or processes associated with green energy policies (such as anaerobic digestion, plasma gasification,
supercritical water gasification, CO2 to algae) are assigned higher index values.
ISSN 2076-2895 (Print), ISSN 2076-2909 (Online) ©2011 International Energy & Environment Foundation. All rights reserved.
International Journal of Energy and Environment (IJEE), Volume 2, Issue 1, 2011, pp.1-38
11
3.3 Technology indicators
In this work, technology indicators help in assessing the knowledge, design, performance and production
aspects of an element or process selected for the hydrogen system, providing an engineering perspective.
The indicators are chosen so that they assess the technical capabilities of each element in the system on
the same level. The values of these indicators specify the sustainability of the system and its components,
such that the technologies chosen are examined for energy affordability, environmental limitations,
commercialization possibilities and potential progress with respect to the production of hydrogen.
1. Net energy consumption: Energy requirement of the element to bring it to the point of use and
energy required for operation of processes [20,24,30,31,36,39,51,54,60,68,76,82]. A value of 1 is
assigned if the element or process requires little energy and a value of 0 if it requires a great amount
of energy. For example, processes that generate energy have higher index values (primary
conversion, electricity generating and hydrogen production processes) than those that consume
energy during their operation.
2. Exergy: Relative exergy of the element or process with respect to the system and the environment
[54,62]. A value of 1 is assigned for an element with high exergy or for a process that has lower
exergy destruction and a value of 0 is assigned for an element with low exergy or for a process with
high exergy destruction. For example, combustion processes have high exergy destruction compared
to gasification processes and subsequent hydrogen production processes. Thus combustion
processes within the system are assigned lower technology index values for exergy.
3. Efficiency: Efficiency (ratio of desired output to input, considering both energy and exergy) of
every element or process and related technology in obtaining the final product of hydrogen
[68,72,73]. A value of 1 is assigned for processes that have very high efficiencies (above 0.9) and a
value of 0 is assigned for processes that have very low efficiencies (below 0.1). For example,
commercial electrolysers have between energy efficiencies ranging typically from 0.5 to 0.7 [54]; a
value of 0.7 is assigned to them, which is the highest value for efficiencies of all the items in the
system.
4. Design: Impact of design of a process or an element on sustainable operation of the system [7,1013,17,22,25,50]. A value of 1 is assigned for the best design, taken to be a design that, among other
factors, improves the overall performance of the system and minimizes waste generation. A value of
0 is assigned for the worst design of a process. No process or element in the current work is assigned
a value of 0 is given the types of processes selected for inclusion in the system design. For example,
consider USS gasification, which is still in the research phase but has significant future potential.
This process is assigned a low index value (0.3) since it is not a fully mature design and is likely
while it develops to cause problems in the overall system or with other conversion processes in it.
5. Research: Impact of research on future developments of a process or an element that affect the
ability of the system to produce hydrogen sustainably [7,10-13,17,22,25,50,54]. A value of 1 is
assigned for an element or process with high probability for successful research and a value of 0 is
assigned when there is a low probability for research and advances. For example, utilities like solids
handling and ash and slag collection have a low probability for intensive research that will help in
improving the system’s performance, so they are assigned a lower index value. For plasma
gasification and CO2-to-algae conversion processes, the amount of research, due to technology
prospects and incentives, is sufficient to merit higher index values.
6. Demonstration: Capacity for demonstration of the impact of an element or a process in contributing
to hydrogen production in the system [3,54,60,84,85,86,87,88]. A value of 1 is assigned if the
process or element is has already been demonstrated (as for commercially established technologies).
A value of 0 is assigned if there is a need in the future for demonstration to establish the capability
of the technology. For example, commercial gasification and solids handling processes have high
index values since they are more mature than the ones that are still undergoing research and
development, such as CO2-to-algae conversion processes, supercritical water processes and USS
gasification.
7. Commercialization: Potential for process or element technology to become commercially viable,
enabling sustainable large-scale operation within the system [1-5,11,13,24,34,51,54]. A value of 1 is
ISSN 2076-2895 (Print), ISSN 2076-2909 (Online) ©2011 International Energy & Environment Foundation. All rights reserved.
12
International Journal of Energy and Environment (IJEE), Volume 2, Issue 1, 2011, pp.1-38
assigned for processes or elements with excellent potential for commercialization and a value of 0 is
assigned for processes with little potential for commercialization. For example, USS gasification is
assigned a low value (0.4) since it has very limited potential for commercial development due to
size constraints (i.e., large-scale operation will result in very low efficiencies thus increasing
operating costs). Commercial gasification is assigned a high value (0.9) since it operates
commercially on a large-scale and is the fastest growing segment within the coal industry due to its
ability to produce synthetic gases for various alternative fuels programs [51].
8. Impact: Impact of actual process or element on sustainability of the system for producing hydrogen
[11,13,20,34,36,41,46,47,54,67,68]. A value of 1 is assigned to processes or elements that have very
high impact on the system’s performance and a value of 0 is assigned to those that have very low
impact. For example, within the commercial gasification process (Figure 1), the air separation unit
(ASU) is assigned a higher value (0.8) than the ash handling system (0.4) because the ASU is
crucial to a high-efficiency solid-to-gas conversion as well as effective downstream CO2 capture.
The ASU therefore has a significant impact on improving the overall efficiency of the system for
producing hydrogen, whereas the ash handling system, although essential, does not impact the
system efficiency as much as the ASU.
9. Evolution: Capacity for process technology to improve, adapt and grow in the Canadian energy
market place [4,5,7,10,13,54,63,70,83]. A value of 1 is assigned to processes that have high
opportunities for evolving to increase in efficiency and decrease in operating and maintenance costs,
while a value of 0 is assigned to processes with little opportunity for such development. For
example, commercial gasification has very little chance for evolution and is thus assigned a lower
value (0.3), whereas supercritical water gasification is assigned a high value (0.7) since it is is
expected to evolve into an efficient process for large-scale hydrogen production that is useful for
effective disposal of sewage water [46].
10. Environmental limitations: Limitations of process technology arising from harmful impact on the
environment while operating within the system [6,15-17,35,45,50,86,89]. A value of 1 is assigned to
processes with few limitations in operation due to damage caused to the environment, while a value
of 0 is assigned to the processes with high limitations in operation due to their environment impacts.
For example, devices that contribute to pollution control within the system, such as the ash collector,
syngas cleaner and membrane separator, have high index values since they are subject to few
environmental limitations in their operation and they contribute to environmental preservation.
4. Sustainability of system components
The first set of results or sustainability index values are described for different components within the
proposed system in Figure 1. The sustainability indices are plotted figures 2 to 8 on a percentage basis
for different aspects of the proposed system, as sustainability triangles with three axes: techno-, eco- and
socio-centric. The index values for elements such as each solid fuel are averaged across the 10 indicators
in each sustainability dimension. For more complex devices like conversion processes (gasification,
anaerobic digestion, etc.), the average index value of all the components within the sub-systems or
processes is evaluated first for each indicator and then averaged across the indicators within each
dimension. The maximum value for the sustainability indices in figures 2 to 8 is less than 0.8 (i.e., 80%).
The averages are evaluated as simple means. Averaging sustainability indices may not provide the exact
impact on system sustainability of indicators and system components, but it does provide a broad
understanding of the impact on the sustainability of the system.
The values for each of the specific indices are shown in Tables 1 to 3 in the appendix. Discussions within
each dimension for every indicator are based on the index values in Tables 1 to 3.
4.1 Sustainability of coals
Since coals are already an established fuel for the electricity market, its sustainability is above average.
Of the total coal supply in Canada, 77% is used for electricity generation [4] in over 60 coal combustion
power plants [1] totaling over 17 GW of electricity generation capacity. Of this capacity, 44% is located
in from Ontario, 34% in Alberta, 10% in Saskatchewan, 7% in Nova Scotia, 3% in New Brunswick, and
1% in Manitoba, based on data for the year 2004. About 8% of the coal supply is used by industries for
coking and gas manufacture. Based on Canadian coal reserves [16], the potential applications for coal are
ISSN 2076-2895 (Print), ISSN 2076-2909 (Online) ©2011 International Energy & Environment Foundation. All rights reserved.
International Journal of Energy and Environment (IJEE), Volume 2, Issue 1, 2011, pp.1-38
13
not being realized currently beyond electricity generation and limited industrial use [90], because of the
existence of natural gas and crude oil resources which have a higher market value than coal and are in
demand in external markets.
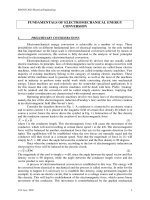
From Figure 2, it is evident that all coals have less than average ecological sustainability, with anthracite
at about 31%. This is largely due to lower environmental capacity exhibited by coals and the ecological
imbalances their use can cause. All coals have the same values for techno- and socio-centric dimensions.
Within the ecological dimension, coals score high (about 70%) in availability, material rate and
endurance and low (less than 20%) in adaptability, pollution rate and ecological balance. Industrial
residue is a mix of inorganic solid wastes from various industries that may serve as fuel in combination
with coal or biomass. Industrial residue is assigned higher index values in terms of pollution rate and
ecological balance.
Within the sociological dimension, coals are assigned high scores for per capita demand and lobbying
and low scores for public opinion and environmental obligation. Industrial residue scores the highest for
future development and the lowest for lobbying, and has an average index value of 47%.
Within the technological dimension, coals score high on exergy and technology impact do not receive
low index scores for any of the indicators, all of them being above 50%. This result demonstrates the
characteristics of industries associated with coals: power generation, steel manufacturing, and oil
companies (at least in western Canada).
ECO‐CENTRIC
80
Anthracite coal
Bituminous coal
70
Fossil
inorganic
solid fuels
60
Sub‐bituminous coal
50
Lignite or Brown coal
Industrial residue
40
30
20
10
0
TECHNO‐CENTRIC
SOCIO‐CENTRIC
Figure 2. Sustainability indices (%) for solid fossil fuels and inorganic fuels used in the system
4.2 Sustainability of biomass
Biomasses are used in co-firing and co-gasification applications in Canada. Few units converting
biomass and MSW to electricity are in operation in Canada, with less than 50 MW of electrical
generating capacity [60,67]. These plants produce less than 5% of the total electrical energy used in the
province of Ontario. This low utilization is due in part to a lack of higher conversion potential with
biomass fuel, because only one energy conversion technology is used at a given time within the facilities
operating in Canada.
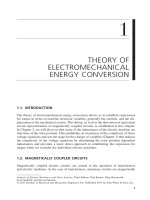
Figure 3 shows the averaged sustainability triangle for all the biomasses and system solid wastes (solid
wastes that are generated after primary and secondary conversion processes within the system). Biomass
ISSN 2076-2895 (Print), ISSN 2076-2909 (Online) ©2011 International Energy & Environment Foundation. All rights reserved.
14
International Journal of Energy and Environment (IJEE), Volume 2, Issue 1, 2011, pp.1-38
from farms are assigned a higher index value (10% higher) than biomass from forests, due to a higher
average score in techno-centric dimensions. This result is mainly due to the nature of the feedstock,
which is drier and bulkier than forest biomass, thereby enabling higher values for evolution, commercial
and net energy consumption indicators.
ECO‐CENTRIC
80
Biomass, Forest
70
Biomass, Farm
60
Energy Crops
50
MSW, Sewage
40
MSW, Garbage
30
System solid wastes
Renewable
solid
fuels
20
10
0
TECHNO‐CENTRIC
SOCIO‐CENTRIC
Figure 3. Sustainability indices (%) for renewable solid fuels used in the system
Within the ecological dimension, farm biomass, energy crops and MSW-garbage have the same average
index values. MSW-sewage has a lower value due to low index (10%) for adaptability, pollution rate and
ecological balance. System solid wastes have very low indices for all dimensions since they have the
lowest energy rate, economics and exergy.
Within the sociological dimension, MSW-garbage has a 10% lower value than biomasses, since
biomasses have high values (over 70%) for economics, public opinion and lobbying. The characteristics
of system solid wastes cause them to receive very low values for all indicators in this dimension. By
recycling these system wastes, the sustainability of waste management can be improved. In future waste
handling regulations will likely become more stringent, making it worthwhile to improve sustainability
now.
Within the technological dimension, most of the biomasses are similar and are assigned the highest
values of all the three dimensions. This is due to the above-average values scored by biomasses, energy
crops and MSW-garbage. Energy crops are assigned the highest value (90%) for environmental
limitations in the use of technology relating to its processing.
The overall sustainability score of biomasses can be expected to increase once a market and demand are
established.
4.3 Sustainability of fuel handling processes
Solid fuels arriving at the system require temporary storage, drying, crushing/milling and internal
transport mechanisms. The handling of solid fuels consumes some energy with operation and
maintenance costs and is vital to the functioning of a system using solid fuels. Due to the availability and
widespread use of solid fuels [91], their handling is mature. Upstream processes (in Figure 1) involve
cleaning, blending and upgrading of solid fuels to enhance the quality of the feedstock, thus improving
ISSN 2076-2895 (Print), ISSN 2076-2909 (Online) ©2011 International Energy & Environment Foundation. All rights reserved.
International Journal of Energy and Environment (IJEE), Volume 2, Issue 1, 2011, pp.1-38
15
the efficiency of various downstream conversion processes [1] and also simplifying the separation of
associated pollutants [2].
In Figure 4 the sustainability index for the three dimensions are shown for the five different fuel
handling processes. Except for storage, all processes are assigned values close to 70% for ecological
sustainability. The drying process has the highest of technological sustainability index (60%) since
drying of solid fuels is essential for most conversion processes. Some exceptions are supercritical water
gasification and anaerobic digestion.
ECO‐CENTRIC
80
Storage
70
Drying
60
Crushing/Grinding
50
In‐system transporting
40
Mixing of fuels, carrier gas
Fuel
handling
processes
30
20
10
0
TECHNO‐CENTRIC
SOCIO‐CENTRIC
Figure 4. Sustainability indices (%) for fuel-handling services within the system
Since fuel handling processes are essential to the effective operation of any energy system that use solid
fuels [24], it is likely more advantageous to improve the performance of drying and storage aspects of
fuel handling since one affects the other. These two processes affect the crushing and grinding operations
which in turn affect the in-system material transport on conveyor belts or in pipes.
4.4 Sustainability of gasification processes
Five different gasification processes are included in the proposed system in Figure 1. Of these,
commercial gasification and plasma gasification have capabilities for large-scale production of synthetic
gas. Of the total hydrogen production from the system in Figure 1, up to 60% is expected to be produced
from syngas obtained using the five different gasification processes.
Large-scale commercial gasification is becoming established in the US as a means of producing syngas
for various uses, the most common of which are power generation [92] and the production of substitute
natural gas (SNG). Four commercial gasification technologies capable of producing syngas from five
different feedstocks are identified in the commercial gasifier database [93]. The gasification technologies
of Shell, Sasol Lurgi, GE Energy and others have been compared and their details have been analyzed by
the US National Energy Technology Laboratory [27]. The commercial capacity of the Shell process has
increased recently (from 21% of the gasifier market in 1999 to 28% in 2007) while that for the GE
Energy process has decreased (from 39% in 1999 to 31% in 2007).
Sustainability index values in three dimensions are shown in Figure 5 for the five different gasification
processes. Except for the ecology value, supercritical water gasification has higher values than other
ISSN 2076-2895 (Print), ISSN 2076-2909 (Online) ©2011 International Energy & Environment Foundation. All rights reserved.
16
International Journal of Energy and Environment (IJEE), Volume 2, Issue 1, 2011, pp.1-38
gasification processes in the technology dimension, due to its advantages regarding exergy,
commercialization, impact and environmental limitations.
ECO‐CENTRIC
80
COMMERCIAL
GASIFICATION
PLASMA GASIFICATION
70
Gasification
processes
60
50
ULTRA SUPERHEATED
STEAM GASIFICATION
SUPER CRITICAL WATER
GASIFICATION
SOLAR THERMAL
GASIFICATION
40
30
20
10
0
TECHNO‐CENTRIC
SOCIO‐CENTRIC
Figure 5. Sustainability indices (%) for selected gasification processes within the system
Commercial gasification, although capable of producing large quantities of hydrogen, has a lower
sustainability ranking than some of the newer gasification processes, mainly due to its low index values
for the ash handling system and the syngas cooler within the technology indicators. Commercial
gasification is assigned a high value (0.6), equal to that of solar thermal gasification, for the ecological
dimension., Since Canada does not yet have any solid fuel-based commercial gasification facilities, the
index values are based on data from the US market, to which an eventual Canadian market may be
similar. Nonetheless, there is however a pilot-scale high-pressure (up to 20 bars) demonstration unit at
the CANMET Energy Technology Centre in Ottawa [1]. Also, a petroleum-based 1025-MW capacity
gasification plant is under construction at Long Lake, Alberta using the Shell gasification technology
[93], and a gasification plant with a 40,000 barrel per day capacity is being developed at the pre-feed
stage for commissioning by 2014 at Fox Creek, Alberta by Alter NRG [94].
Considering only the index values of gasifiers in each of the five subsystems, the commercial large-scale
gasifier scores the highest (above 0.6, as seen in Tables 1 and 2) in eco- and socio-centric dimensions
while the plasma gasifier scores high in techno-centric sustainability, owing to its rapid developments
and commercialization potential. Ottawa City Council issued a letter of intent in 2008 to PlascoGroup to
build, own and operate a 400 tonne-per-day waste conversion facility using plasma gasification
technology [84]. Similar facilities by the PlascoGroup are planned in Vancouver, British Columbia and
Red Deer, Alberta [84]. Plasma gasification technology was developed by Westinghouse Plasma
Corporation, which is now wholly owned by the Canadian company Alter NRG. An increase in
commercial potential for plasma technology in the near future is suggested by recent reviews of general
plasma technology providers [78] and the Alter NRG/Westinghouse technology [95], particularly for
converting municipal solid wastes in large cities across developed countries to useful syngas while
applying CCS.
ISSN 2076-2895 (Print), ISSN 2076-2909 (Online) ©2011 International Energy & Environment Foundation. All rights reserved.
International Journal of Energy and Environment (IJEE), Volume 2, Issue 1, 2011, pp.1-38
17
4.5 Sustainability of primary conversion processes
There are four primary energy conversion processes within the proposed system in Figure 1: gasification,
direct chemical looping, anaerobic digestion and pressurized fluidized bed combustion. Sustainability
measures for these are compared in Figure 6. Some of these processes are already used at commercial
scales in Canada for various products, while other technologies in the proposed system have not yet
achieved commercial viability, including chemical looping combustion (both syngas based and direct),
ultra-superheated steam gasification, solar gasification and ultra-super-critical water gasification. These
latter processes are still in the research phase of development, and in many instances may become
commercial, although the timing depends on their potential advantages and corresponding demands [23]
as well as other factors.
ECO‐CENTRIC
80
COMMERCIAL
GASIFICATION
DIRECT CHEMICAL LOOPING
70
Primary
conversion
processes
60
50
ANAEROBIC DIGESTION
PRESSURIZED FLUIDIZED
BED COMBUSTION
40
30
20
10
0
TECHNO‐CENTRIC
SOCIO‐CENTRIC
Figure 6. Sustainability indices (%) for selected primary energy conversion processes within the system
In Figure 6, anaerobic digestion exhibits good sustainability in all three dimensions considered compared
to other conversion processes. Anaerobic digestion is part of an established co-production industry in
Europe with over 3400 plants (both on- and off-farm) across 10 countries with a total electrical
generation capacity of 700 MW [85]. The AgSTAR Digest in 2006 listed 82 operating digesters in the
US [96], and 19 in start-up or construction stages. Only approximately 1% of the on-farm anaerobic
digestion market has been developed, leaving a substantial untapped resource for generating electricity
and a potential business opportunity for increasing farm income [96].
In Canada, and Eastern Ontario in particular, the economics of using agricultural residue and energy
crops in anaerobic digestion are not viable at present [47]. A report for the province of Ontario [87]
concluded that on-farm anaerobic digestion systems smaller than 300 kilowatts (applicable to farms with
greater than approximately 3800 dairy cattle or 970,000 poultry) are not financially feasible with
electricity prices below CAD 0.14 per kWh or without off-farm inputs. Incorporating off-farm organic
material at a rate of 25% of on-farm organic material, improved the financial feasibility by increasing
biogas production and offering the potential for tipping fee revenue [87]. Ontario Power Generation
offers financial incentives to farmers who generate electricity from biogas, paying them about CAD 0.12
per kWh. However, this rate is subsidized, as it is higher than the market value of electricity, which
varies in Ontario between 6 to 8 cents per kilowatt hour.
ISSN 2076-2895 (Print), ISSN 2076-2909 (Online) ©2011 International Energy & Environment Foundation. All rights reserved.
18
International Journal of Energy and Environment (IJEE), Volume 2, Issue 1, 2011, pp.1-38
Compared to other primary conversion processes, direct chemical looping exhibits poor sustainability in
the socio-centric dimension, since it has low index values for policy, human resources, environmental
obligation and per capita demand. These scores are low due to direct chemical looping being in its
infancy in the energy conversion industry [42]. This process is widely used in steel manufacturing but
not in the hydrogen production sector. Technical advances are required to improve the social aspects of
sustainability of direct chemical looping.
A combustion-to-electricity-to-hydrogen route may contribute up to 10% of the total hydrogen produced
by the system in Figure 1. Although fluidized bed combustion is commercially established globally, the
particular process intended for use in the proposed system is the advanced pressurized fluidized bed
combustion process developed by the US Department of Energy and industry partners [97]. This
particular process is still under development, but is entering the demonstration stage.
4.6 Sustainability of secondary conversion processes
Secondary conversion processes separate hydrogen from other gaseous elements, and the sustainability
indexes for five such processes are compared in Figure 7. Water-gas shift (WGS) reactions use catalysts
that have been commercially developed for use by the petrochemical industry [98,99]. Presently, there is
renewed interest in the water-gas shift reaction because of its importance in reforming hydrocarbon fuels
to hydrogen [25]. The WGS process is mostly used with gasification processes, and thus is part of that
industry in Canada. It is observed in Figure 7 that the WGS reactor exhibits lower sustainability on
socio- and techno-centric dimensions, since the WGS reaction is endothermic, and has low exergy and
high net energy consumption.
ECO‐CENTRIC
80
WATER‐GAS SHIFT
REACTOR
MEMBRANE
SEPARATION
70
Secondary
conversion
processes
60
50
SYNGAS CHEMICAL
LOOPING
ELECTROLYSER
AUTO‐THERMAL
REFORMER
40
30
20
10
0
TECHNO‐CENTRIC
SOCIO‐CENTRIC
Figure 7. Sustainability indices (%) for selected secondary energy conversion processes within the
system
Gas separation using membranes of various kinds, primarily differentiated by the membrane material, is
a rapidly evolving field [100]. The most common commercial materials for membranes include metallic,
ceramic and polymeric substances and, recently, carbon-based nanotubes or pores in compact grid
arrangements [101]. From the comparison in Figure 7, it is evident that membrane separation has an
ISSN 2076-2895 (Print), ISSN 2076-2909 (Online) ©2011 International Energy & Environment Foundation. All rights reserved.
International Journal of Energy and Environment (IJEE), Volume 2, Issue 1, 2011, pp.1-38
19
increasing commercial potential and impact, is evolving rapidly and has low environmental limitations,
leading to its high index values (above 0.8) for these indicators within the techno-centric dimension.
In syngas chemical looping (SCL), the syngas produced from the gasifier, containing mostly CO, H2,
CO2 and CH4 [102], reduces a metal oxide (such as Fe2O3) to the constituent metal (Fe and FeO). In
Figure 7, syngas chemical looping is seen to have lower sustainability in all three dimensions (less than
0.6) due to its low values for certain indicators. Within the ecological dimension, this process has low
values (less than 0.3) for availability, adaptability and location (in Tables 1 to 3) due to its noncommercial state. But is also has possibilities to improve its sustainability index with market driven
research. Within the socio-centric dimension, SCL is assigned a low value for human resources, again
due to its non-commercial aspect of this process; this index value is likely to increase with
commercialization to a value higher than 0.6. Recently, Alstom Corporation [103] concluded that
chemical looping combustion is the lowest cost option for CO2 capture when using coal for energy.
Commercialization of this technology for CO2 capture is being pursued rapidly by the US Department of
Energy [103].
Electrolyser research and development in Canada and elsewhere is advancing somewhat in parallel with
fuel cell research and development, as some aspects of functionality can be interchanged [64,76]. It is
observed in Figure 7 that the electrolyser outperforms all other secondary conversion processes in
producing hydrogen, from socio- and techno-centric dimensions. This is because of its high efficiency
and related benefits, and the amount of academic and industrial research currently underway to improve
electrolyser performance and reduce manufacturing costs. The assigned index value for economics for
electrolysers in Table 2b is high (0.9), based on a comparison of the hydrogen price from hightemperature electrolysis process with other hydrogen production methods in operation or being
developed.
Auto-thermal reforming (ATR) uses oxygen and carbon dioxide or steam in a reaction with methane to
form syngas [104]. The reaction takes place in a single chamber where the methane is partially oxidized.
The reaction is exothermic (releases thermal energy) due to the oxidation process. The ATR process is
widely used in natural gas plants and oil refineries in western Canada [62]. The lower index values in
Figure 7 for this process are mainly due to its average performance for all the sustainability indicators,
resulting from limited markets and future prospects.
4.7 Sustainability of CO2 sequestration
The International Energy Agency [54] recently compared energy resource types, conversion technologies
and associated policies based on two scenarios (see Figure 5): (1) the ACT Map scenario of the IEA,
which implies adoption of a wide range of technologies with marginal costs of up to USD 50 per tonne of
CO2 saved when fully commercialized, and (2) the BLUE Map scenario, which requires deployment of
all technologies involving costs of up to USD 200 per tonne of CO2 saved when fully commercialized.
These scenarios are compared to reductions in CO2 levels for a baseline scenario which accounts for CO2
emissions reaching 62 gigatonnes (Gt) of CO2 in 2050; this emission level represents a 130% increase
from 2005 levels and is considered unsustainable [54]. The baseline scenario reflects developments
likely to occur with energy and climate policies implemented to date. While the ACT scenarios are
demanding, the BLUE scenarios depend on urgent implementation of unprecedented and far-reaching
new policies in the energy sector [54], which will take more time and effort to implement than the ACT
scenarios. The discussions in section 2 on CO2 capture and separation suggest means of dealing with this
CO2.
Four options for sequestering the CO2 are discussed in this work, and their sustainability is shown in
Figure 8. Storing CO2 underground is the current short-term solution preferred by several countries
including Canada and the USA, who have jointly undertaken one of the largest CO2 disposal operations
in Winnipeg, Canada [55]. Although has been carried out at a commercial scale, this initiative appears
not to have been comprehensively planned and balanced with respect to all relevant parameters in terms
of eco- and techno-centric sustainability dimensions. Two main issues reduce the sustainability of this
process: (i) compressing CO2 beyond 130 bars, which is necessary to transport hydrogen as a liquid in
pipelines across great distances, is expensive financially and challenging ecologically, and (ii) the
volume of CO2 compressed from all CO2 emitting utilities is much higher than the volume of
underground geological space available, that is capable of storing gases like CO2 without impacting
ecological balances [6].
ISSN 2076-2895 (Print), ISSN 2076-2909 (Online) ©2011 International Energy & Environment Foundation. All rights reserved.
20
International Journal of Energy and Environment (IJEE), Volume 2, Issue 1, 2011, pp.1-38
ECO‐CENTRIC
80
STORAGE GEOLOGICS
70
CO2 TO MINERALS
60
CO2 TO ALGAE
50
CO2 TO PLANTS
CO2
storage,
sequestration
40
30
20
10
0
TECHNO‐CENTRIC
SOCIO‐CENTRIC
Figure 8. Sustainability indices (%) for CO2 storage options as part of the CCS operation associated with
the proposed system
Similarly, CO2 conversion to minerals like calcium or magnesium carbonates, although easier to handle
than gaseous CO2, has an output volume that is several times the input volume, making it the least
sustainable option for CO2 sequestration. These challenges are reflected in the assigned corresponding
indicator values across the three dimensions.
CO2 conversion to algae, although in the initial stages of commercial development, has greater potential
to become a sustainable option for converting CO2 to biodiesel. The process utilizes an appropriate algae,
and requires light and water [59]. This process is more efficient and faster than CO2 conversion to plants
through artificial photosynthesis in large greenhouses, allowing it to be assigned relatively high values
for techno- and socio-centric sustainability indices.
Having carbon capture and sequestration options as part of the system provides better overall system
sustainability, even though the system incorporates coal as one fuel source. This system is likely most
advantageous during the transition phase from a hydrocarbon to hydrogen economy.
5. Sustainability of the proposed system
The discussion in the previous section is based on average values of indices across subsystems and
indicators. In this section, average values of the six categories of processes mentioned in section 1 across
10 indicators in each of the sustainability dimensions are discussed, in order to develop some inferences
regarding the sustainability of the proposed system.
First, however, a simple background on the system’s prospects is provided. When the demand for
hydrogen energy becomes large in Canada, systems like the one proposed in this work will likely be
implemented, that are able to deliver large volumes of hydrogen from a centralized location. The demand
for hydrogen also depends on the existence of the infrastructure required to deliver and store the
hydrogen. Research is ongoing in Canada [10], the US [3,50] and elsewhere on finding improved forms
and ways to store and deliver hydrogen, especially over great distances and varied landscapes. The
participation of fossil fuel companies could assist efforts at developing a transportation network from
production facilities to distribution centers, by utilizing their expertise in large oil/gas pipeline networks.
ISSN 2076-2895 (Print), ISSN 2076-2909 (Online) ©2011 International Energy & Environment Foundation. All rights reserved.
International Journal of Energy and Environment (IJEE), Volume 2, Issue 1, 2011, pp.1-38
21
5.1 Ecological sustainability of six categories of elements and processes
The ecological index values for 10 indicators are compared for six categories in Figure 9, where the
system average for each indicator is also provided. Solid fuels exhibit low values for most of the
indicators, relative to other categories and the system average, except in availability and material rate.
Solid fuels have the lowest index (0.12) for ecological balance due to the use of coals, which are nonrenewable energy sources. On-site fuel handling processes have higher values than other categories and
the system average due to their utilitarian nature. Any system involving solid fuels requires fuel handling
to operate.
0.9
SOLID FUELS
PRIMARY CONVERSION
SECONDARY PROCESSES
CCS
0.8
On‐Site FUEL HANDLING
FUTURE EXTENSIONS
System Average
0.7
ECO‐CENTRIC INDEX
0.6
0.5
0.4
0.3
0.2
0.1
Endurance
Ecological
balance
Location
Pollution rate
Energy rate
Material rate
Timeline
Environmental
capacity
Adaptability
Availability
0
Figure 9. Comparison of eco-centric sustainability indices for the six major elements within the system,
based on values for the 10 indicators discussed in section 3.1
One benefit of the integration inherent in Figure 1 is the mix of various conversion processes capable of
using all type of solid fuels available in the market, thus permitting the system to operate even when
some of the feedstocks shown in Figure 1 are not available on a continuous basis. For example,
agricultural and forest biomass are seasonal and so may not be available throughout the year. Such
supply intermittency is also observed with other renewable energy resources.
Coal is the primary solid fuel in Canada [62], and significant utilization technologies exist for it. Thus
blending coal with biomass, MSW and other organic wastes allows coal supplies to be extended while
improving environmental performance and facilitating effective disposal of solid wastes. The system in
Figure 1 offers the flexibility to vary fuel input depending on the short- and long-term availability of
various fuels at different locations.
The primary conversion processes (PCPs) in Figure 9 have an almost average performance for all the
indicators. The highest value is assigned for material rate (0.61) mainly due to the gasification process,
which is capable of producing almost 60% of the total hydrogen and thus involves a large-scale material
rate. Adaptability scores the lowest average value (0.47) since much of the primary conversion processes
are yet to adapt to the market on a large-scale and involve a large number of processes for use in the
system.
ISSN 2076-2895 (Print), ISSN 2076-2909 (Online) ©2011 International Energy & Environment Foundation. All rights reserved.
International Journal of Energy and Environment (IJEE), Volume 2, Issue 1, 2011, pp.1-38
22
The secondary conversion processes (SCPs) have index values below the system average for at lease five
indicators: availability, adaptability, material rate, energy rate and location. This observation is linked to
the lack of maturity of the technologies related to these processes and a consequent low market
availability. These processes outperform other categories in timeline, suggesting a high chance for
sustainability based on growth in the technology (as discussed in section 5.3) and in pollution rate, since
harmful substances are separated by these processes. These processes are similar to on-site fuel handling
in that they are required by the system to separate and purify hydrogen. All five processes are necessary
for large-scale hydrogen separation since each caters to the needs of a particular primary conversion
process.
Except for energy rate, the CCS options chosen for this system perform above the system average in
ecological sustainability. CCS processes consume energy to perform the carbon capturing and
sequestration operations. Future extensions regarding upstream fuel processing and solid waste
management exhibit higher sustainability as well. Such extensions are likely to help in pollution control
for emissions other than CO2, thus leading to better ecological sustainability with time as these advanced
fuel handling processes (cartridge system, upgrading, blending, solvent treatment, etc.) become more
widely adopted.
Based on system average values, ecological performance is likely to improve in 1) adaptability by
improving commercialization, 2) environmental capacity by adapting more stringent measures, and 3)
energy rate by reducing energy wastes in operating the system.
0.9
0.8
0.7
SOLID FUELS
On‐Site FUEL HANDLING
PRIMARY CONVERSION
SECONDARY PROCESSES
CCS
FUTURE EXTENSIONS
System Average
SOCIO‐CENTRIC INDEX
0.6
0.5
0.4
0.3
0.2
0.1
Lobbying
Per capita
demand
Future
development
Human
convenience
Living
standards
Environmental
obligation
Public opinion
Human
resource
Policy
Economics
0
Figure 10. Comparison of socio-centric sustainability indices for the six major elements within the
system, based on values for the 10 indicators discussed in section 3.2
5.2 Sociological sustainability of six categories of elements and processes
The sociological index values for 10 indicators are presented for six categories in Figure 10, along with
the system average for each indicator. Solid fuels perform better in the sociological rather than ecological
dimension, scoring highest (0.62) for future development. This is due to the expected growth in demand
for hydrogen, which may enable large-scale use of biomass and some coals. Solid fuels exhibit a
ISSN 2076-2895 (Print), ISSN 2076-2909 (Online) ©2011 International Energy & Environment Foundation. All rights reserved.
International Journal of Energy and Environment (IJEE), Volume 2, Issue 1, 2011, pp.1-38
23
significant difference in the human convenience indicator value compared with other categories,
suggesting that any additional use of solid fuels to support human convenience results in increased
demand for solid fuels but an additional load on all other components in the system.
On-site fuel handling again is assigned high index values (above 0.6) for five of the sociological
indicators. It scores low for human resources, since much of the operation is performed automatically.
The average value of 0.42 for human resources indicates the human effort involved in designing and
maintaining the automated machines. The ranking assigned for human resources may be higher during
manufacturing, installation and maintenance for the on-site fuel handling system.
Except for the human resources and human convenience indicators, primary conversion processes are
assigned a high value (about 0.6) for all other social indicators. These values will likely increase in time
due to improved policies that provide a stable market in Canada for gasification processes and other
renewable energy conversion processes such as anaerobic digestion.
The index value for human convenience will likely improve for all categories except solid fuels when
broader regulations are sought by local and provincial governments for reducing waste and improving
the efficiencies of electric utilities and hydrogen-based appliances in Canada [54,83].
Linkages among academia, government and industry help build the necessary human resources and skills
for establishing a hydrogen economy. Activities in Canada in this regard are described in the capability
report on the hydrogen and fuel cells industry in Canada for 2008 [76], which lists associated
government organizations, research institutes, industries and universities involved in RD&D related to
elements of the hydrogen economy. The capability report notes various collaborative hydrogen projects
involving Canadian institutions and industries, some of which are discussed in the next section.
Secondary conversion processes have a high value (0.8) for the developments indicator, since most of the
processes are still undergoing extensive research, increasing the probability of future developments that
make the processes more sustainable.
The biggest hurdle in CCS currently [54] is the cost of capturing and sequestering CO2. This is reflected
in the economics indicator in Figure 10 for CCS which is 20% less than the system average.
Improvements via RD&D and growing commercial investments in CCS suggest that improved economic
performance in the near future is possible.
Future extension processes score high values (above 0.7) for public opinion and environmental
obligation indicators. This suggests the importance of clean processes that also achieve good operational
performance. On policy, as mentioned earlier, upstream cleaning processes are required by law in Japan
but not in Canada, causing a lower index value to be observed for this indicator.
Based on system average values, the sociological performance of the system, although better than its
ecological performance, requires improvements that are mostly outside the confines of the proposed
system, but affect it in more than one way. In time, such improvements can be anticipated to increase the
social sustainability of the system.
5.3 Technological sustainability of six categories of elements and processes
The technological index values for 10 indicators are compared for six categories as shown in Figure 11,
where the system average is also provided for each indicator. Solid fuels have above system-average
performance with respect to all technological indicators. These indicator values confirm the well
established engineering capabilities and experience regarding solid fuels. These indicator values in turn
help in improving eco- and socio-centric sustainability of solid fuels when the system is fully
operational. The higher value for evolution indicates that new processes and equipment designs in the
near future will almost certainly enable improved efficiencies in converting solid fuels to hydrogen.
The exergy of on-site fuel handling is the lowest value for all the indicators, suggesting that these
processes do not have the capacity to transfer useful energy compared to other processes in the system.
Based on the research indicator, it is evident that the incentives for research on fuel handling processes
are minimal. This need should perhaps be addressed via future extension processes and research.
ISSN 2076-2895 (Print), ISSN 2076-2909 (Online) ©2011 International Energy & Environment Foundation. All rights reserved.
International Journal of Energy and Environment (IJEE), Volume 2, Issue 1, 2011, pp.1-38
24
0.9
0.8
0.7
SOLID FUELS
On‐Site FUEL HANDLING
PRIMARY CONVERSION
SECONDARY PROCESSES
CCS
FUTURE EXTENSIONS
System Average
TECHNO‐CENTRIC INDEX
0.6
0.5
0.4
0.3
0.2
0.1
Environmental
limitations
Evolution
Impact
Commercializat
ion
Demonstration
Research
Design
Efficiency
Exergy
Energy
consumption
0
Figure 11. Comparison of techno-centric sustainability indices for the six major elements within the
system, based on values for the 10 indicators discussed in section 3.3
Research on and commercialization of primary energy conversion processes are expected to improve
their techno-centric sustainability. For example, biomass gasification and anaerobic digestion have good
potential for electricity and hydrogen production for various reasons. These technologies have
opportunities to attract investments in the near future to support their development to commercial levels,
facilitated in part through various Canadian government programs [63], e.g. the Program of Energy
Research and Development (PERD). Other federal government programs also fund energy-based projects
including the Industry Research Assistance Program (IRAP) of the National Research Council, the
Technology Partnerships Program (TPC) of Industry Canada and various grant programs of the Natural
Sciences and Engineering Research Council (NSERC).
Secondary conversion processes (SCP) have high values (above 0.7) for research, commercialization and
impact. There are more incentives for research and commercialization based on the distribution of energy
R&D funding by the Canadian government. Presently, 20% is spent on fossil fuel-based technologies
(PCP, SCP), 13% on renewable energy technologies, 22% on conservation technologies (SCP), 20% on
nuclear fission/fusion, 7% on power/storage technologies and 19% on cross-cutting and other topics
(SCP). Based on our previous analyses of three subsystems (gasification, combustion and chemical
looping combustion) used within the proposed system in Figure 1, the financial benefit from the total
R&D expenditure distribution by the Canadian government for the year 2004 [63] for the proposed
system is close to 15% (3% for gasification, 2% for combustion, 4% for CCS, 3% for conservation
efforts and 3% for cross-cutting R&D involving syngas and direct chemical looping development).
The technological performance of CCS processes is still lower than the system average for most of the
indicators, because CO2 capture technologies are not yet commercially implemented in Canada on a
large-scale, although research is ongoing. Experiences elsewhere are accelerating CCS developments.
For instance, a power plant incorporating a complete CO2 capture and sequestration facility has been
commissioned in Germany [105]. Conversion of CO2 to algae is considered by many as a viable and
sustainable process for CO2 storage, but large-scale operations are yet to be commissioned in the world.
ISSN 2076-2895 (Print), ISSN 2076-2909 (Online) ©2011 International Energy & Environment Foundation. All rights reserved.
International Journal of Energy and Environment (IJEE), Volume 2, Issue 1, 2011, pp.1-38
25
Future extensions have below system-average performance except for net energy consumption and
environmental limitations. This is again due to the lack of such processes in the Canadian solid fuels
industry.
Based on system average values, the technological performance of the system requires significant
improvements to enhance its sustainability. Efficiency improvements, in particular, are essential for all
components in the system. Older process designs need to be upgraded to address the challenges in
ecological and sociological dimensions.
6. Conclusions
A conceptual layout of an energy conversion system has been developed for large-scale hydrogen
production in Canada using solid fuels by integrating various technologies. For each of the components
of the system, a qualitative analysis for the Canadian energy market of the sustainability of the system
has been performed, considering three dimensions (ecological, sociological and technological) and 10
indicators for each dimension. Values for each of these indicators are generated using a 10-point scale
based on a high of 1 and a low of 0, depending on the characteristic of the criteria associated with each
element or process, utilizing data reported in the literature. The following inferences are derived from the
current work:
• Qualitative sustainability indicators can be reasonably defined based on evaluations of system
feasibility [23]. Adequate flexibility and comprehensiveness is provided through the use of 10
indicators for each of three dimensions (ecology, sociology, technology) for every process or
element involved in the proposed system.
• The assessment values of indices for solid fuels suggest that it is advantageous to use coals in
combination with biomass to increase their ecological and social sustainability.
• The assessments of the individual processes indicate that their sustainability is not high,
indicating opportunities to improve component selection in the proposed system and to take
advantage of improvements as technologies mature.
• The comparison of the indicators within each sustainability dimension for the six categories
highlights the reasons for lower sustainability of certain components, and identifies processes
requiring attention to improve sustainability (e.g., fuel handling and CCS).
• Biomasses have better sustainability than coals.
• Newer secondary conversion processes are essential for primary conversion of solid fuels to be
sustainable, especially when using coals.
• Newly developed options for CO2 commercial and alternate use and sequestration are likely to
increase the sustainability of this technology.
• The average values for the three primary sustainability dimensions obtained through the present
analysis of the proposed system are 45% for ecological sustainability, 55% for sociological
sustainability and 60% for technological sustainability.
Based on this preliminary assessment, the proposed system appears moderately sustainable in a Canadian
energy market for large-scale hydrogen production, but achievement of this level of sustainability, or a
higher level, requires technological improvements of some of the processes, which in turn will lead to
ecological and sociological enhancements.
Acknowledgements
The authors kindly acknowledge the financial support provided by the Natural Sciences and Engineering
Research Council of Canada.
References
[1] CanmetENERGY. Canada’s Clean Coal Technology Roadmap. Report, CANMET Energy
Technology Center, Natural Resources Canada, 2005. Available at www.nrc-cnrc.gc.ca.
[2] NEDO. Clean Coal Technologies in Japan: Technological Innovation in the Coal Industry.
Technical report, New Energy and Industrial Technology Development Organization (NEDO),
Japan, 2004. Available at www.nedo.go.jp/english/.
[3] DOE. Hydrogen from Coal Program: Research, Development and Demonstration Plan for the
Period 2008 through 2016. External report, US Department of Energy, September 2008. Available
at />
ISSN 2076-2895 (Print), ISSN 2076-2909 (Online) ©2011 International Energy & Environment Foundation. All rights reserved.