Modeling optimizes PEM fuel cell durability using threedimensional multi-phase computational fluid dynamics model
Bạn đang xem bản rút gọn của tài liệu. Xem và tải ngay bản đầy đủ của tài liệu tại đây (1.04 MB, 24 trang )
INTERNATIONAL JOURNAL OF
ENERGY AND ENVIRONMENT
Volume 1, Issue 3, 2010 pp.375-398
Journal homepage: www.IJEE.IEEFoundation.org
Modeling optimizes PEM fuel cell durability using threedimensional multi-phase computational fluid dynamics
model
Maher A.R. Sadiq Al-Baghdadi
Fuel Cell Research Center, International Energy & Environment Foundation, Al-Najaf, P.O.Box 39, Iraq.
Abstract
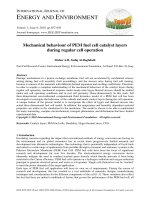
Damage mechanisms in a proton exchange membrane (PEM) fuel cell are accelerated by mechanical
stresses arising during fuel cell assembly (bolt assembling), and the stresses arise during fuel cell
running, because it consists of the materials with different thermal expansion and swelling coefficients.
Therefore, in order to acquire a complete understanding of the damage mechanisms in the membrane and
gas diffusion layers, mechanical response under steady-state hygro-thermal stresses should be studied
under real cell operating conditions and in real cell geometry (three-dimensional).
In this work, full three-dimensional, non-isothermal computational fluid dynamics model of a PEM fuel
cell has been developed to simulate the hygro and thermal stresses in PEM fuel cell, which are occurring
during the cell operation due to the changes of temperature and relative humidity. A unique feature of the
present model is to incorporate the effect of hygro and thermal stresses into actual three-dimensional fuel
cell model. The mechanical behaviour of the membrane, catalyst layers, and gas diffusion layers during
the operation of a unit cell has been studied and investigated. The model is shown to be able to
understand the many interacting, complex electrochemical, transport phenomena, and stresses
distribution that have limited experimental data. The results show that the non-uniform distribution of
stresses, caused by the temperature gradient in the cell, induces localized bending stresses, which can
contribute to delaminating between the membrane and the gas diffusion layers. These results may explain
the occurrence of cracks and pinholes in the membrane during regular cell operation. This model is used
to study the effect of operating, design, and material parameters on fuel cell hygro-thermal stresses in
polymer membrane, catalyst layers, and gas diffusion layers. Detailed analyses of the fuel cell durability
under various operating conditions have been conducted and examined. The analysis helped identifying
critical parameters and shed insight into the physical mechanisms leading to a fuel cell durability under
various operating conditions.
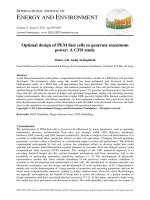
Optimization study of a PEM fuel cell durability has been performed. To achieve long cell life, the
results show that the cell must be operate at lower cell operating temperature, higher cell operating
pressure, higher stoichiometric flow ratio, and must have higher GDL porosity, higher GDL thermal
conductivity, higher membrane thermal conductivity, narrower gases channels, thicker gas diffusion
layers, and thinner membrane. In these optimum conditions, the maximum deformation (displacement)
reduction by about 50% than the base case operating conditions.
Copyright © 2010 International Energy and Environment Foundation - All rights reserved.
Keywords: PEM, Durability, Hygro-thermal stress, CFD, Modelling.
ISSN 2076-2895 (Print), ISSN 2076-2909 (Online) ©2010 International Energy & Environment Foundation. All rights reserved.
376
International Journal of Energy and Environment (IJEE), Volume 1, Issue 3, 2010, pp.375-398
1. Introduction
Durability is one of the most critical remaining issues impeding successful commercialization of broad
PEM fuel cell stationary and transportation energy applications, and the durability of fuel cell stack
components remains, in most cases, insufficiently understood. Lengthy required testing times, lack of
understanding of most degradation mechanisms, and the difficulty of performing in-situ, non-destructive
structural evaluation of key components makes the topic a difficult one [1, 2].
The Membrane-Electrode-Assembly (MEA) is the core component of PEM fuel cell and consists of
membrane with the gas-diffusion layers including the catalyst attached to each side. The fuel cell MEA
durability plays a vital role in the overall lifetime achieved by a stack in field applications. Within the
MEA’s electrocatalyst layers are three critical interfaces that must remain properly intermingled for
optimum MEA performance: platinum/carbon interface (for electron transport and catalyst support);
platinum/Nafion interface (for proton transport); and Nafion/carbon interface (for high-activity catalyst
dispersion and structural integrity). The MEA performance shows degradation over operating time,
which is dependent upon materials, fabrication and operating conditions [3, 4].
Durability is a complicated phenomenon; linked to the chemical and mechanical interactions of the fuel
cell components, i.e. electro-catalysts, membranes, gas diffusion layers, and bipolar plates, under severe
environmental conditions, such as elevated temperature and low humidity [5]. In fuel cell systems,
failure may occur in several ways such as chemical degradation of the ionomer membrane or mechanical
failure in the PEM that results in gradual reduction of ionic conductivity, increase in the total cell
resistance, and the reduction of voltage and loss of output power [6]. Mechanical degradation is often the
cause of early life failures. Mechanical damage in the PEM can appear as through-the-thickness flaws or
pinholes in the membrane, or delaminating between the polymer membrane and gas diffusion layers [7,
8].
Mechanical stresses which limit MEA durability have two origins. Firstly, this is the stresses arising
during fuel cell assembly (bolt assembling). The bolts provide the tightness and the electrical
conductivity between the contact elements. Secondly, additional mechanical stresses occur during fuel
cell running because PEM fuel cell components have different thermal expansion and swelling
coefficients. Thermal and humidity gradients in the fuel cell produce dilatations obstructed by tightening
of the screw-bolts. Compressive stress increasing with the hygro-thermal loading can exceed the yield
strength which causes the plastic deformation. The mechanical behaviour of the membrane depends
strongly on hydration and temperature [9, 10].
Water management is one of the critical operation issues in proton exchange membrane (PEM) fuel cells.
Spatially varying concentrations of water in both vapour and liquid form are expected throughout the cell
because of varying rates of production and transport. Devising better water management is therefore a
key issue in PEM fuel cell design, and this requires improved understanding of the parameters affecting
water transport in the membrane [11, 12]. Thermal management is also required to remove the heat
produced by the electrochemical reaction in order to prevent drying out of the membrane, which in turn
can result not only in reduced performance but also in eventual rupture of the membrane [13, 14].
Thermal management is also essential for the control of the water evaporation or condensation rates [15].
As a result of in the changes in temperature and moisture, the PEM, gas diffusion layers (GDL), and
bipolar plates will all experience expansion and contraction. Because of the different thermal expansion
and swelling coefficients between these materials, hygro-thermal stresses are expected to be introduced
into the unit cell during operation. In addition, the non-uniform current and reactant flow distributions in
the cell can result in non-uniform temperature and moisture content of the cell, which could in turn,
potentially causing localized increases in the stress magnitudes. The need for improved lifetime of PEM
fuel cells necessitates that the failure mechanisms be clearly understood and life prediction models be
developed, so that new designs can be introduced to improve long-term performance. Increasing of the
durability is a significant challenge for the development of fuel cell technology. Membrane failure is
believed to be the result of combined chemical and mechanical effects acting together [1, 2, 5].
Variations in temperature and humidity during operation cause stresses and strains (mechanical loading)
in the membrane as well as the MEA and is considered to be the mechanical failure driving force in fuel
cell applications [6-10]. Reactant gas cross over, hydrogen peroxide formation and movement, and
cationic contaminants are all to be major factors contributing to the chemical decomposition of polymer
electrolyte membranes. While chemical degradation of membranes has been investigated and reported
extensively in literature [1-8], there has been little work published on mechanical degradation of the
membrane. Investigating the mechanical response of the membrane subjected to change in humidity and
ISSN 2076-2895 (Print), ISSN 2076-2909 (Online) ©2010 International Energy & Environment Foundation. All rights reserved.
International Journal of Energy and Environment (IJEE), Volume 1, Issue 3, 2010, pp.375-398
377
temperature requires studying and modelling of the stress-strain behaviour of membranes and MEAs.
Weber and Newman [16] developed one-dimensional model to study the stresses development in the fuel
cell. They showed that hygro-thermal stresses might be an important reason for membrane failure, and
the mechanical stresses might be particularly important in systems that are non-isothermal. However,
their model is one-dimensional and does not include the effects of material property mismatch among
PEM, GDL, and bipolar plates.
Tang et al. [17] studied the hygro and thermal stresses in the fuel cell caused by step-changes of
temperature and relative humidity. Influence of membrane thickness was also studied, which shows a
less significant effect. However, their model is two-dimensional, where the hygro-thermal stresses are
absent in the third direction (flow direction). In addition, a simplified temperature and humidity profile
with no internal heat generation ware assumed, (constant temperature for each upper and lower surfaces
of the membrane was assumed).
Kusoglu et al. [18] developed two-dimensional model to investigate the mechanical response of a PEM
subjected to a single hygro-thermal loading cycle, simulating a simplified single fuel cell duty cycle. A
linear, uncoupled, simplified temperature and humidity profile with no internal heat generation, assuming
steady-state conditions, was used for the loading and unloading conditions. Linear-elastic, perfectly
plastic material response with temperature and humidity dependent material properties was used to study
the plastic deformation behaviour of the membrane during the cycle. The stress evolution during a
simplified operating cycle is determined for two alignments of the bipolar plates. They showed that the
alternating gas channel alignment produces higher shear stresses than the aligned gas channel. Their
results suggested that the in-plane residual tensile stresses after one fuel cell duty cycle developed upon
unloading, may lead to the failure of the membranes due to the mechanical fatigue. They concluded that
in order to acquire a complete understanding of these damage mechanisms in the membranes, mechanical
response under continuous hygro-thermal cycles should be studied under realistic cell operating
conditions.
Kusoglu et al. [19] investigated the mechanical response of proton exchange membranes in a fuel cell
assembly under humidity cycles at a constant temperature. The behaviour of the membrane under
hydration and dehydration cycles was simulated by imposing a simplified humidity gradient profile from
the cathode to the anode. Also, a simplified temperature profile with no internal heat generation ware
assumed. Linear elastic, plastic constitutive behaviour with isotropic hardening and temperature and
humidity dependent material properties were utilized in the simulations for the membrane. The evolution
of the stresses and plastic deformation during the humidity cycles were determined using twodimensional finite elements model for various levels of swelling anisotropy. They showed that the
membrane response strongly depends on the swelling anisotropy where the stress amplitude decreases
with increasing anisotropy. Their results suggested that it may be possible to optimize a membrane with
respect to swelling anisotropy to achieve better fatigue resistance, potentially enhancing the durability of
fuel cell membranes.
Solasi et al. [20] developed two-dimensional model to define and understand the basic mechanical
behaviour of ionomeric membranes clamped in a rigid frame, and subjected to changes in temperature
and humidification. Expansion/contraction mechanical response of the constrained membrane as a result
of change in hydration and temperature was also studied in non-uniform geometry. A circular hole in the
centre of the membrane can represent pinhole creation or even material degradation during fuel cell
operation was considered as the extreme form of non-uniformity in this constraint configuration. Their
results showed that the hydration have a bigger effect than temperature in developing mechanical stresses
in the membrane. These stresses will be more critical when non-uniformity as a form of hydration profile
or a physical pinhole exists across the membrane.
Bograchev et al. [21] developed a linear elastic–plastic two-dimensional model of fuel cell with
hardening for analysis of mechanical stresses in MEA arising in cell assembly procedure. The model
includes the main components of real fuel cell (membrane, gas diffusion layers, graphite plates, and seal
joints) and clamping elements (steel plates, bolts, nuts). The stress and plastic deformation in MEA are
simulated taking into account the realistic clamping conditions. Their results concluded that important
variations of stresses generated during the assembling procedure can be a source of the limitation of the
mechanical reliability of the system.
Suvorov et al. [22] analyzed the stress relaxation in the membrane electrode assemblies (MEA) in PEM
fuel cells subjected to compressive loads using numerical simulations (finite element method). This
behaviour is important because nonzero contact stress is required to maintain low electric resistivity in
ISSN 2076-2895 (Print), ISSN 2076-2909 (Online) ©2010 International Energy & Environment Foundation. All rights reserved.
378
International Journal of Energy and Environment (IJEE), Volume 1, Issue 3, 2010, pp.375-398
the fuel cell stack. In addition to the two-dimensional assumption, the temperature was kept fixed and
equal to the operating temperature at all time. All properties were considered to be independent of the
temperature. They showed that under applied compressive strains the contact stress in the membrane
electrode assembly (MEA) will drop with time. The maximum contact stress and the rate of stress
relaxation depend on the individual properties of the membrane and the gas diffusion layer.
Tang et al. [23] examined the hygro-thermo-mechanical properties and response of a class of reinforced
hydrated perfluorosulfonic acid membranes (PFSA) in a fuel cell assembly under humidity cycles at a
constant temperature. The load imposed keeps the membrane at elevated temperature (85 C) and linearly
cycles the relative humidity between the initial (30% RH) and the hydrated state (95% RH) at the
cathode side of membrane. The evolution of hygro-thermally induced mechanical stresses during the
load cycles were determined for reinforced and unreinforced PFSA membranes using two-dimensional
finite elements model. Their numerical simulations showed that the in-plane stresses for reinforced PFSA
membrane remain compressive during the cycling. Compressive stresses are advantageous with respect
to fatigue loading, since compressive in-plane stresses will significantly reduce the slow crack growth
associated with fatigue failures. They showed that the reinforced PFSA membrane exhibits higher
strength and lower in-plane swelling than the unreinforced PFSA membrane used as a reference,
therefore, should result in higher fuel cell durability.
Bograchev et al. [24] developed two-dimensional model to study the evolution of stresses and plastic
deformations in the membrane during the turn-on phase. They showed that the maximal stresses in the
membrane take place during the humidification step before the temperature comes to its steady-state
value. The magnitude of these stresses is sufficient for initiation of the plastic deformations in the Nafion
membrane. The plastic deformations in the membrane develop during the entire humidification step. At
the steady state the stresses have the highest value in the centre of the membrane; the Mises stress is
equal to 2.5 MPa.
In addition to the two-dimensional assumption, the operating conditions have been taken into account by
imposing the heating sources as a simplified directly related relationship between power generation and
efficiency of the fuel cell. The moisture is set gradually from an initial value of 35% up to 100%. The
humidity is imposed after all heat sources reach steady state. The imposed moisture is assumed to be
uniformly distributed in the membrane during turn-on stage (before reaching the steady state). However,
this questionable assumption leads to overestimation of the maximal stresses in the membrane during
turn-on stage.
Al-Baghdadi and Shahad [25] incorporated the effect of hygro and thermal stresses into non-isothermal
three-dimensional CFD model of PEM fuel cell to simulate the hygro and thermal stresses in one part of
the fuel cell components, which is the polymer membrane. They studied the behaviour of the membrane
during the operation of a unit cell. The results showed that the displacement have the highest value in the
centre of the membrane near the cathode side inlet area.
An operating fuel cell has varying local conditions of temperature, humidity, and power generation (and
thereby heat generation) across the active area of the fuel cell in three-dimensions. Nevertheless, except
of ref. [25], no models have yet been published to incorporate the effect of hygro-thermal stresses into
actual fuel cell models to study the effect of these real conditions on the stresses developed in membrane
and gas diffusion layers. In addition, as a result of the architecture of a cell, the transport phenomena in a
fuel cell are inherently three-dimensional, but no models have yet been published to address the hygrothermal stresses in PEM fuel cells with three-dimensional effect. Suvorov et al. [22] reported that the
error introduced due to two-dimensional assumption is about 10%. Therefore, in order to acquire a
complete understanding of the damage mechanisms in the membrane and gas diffusion layers,
mechanical response under steady-state hygro-thermal stresses should be studied under real cell
operating conditions and in real cell geometry (three-dimensional).
The difficult experimental environment of fuel cell systems has stimulated efforts to develop models that
could simulate and predict multi-dimensional coupled transport of reactants, heat and charged species
using computational fluid dynamic (CFD) methods. A comprehensive computational model should
include the equations and other numerical relations needed to fully define fuel cell behaviour over the
range of interest. In the present work, full three-dimensional, non-isothermal computational fluid
dynamics model of a PEM fuel cell has been developed to simulate the hygro and thermal stresses in
PEM fuel cell, which are occurring during the cell operation due to the changes of temperature and
relative humidity. This model is used to study the effect of operating, design, and material parameters on
fuel cell performance and hygro-thermal stresses in the fuel cell MEA.
ISSN 2076-2895 (Print), ISSN 2076-2909 (Online) ©2010 International Energy & Environment Foundation. All rights reserved.
International Journal of Energy and Environment (IJEE), Volume 1, Issue 3, 2010, pp.375-398
379
2. Model description
The present work presents a comprehensive three–dimensional, multi–phase, non-isothermal model of a
PEM fuel cell that incorporates the significant physical processes and the key parameters affecting fuel
cell performance. The model accounts for both gas and liquid phase in the same computational domain,
and thus allows for the implementation of phase change inside the gas diffusion layers. The model
includes the transport of gaseous species, liquid water, protons, and energy. Water transport inside the
porous gas diffusion layer and catalyst layer is described by two physical mechanisms: viscous drag and
capillary pressure forces, and is described by advection within the gas channels. Water transport across
the membrane is also described by two physical mechanisms: electro-osmotic drag and diffusion. The
model features an algorithm that allows for a more realistic representation of the local activation
overpotentials, which leads to improved prediction of the local current density distribution. This leads to
high accuracy prediction of temperature distribution in the cell and therefore thermal stresses. This model
also takes into account convection and diffusion of different species in the channels as well as in the
porous gas diffusion layer, heat transfer in the solids as well as in the gases, and electrochemical
reactions. The present multi-phase model is capable of identifying important parameters for the wetting
behaviour of the gas diffusion layers and can be used to identify conditions that might lead to the onset of
pore plugging, which has a detrimental effect of the fuel cell performance. A unique feature of the model
is to incorporate the effect of hygro-thermal stresses into actual three-dimensional fuel cell model. This
model is used to investigate the hygro and thermal stresses in PEM fuel cell, which developed during the
cell operation due to the changes of temperature and relative humidity.
2.1 Computational domain
A computational model of an entire cell would require very large computing resources and excessively
long simulation times. The computational domain in this study is therefore limited to one straight flow
channel with the land areas. The full computational domain consists of cathode and anode gas flow
channels, and the membrane electrode assembly as shown in Figure 1.
2.2 Model equations
2.2.1 Gas flow channels
In the fuel cell channels, the gas-flow field is obtained by solving the steady-state Navier-Stokes
equations, i.e. the continuity equation, the mass conservation equation for each phase yields the volume
fraction (r ) and along with the momentum equations the pressure distribution inside the channels. The
continuity equation for the gas phase inside the channel is given by;
∇ ⋅ rg ρ g u g = 0
(1)
(
)
and for the liquid phase inside the channel becomes;
∇ ⋅ (rl ρ l u l ) = 0
(2)
where u is velocity vector [m/s], ρ is density [kg/m3].
Two sets of momentum equations are solved in the channels, and they share the same pressure field.
Under these conditions, it can be shown that the momentum equations becomes;
[
2
⎛
⎞
T
∇ ⋅ (ρ g u g ⊗ u g − µ g ∇u g ) = −∇rg ⎜ P + µ g ∇ ⋅ u g ⎟ + ∇ ⋅ µ g (∇u g )
3
⎝
⎠
2
⎛
⎞
T
∇ ⋅ (ρ l u l ⊗ u l − µ l ∇u l ) = −∇rl ⎜ P + µ l ∇ ⋅ u l ⎟ + ∇ ⋅ µ l (∇u l )
3
⎝
⎠
[
]
]
(3)
(4)
where P is pressure (Pa), µ is viscosity [kg/(m⋅s)].
The mass balance is described by the divergence of the mass flux through diffusion and convection.
Multiple species are considered in the gas phase only, and the species conservation equation in multicomponent, multi-phase flow can be written in the following expression for species i;
ISSN 2076-2895 (Print), ISSN 2076-2909 (Online) ©2010 International Energy & Environment Foundation. All rights reserved.
380
International Journal of Energy and Environment (IJEE), Volume 1, Issue 3, 2010, pp.375-398
N
⎡
∇T ⎤
∇M ⎞
∇P ⎤
M ⎡⎛
+ rg ρ g yi ⋅ u g + DiT
∇ ⋅ ⎢− rg ρ g yi ∑ Dij
⎜ ∇y j + y j
⎟ + (x j − y j )
⎥=0
T ⎥
P ⎥
M ⎠
M j ⎢⎝
j =1
⎣
⎦
⎢
⎣
⎦
(5)
where T is temperature (K), y is mass fraction, x is mole fraction, D is diffusion coefficient [m2/s].
Subscript i denotes oxygen at the cathode side and hydrogen at the anode side, and j is water vapour in
both cases. Nitrogen is the third species at the cathode side.
Figure 1. Three-dimensional computational domain
The Maxwell-Stefan diffusion coefficients of any two species are dependent on temperature and
pressure. They can be calculated according to the empirical relation based on kinetic gas theory [8];
ISSN 2076-2895 (Print), ISSN 2076-2909 (Online) ©2010 International Energy & Environment Foundation. All rights reserved.
International Journal of Energy and Environment (IJEE), Volume 1, Issue 3, 2010, pp.375-398
⎡ 1
1 ⎤
+
Dij =
⎥
2 ⎢
13
13
Mj⎥
⎡⎛
⎣M
⎦
⎞
⎛
⎞ ⎤ ⎢ i
P ⎢⎜ ∑Vki ⎟ + ⎜ ∑Vkj ⎟ ⎥
⎠
⎝ k
⎠ ⎥
⎢⎝ k
⎣
⎦
T 1.75 × 10 −3
381
12
(6)
In this equation, the pressure is in atm and the binary diffusion coefficient Dij is in [cm2/s].
The values for (∑ Vki ) are given by Fuller et al. [8].
The temperature field is obtained by solving the convective energy equation;
∇ ⋅ (rg (ρ g Cp g u g T − k g ∇T )) = 0
(7)
where Cp is specific heat capacity [J/(kg.K)], k is gas thermal conductivity [W/(m.K)].
The gas phase and the liquid phase are assumed to be in thermodynamic equilibrium; hence, the
temperature of the liquid water is the same as the gas phase temperature.
2.2.2 Gas diffusion layers
The physics of multiple phases through a porous medium is further complicated here with phase change
and the sources and sinks associated with the electrochemical reaction. The equations used to describe
transport in the gas diffusion layers are given below. Mass transfer in the form of evaporation
&
&
m phase > 0 and condensation m phase < 0 is assumed, so that the mass balance equations for both
(
)
(
)
phases are;
&
∇ ⋅ ((1 − sat )ρ g εu g ) = m phase
(8)
&
∇ ⋅ (sat.ρ l εu l ) = m phase
(9)
where sat is saturation, ε is porosity
The momentum equation for the gas phase reduces to Darcy’s law, which is, however, based on the
relative permeability for the gas phase (KP ) . The relative permeability accounts for the reduction in pore
space available for one phase due to the existence of the second phase [9].
The momentum equation for the gas phase inside the gas diffusion layer becomes;
(10)
u g = −(1 − sat ) Kp.∇P µ g
where KP is hydraulic permeability [m2].
Two liquid water transport mechanisms are considered; shear, which drags the liquid phase along with
the gas phase in the direction of the pressure gradient, and capillary forces, which drive liquid water from
high to low saturation regions [9]. Therefore, the momentum equation for the liquid phase inside the gas
diffusion layer becomes;
ul = −
KPl
µl
∇P +
KPl ∂Pc
∇sat
µ l ∂sat
(11)
where Pc is capillary pressure [Pa].
The functional variation of capillary pressure with saturation is prescribed following Leverett [9] who
has shown that;
⎛ ε ⎞
Pc = τ ⎜
⎟
⎝ KP ⎠
12
(1.417(1 − sat ) − 2.12(1 − sat )
2
+ 1.263(1 − sat )
3
)
(12)
where τ is surface tension [N/m].
The liquid phase consists of pure water, while the gas phase has multi components. The transport of each
species in the gas phase is governed by a general convection-diffusion equation in conjunction which the
Stefan-Maxwell equations to account for multi species diffusion;
ISSN 2076-2895 (Print), ISSN 2076-2909 (Online) ©2010 International Energy & Environment Foundation. All rights reserved.
International Journal of Energy and Environment (IJEE), Volume 1, Issue 3, 2010, pp.375-398
382
N
⎡
⎤
∇M ⎞
∇P ⎤
M ⎡⎛
T ∇T
&
∇ ⋅ ⎢− (1 − sat )ρ g εyi ∑ Dij
⎢⎜ ∇y j + y j M ⎟ + (x j − y j ) P ⎥ + (1 − sat )ρ g εyi ⋅ u g + εDi T ⎥ = m phase
M j ⎣⎝
⎠
j =1
⎦
⎢
⎥
⎣
⎦
(13)
In order to account for geometric constraints of the porous media, the diffusivities are corrected using the
Bruggemann correction formula [10];
eff
(14)
Dij = Dij × ε 1.5
The heat transfer in the gas diffusion layers is governed by the energy equation as follows;
&
∇ ⋅ ((1 − sat )(ρ g εCp g u g T − k eff , g ε∇T )) = εβ (Tsolid − T ) − εm phase ∆H evap
(15)
where keff is effective electrode thermal conductivity [W/(m⋅K)]; the term [εβ(Tsolid−T)], on the right hand
side, accounts for the heat exchange to and from the solid matrix of the GDL. The gas phase and the
liquid phase are assumed to be in thermodynamic equilibrium, i.e., the liquid water and the gas phase are
at the same temperature.
The potential distribution in the gas diffusion layers is governed by;
∇ ⋅ (λe ∇φ ) = 0
(16)
where λe is electrode electronic conductivity [S/m].
In order to account for the magnitude of phase change inside the GDL, expressions are required to relate
the level of over- and undersaturation as well as the amount of liquid water present to the amount of
water undergoing phase change. In the present work, the procedure of Berning and Djilali [9] was used to
account for the magnitude of phase change inside the GDL.
2.2.3 Catalyst layers
The catalyst layer is treated as a thin interface, where sink and source terms for the reactants are
implemented. Due to the infinitesimal thickness, the source terms are actually implemented in the last
grid cell of the porous medium. At the cathode side, the sink term for oxygen is given by;
S O2 = −
M O2
4F
ic
(17)
where F is Faraday’s constant (96487 [C/mole]), ic is cathode local current density [A/m2], M is
molecular weight [kg/mole].
Whereas the sink term for hydrogen is specified as;
S H2 = −
M H2
2F
ia
(18)
where ia is anode local current density [A/m2]
The production of water is modelled as a source terms, and hence can be written as;
S H 2O =
M H 2O
2F
ic
(19)
The generation of heat in the cell is due to entropy changes as well as irreversibility's due to the
activation overpotential [11];
⎡ T (− ∆s )
⎤
&
q=⎢
+ η act ⎥ i
⎣ ne F
⎦
(20)
&
where q is heat generation [W/m2], ne is number of electrons transfer, s is specific entropy [J/(mole.K)],
ηact is activation overpotential (V).
The local current density distribution in the catalyst layers is modelled by the Butler-Volmer equation
[12], [13];
ISSN 2076-2895 (Print), ISSN 2076-2909 (Online) ©2010 International Energy & Environment Foundation. All rights reserved.
International Journal of Energy and Environment (IJEE), Volume 1, Issue 3, 2010, pp.375-398
⎛ CO2
ref
ic = io ,c ⎜ ref
⎜ CO
⎝ 2
ia = i
ref
o ,a
⎛ CH2
⎜
ref
⎜ CH
⎝ 2
⎞⎡ ⎛ α a F
⎞⎤
⎛ α F
⎞
⎟ ⎢exp⎜
η
+ exp⎜ − c η act ,c ⎟⎥
⎟ ⎣ ⎝ RT act ,c ⎟
⎠⎦
⎝ RT
⎠
⎠
383
(21)
12
⎞ ⎡ ⎛αaF
⎞
⎛ α F
⎞⎤
⎟ exp⎜
η ⎟ + exp⎜ − c η act ,a ⎟⎥
⎟ ⎢ ⎝ RT act ,a ⎠
⎝ RT
⎠⎦
⎠ ⎣
where C H 2 is local hydrogen concentration
(22)
ref
[mole/m3], C H 2 is reference hydrogen concentration
ref
[mole/m3], CO2 is local oxygen concentration [mole/m3], CO2 is reference oxygen concentration
ref
ref
[mole/m3], io,a is anode reference exchange current density, io,c is cathode reference exchange current
density, R is universal gas constant (8.314 [J/(mole⋅K)]), αa is charge transfer coefficient, anode side,
and αc is charge transfer coefficient, cathode side.
2.2.4 Membrane
The balance between the electro-osmotic drag of water from anode to cathode and back diffusion from
cathode to anode yields the net water flux through the membrane;
N W = n d M H 2O
i
− ∇ ⋅ (ρDW ∇cW )
F
(23)
where Nw is net water flux across the membrane [kg/(m2⋅s)], nd is electro-osmotic drag coefficient.
The water diffusivity in the polymer can be calculated as follow [14];
⎡
1 ⎞⎤
⎛ 1
− ⎟⎥
DW = 1.3 × 10 −10 exp ⎢2416⎜
⎝ 303 T ⎠⎦
⎣
The
variable
cW
represents
(i.e. mol H 2 O equivalent
activity via [15], [16];
−
SO 3 1
the
(24)
number
of
water
molecules
per
sulfonic
acid
group
). The water content in the electrolyte phase is related to water vapour
cW = 0.043 + 17.81a − 39.85a 2 + 36.0a 3
cW = 14.0 + 1.4(a − 1)
cW = 16.8
(0 < a ≤ 1)
(1 < a ≤ 3)
(a ≥ 3)
(25)
The water vapour activity a given by;
a = xW P Psat
(26)
Heat transfer in the membrane is governed by;
∇ ⋅ (k mem ⋅ ∇T ) = 0
(27)
where kmem is membrane thermal conductivity [W/(m⋅K)].
The potential loss in the membrane is due to resistance to proton transport across membrane, and is
governed by;
∇ ⋅ (λm ∇φ ) = 0
(28)
where λm is membrane ionic conductivity [S/m].
2.2.5 Hygro-Thermal stresses in fuel cell
Using hygrothermoelasticity theory, the effects of temperature and moisture as well as the mechanical
forces on the behaviour of elastic bodies have been addressed. An uncoupled theory is assumed, for
which the additional temperature changes brought by the strain are neglected [2]. The total strain tensor
is determined using the following expression;
ISSN 2076-2895 (Print), ISSN 2076-2909 (Online) ©2010 International Energy & Environment Foundation. All rights reserved.
International Journal of Energy and Environment (IJEE), Volume 1, Issue 3, 2010, pp.375-398
384
π = π M +πT +π S
(29)
where, π M is the contribution from the mechanical forces and π T , π S are the thermal and swelling
induced strains, respectively.
The thermal strains resulting from a change in temperature of an unconstrained isotropic volume are
given by;
π T = ℘ T − TRe f
(30)
(
)
where ℘ is thermal expansion [1/K].
The swelling strains caused by moisture change in membrane are given by;
π S = D mem (ℜ − ℜ Re f )
(31)
where D mem is membrane humidity swelling-expansion tensor and ℜ is the relative humidity [%].
Assuming linear response within the elastic region, the isotropic Hooke's law is used to determine the
stress tensor σ .
σ = Gπ
(32)
where G is the constitutive matrix.
The effective stresses according to von Mises, 'Mises stresses', are given by;
σv =
(σ 1 − σ 2 )2 + (σ 2 − σ 3 )2 + (σ 3 − σ 1 )2
2
(33)
where σ 1 , σ 2 , σ 3 are the principal stresses.
The mechanical boundary conditions are noted in Figure 1. The initial conditions corresponding to zero
stress-state are defined; all components of the cell stack are set to reference temperature 20 C, and
relative humidity 35% (corresponding to the assembly conditions) [17, 24, 35]. In addition, a constant
pressure of (1 MPa) is applied on the surface of lower graphite plate, corresponding to a case where the
fuel cell stack is equipped with springs to control the clamping force [17-19, 21, 24].
2.3 Computational procedure
The governing equations were discretized using a finite-volume method and solved using the multiphysics CFD code. Stringent numerical tests were performed to ensure that the solutions were
independent of the grid size. A computational quadratic mesh consisting of a total of 64586 nodes and
350143 meshes was found to provide sufficient spatial resolution (Figure 2). The coupled set of
equations was solved iteratively, and the solution was considered to be convergent when the relative
error was less than 1.0×10⁻⁶ in each field between two consecutive iterations. The calculations presented
here have all been obtained on a Pentium IV PC (3 GHz, 2 GB RAM), using Windows XP operating
system.
The geometric and the base case operating conditions are listed in Table 1. The values of the
electrochemical transport parameters for the base case operating conditions are listed in Table 2. The
material properties used in this model are also listed in Table 2.
The solution begins by specifying a desired current density of the cell to use for calculating the inlet
flowrates at the anode and cathode sides. An initial guess of the activation overpotential is obtained from
the desired current density using the Butler–Volmer equation. Then follows by computing the flow fields
for each phase for velocities u, v,w, and pressure P. Once the flow field is obtained, the mass fraction
equations are solved for the mass fractions of oxygen, hydrogen, nitrogen, and water. Scalar equations
are solved last in the sequence of the transport equations for the temperature field in the cell and potential
fields in the gas diffusion layers and the membrane. The local current densities are solved based on the
Butler–Volmer equation. After the local current densities are obtained, the local activation overpotentials
can be readily calculated from the Butler–Volmer equation. The local activation overpotentials are
updated after each global iterative loop. Hooke’s law with total strain tensor is solved to determine the
ISSN 2076-2895 (Print), ISSN 2076-2909 (Online) ©2010 International Energy & Environment Foundation. All rights reserved.
International Journal of Energy and Environment (IJEE), Volume 1, Issue 3, 2010, pp.375-398
385
stress tensor. Convergence criteria are then performed on each variable and the procedure is repeated
until convergence. The properties are updated after each global iterative loop based on the new local gas
composition and temperature. Source terms reflect changes in the overall gas phase mass flow due to
consumption or production of gas species via reaction and due to mass transfer between water in the
vapour phase and water that is in the liquid phase (phase-change). The flow diagram of the algorithm is
shown in Figure 3.
Figure 2. Computational mesh of a PEM fuel cell
ISSN 2076-2895 (Print), ISSN 2076-2909 (Online) ©2010 International Energy & Environment Foundation. All rights reserved.
386
International Journal of Energy and Environment (IJEE), Volume 1, Issue 3, 2010, pp.375-398
Table 1. Geometrical and operational parameters for base case conditions
Parameter
Symbol
Value
Unit
Channel length
Channel width
Channel height
Land area width
L
W
H
0.05
1e-3
1e-3
1e-3
m
m
m
m
Gas diffusion layer thickness
δ GDL
δ mem
δ CL
0.26e-3
m
0.23e-3
m
0.0287e-3
m
Hydrogen reference mole fraction
ref
xH 2
0.84639
-
Oxygen reference mole fraction
ref
xO2
0.17774
-
Anode pressure
Pa
Pc
Tcell
3
3
atm
atm
353.15
K
100
%
2
-
2
-
Wet membrane thickness (Nafion® 117)
Catalyst layer thickness
Cathode pressure
Inlet fuel and air temperature
Relative humidity of inlet fuel and air (fully humidified
conditions)
Air stoichiometric flow ratio
Fuel stoichiometric flow ratio
Wland
ψ
ξc
ξa
ISSN 2076-2895 (Print), ISSN 2076-2909 (Online) ©2010 International Energy & Environment Foundation. All rights reserved.
International Journal of Energy and Environment (IJEE), Volume 1, Issue 3, 2010, pp.375-398
387
Table 2. Electrode and membrane parameters for base case operating conditions
Parameter
Symbol
Electrode porosity
Electrode electronic conductivity
Membrane ionic conductivity (Nafion®117)
Transfer coefficient, anode side
Transfer coefficient, cathode side
ε
λe
λm
αa
αc
Value
Unit
Ref.
0.4
100
-
S /m
[13]
[15]
17.1223
S /m
[28]
0.5
-
[13]
1
-
[32]
Cathode reference exchange current density
ref
io , c
1.8081e-3
A / m2
[14]
Anode reference exchange current density
ref
io , a
2465.598
[14]
Electrode thermal conductivity
keff
1.3
A / m2
W / m.K
Membrane thermal conductivity
kmem
kp
∆S
0.455
W / m.K
[28]
1.76e-11
-326.36
4e6
m2
J / mole.K
W / m3
[31]
[30]
[13]
DH +
4.5e-9
m2 / s
[13]
Fixed-charge concentration
cf
1200
mole / m3
[13]
Fixed-site charge
zf
-1
-
[13]
Electro-osmotic drag coefficient
nd
ℑ GDL
ℑ mem
℘GDL
℘mem
ΨGDL
Ψmem
2.5
-
[28]
0.25
-
[17]
0.25
-
[17]
-0.8e-6
1K
[17]
123e-6
[35]
1e10
1K
Pa
[17]
249e6
Pa
[35]
ρ GDL
ρ mem
400
[17]
D mem
23e-4
kg m 3
kg m 3
1%
Electrode hydraulic permeability
Entropy change of cathode side reaction
Heat transfer coefficient between solid and
gas phase
Protonic diffusion coefficient
Electrode Poisson's ratio
Membrane Poisson's ratio
Electrode thermal expansion
Membrane thermal expansion
Electrode Young's modulus
Membrane Young's modulus
Electrode density
Membrane density
Membrane
tensor
humidity
swelling-expansion
β
2000
[28]
[17]
[17]
ISSN 2076-2895 (Print), ISSN 2076-2909 (Online) ©2010 International Energy & Environment Foundation. All rights reserved.
388
International Journal of Energy and Environment (IJEE), Volume 1, Issue 3, 2010, pp.375-398
Figure 3. Flow diagram of the solution procedure used
3. Results and discussion
The multi-phase model is validated by comparing model results to experimental data provided by Wang
et al. [31]. The importance of phase change to the accurate modelling of fuel cell performance is
illustrated. Figure 4 shows the comparison of the polarization curves from the experimental data with the
values obtained by the model at different operating fuel cell temperatures. It can be seen that the
modelling results compare well with the experimental data. The importance of phase change to the
accurate modelling of fuel cell performance is illustrated. Performance curves with and without phase
change are also shown in Figure 4 for the base case conditions. Comparison of the two curves
demonstrates that the effects of liquid water accumulation become apparent even at relatively low values
of current density. Furthermore, when liquid water effects are not included in the model, the cell voltage
dose not exhibit an increasingly steep drop as the cell approaches its limiting current density. This drop
off in performance is clearly demonstrated by experimental data, but cannot be accurately modelled
without the incorporation of phase change. By including the effects of phase change, the current model is
able to more closely simulate performance, especially in the region where mass transport effects begin to
dominate.
ISSN 2076-2895 (Print), ISSN 2076-2909 (Online) ©2010 International Energy & Environment Foundation. All rights reserved.
International Journal of Energy and Environment (IJEE), Volume 1, Issue 3, 2010, pp.375-398
389
Figure 4. Comparison of the model and the experimental polarization curves
3.1 Base case operating conditions
The Membrane-Electrode-Assembly (MEA) is the core component of PEM fuel cell and consists of
membrane with the gas-diffusion layers including the catalyst attached to each side. It is influence by
varying local conditions of temperature and humidity. Figure 5a shows the distribution of the
temperature inside the MEA during the cell operating at base case condition. In general, the temperature
at the cathode side is higher than at the anode side, due to the reversible and irreversible entropy
production. Naturally, the maximum temperature occurs, where the electrochemical activity is the
highest, which is near the cathode side inlet area. The temperature peak appears in the cathode catalyst
layer, implying that major heat generation takes place in this region.
Several transport mechanisms in the cell affect water distribution. In the membrane, primary transport is
through (i) electro-osmotic drag associated with the protonic current in the electrolyte, which results in
water transport from anode to cathode; and (ii) diffusion associated with water-content gradients in the
membrane. One of the main difficulties in managing water in a PEM fuel cell is the conflicting
requirements of the membrane and of the catalyst gas diffusion layer. On the cathode side, excessive
liquid water may block or flood the pores of the catalyst layer, the gas diffusion layer or even the gas
channel, thereby inhibiting or even completely blocking oxygen mass transfer. On the anode side, as
water is dragged toward the cathode via electro-osmotic transport, dehumidification of the membrane
may occur, resulting in deterioration of protonic conductivity. In the extreme case of complete drying,
local burnout of the membrane can result. Figure 5b shows profiles for polymer water content in the
membrane for the base case conditions. The influence of electro-osmotic drag and back diffusion are
readily apparent from this result.
Due to the varying local conditions of temperature and humidity across the MEA, the hygro and thermal
stresses are introduced. Figure 6 shows von Mises stress distribution (contour plots) and deformation
shape (scale enlarged 200 times) across the MEA on the y-z plane at x=10 mm. The figure illustrates the
effect of stresses on the MEA. Because of the different thermal expansion and swelling coefficients
between gas diffusion layers and membrane materials with non-uniform temperature distributions in the
cell during operation, hygro-thermal stresses and deformation are introduced. The non-uniform
distribution of stress, caused by the temperature gradient in the MEA, induces localized bending stresses,
which can contribute to delaminating between the membrane and the GDLs.
ISSN 2076-2895 (Print), ISSN 2076-2909 (Online) ©2010 International Energy & Environment Foundation. All rights reserved.
390
International Journal of Energy and Environment (IJEE), Volume 1, Issue 3, 2010, pp.375-398
(a)
(b)
Figure 5. (a) Temperature distribution inside the MEA and (b) water content distribution in the
membrane (Base case conditions)
ISSN 2076-2895 (Print), ISSN 2076-2909 (Online) ©2010 International Energy & Environment Foundation. All rights reserved.
International Journal of Energy and Environment (IJEE), Volume 1, Issue 3, 2010, pp.375-398
391
Figure 6. Mises stress distribution (contour) and total displacement (deformed shape plot, X200) in the
MEA at base case conditions
3.2 Parametric study
The performance characteristics of the fuel cell based on a certain parameter can be obtained by varying
that parameter while keeping all other parameters constant at base case conditions. Results obtained from
these parametric studies will allow us to identify the critical parameters for fuel cell performance. Results
with deferent operating conditions for the cell operates at nominal current density of 1.2 A/cm2 are
discussed in the following subsections. In the following subsections only the parameter investigated is
changed, all other parameters are at the base case conditions as outlined in Table 1 and Table 2.
3.2.1 Operating parameters
3.2.1.1 Effect of temperature
The temperature basically affects all the different transport phenomena inside the fuel cell. The
composition of the incoming gas streams depends strongly on the temperature. Assuming the inlet gases
are fully humidified, the partial pressure of water vapour entering the cell depends on the temperature
only. Thus, the molar fraction of water vapour is a function of the total inlet pressure and temperature,
and so the molar fraction of the incoming hydrogen and oxygen depend on the temperature and pressure
as well. At an operating pressure of 1 atm the effect of the temperature on the inlet composition is much
stronger than at elevated pressures. At 90 C for atmospheric pressure, almost 68% (molar) of incoming
cathode side gas stream consists of water vapour and only around 6.6% is oxygen. The result is a
decrease in the molar oxygen fraction at the catalyst layer. It is expected that this will affect mainly the
limiting current density. The molar oxygen fraction at the catalyst layer decreases with increasing of the
cell operating temperature, due to the reduction of the molar oxygen fraction in the incoming gas
streams. The result is a much higher fraction of the local current density and it is generated under the
channel area. The results show that the temperature distribution inside the cell show that the maximum
temperature occurs at higher cell operating temperature case (90 C), and this leads to increasing the
Mises stresses, the total displacement, and the degree of the deformation inside the MEA, but the
maximum temperature gradient appears in the lower cell operating temperature case (60 C), due to the
high activation overpotential, which leads to more heat generation with drop of the cell voltage. The
activation overpotential decreases with increasing of cell operating temperature. This is because of the
exchange current density of the oxygen reduction reaction increases rapidly with temperature due to the
ISSN 2076-2895 (Print), ISSN 2076-2909 (Online) ©2010 International Energy & Environment Foundation. All rights reserved.
392
International Journal of Energy and Environment (IJEE), Volume 1, Issue 3, 2010, pp.375-398
enhanced reaction kinetics, which reduces activation losses. A higher temperature leads also to a higher
diffusivity of the hydrogen protons in the electrolyte membrane, thereby reducing the membrane
resistance and this leads to reducing the potential loss in the membrane. mass transport loss increases as
the cell operating temperature increases due to the reduction of the molar oxygen fraction in the
incoming gas streams and, hence, a reduction in the molar oxygen fraction at the catalyst layer.
3.2.1.2 Effect of pressure
Similar to the temperature, the operating pressure affects numerous transport parameters that are
important for the fuel cell operation. The saturation pressure of water vapour depends only on the
temperature and it remains constant for a variation of the inlet pressure. A change in the operating
pressure leads to a change in the inlet gas compositions, assuming the inlet gases are fully humidified.
The increase in the molar oxygen fraction in the incoming gas streams is significant when the pressure is
increased from atmospheric pressure up to 3 atm. A further increase in the pressure from 3 atm to 5 atm
dose not lead to a significant improvement in terms of the molar oxygen fraction. The effect of the cell
operating pressure on the local current distribution shows that the higher cell operating pressure results in
more even distribution of the local current density due to the high oxygen concentration at the catalyst
layer. This leads to the fact that for a lower cell operating pressure at a constant nominal current density,
there is a much stronger distribution of current inside the cell, the maximum local current density being
at the inlet under the channel area. Therefore, the maximum temperature gradient appears in the cathode
side catalyst layer of the lower cell operating pressure, and this leads to increasing the Mises stresses, the
total displacement, and the degree of the deformation inside the MEA. The activation overpotential
decreases with increasing of the cell operating pressure. This is because of the exchange current density
of the oxygen reduction reaction increases with increasing of the cell operating pressure due to the
enhanced reaction kinetics. To reduce mass transport loss, the cathode is usually run at high pressure. In
essence, higher pressures help to force the oxygen and hydrogen into contact with the electrolyte and this
leads to reducing the mass transport loss.
3.2.1.3 Effect of stoichiometric flow ratio
The stoichiometric flow ratio has an important impact on the water management in the cell. The amount
of incoming air determines how much water vapour can be carried out of the cell. The effect of the
stoichiometric flow ratio on the local current distribution shows that the higher stoichiometric flow ratio
results in more even distribution of the local current density due to the high oxygen concentration at the
catalyst layer. Therefore, the maximum temperature gradient appears in the cathode side catalyst layer of
the lower stoichiometric flow ratio case, and this leads to increasing the Mises stresses, the total
displacement, and the degree of the deformation inside the MEA. For an optimum fuel cell performance,
and in order to avoid large temperature gradients inside the fuel cell, it is desirable to achieve a uniform
current density distribution inside the cell.
3.2.2 Design parameters
3.2.2.1 Effect of gas channels width
A reduction in the land area width by increasing the width of the gas flow channel enhances the mass
transport of the reactions to the catalyst layer that lies under the land area. The result is an increase in the
molar oxygen fraction at the catalyst layer with more even distribution. It is expected that this will affect
mainly the limiting current density and to a lesser degree, the voltage drop due to mass transport
limitations.
The channel width has a large impact on the local current density distribution. For the narrow channel,
the local current density can exceed more than 40% of the nominal current density with a sharp drop-off
under the land area, where the local current density is about 40% lower than the nominal current density.
The wider channel makes for a much more evenly distributed current throughout the cell. However, the
temperature peak appears in the cathode side catalyst layer of the wider channel case, implying that
major heat generation takes place where the electrochemical activity is the highest, and this leads to
increasing the Mises stresses, the total displacement, and the degree of the deformation inside the MEA.
This is because of the increase in the width of the gas flow channel means that the velocity of the
incoming gas has to be decreased with all remaining parameters remaining constant, and this will
decrease the gases velocity in the gas diffusion layer and hence, reduced the convection heat transfer in
this region.
ISSN 2076-2895 (Print), ISSN 2076-2909 (Online) ©2010 International Energy & Environment Foundation. All rights reserved.
International Journal of Energy and Environment (IJEE), Volume 1, Issue 3, 2010, pp.375-398
393
Finally, a reduced width of the land area increases the contact resistance between the bipolar plates and
the gas diffusion electrodes. Since this is an ohmic loss, it is directly correlated to the land area width.
3.2.2.2 Effect of GDL thickness
The effect of gas diffusion layer thickness on the fuel cell performance is again mostly on the mass
transport, as the ohmic losses of the electrons inside the gas diffusion layer are relatively small due to the
high conductivity of the carbon fiber paper. A thinner gas diffusion layer increases the mass transport
through it, and this leads to reduction the mass transport loss. The molar oxygen fraction at the catalyst
layer increases with a decreasing of the gas diffusion layer thickness due to the reduced resistance to the
oxygen diffusion by the thinner layer. The distribution of the local current density of the cathode side
depends directly on the oxygen concentration. The thicker gas diffusion layer results in more even
distribution of the local current density due to the more even distribution of the molar oxygen fraction at
the catalyst layer. This leads to the fact that for a thinner gas diffusion layer at a constant current density,
there is a much stronger distribution of current inside the cell, the maximum local current density being
at the inlet under the channel area.
Therefore, the maximum temperature gradient appears in the cathode side catalyst layer of the thinner
gas diffusion layer case, and this leads to increasing the Mises stresses, the total displacement, and the
degree of the deformation inside the MEA.
3.2.2.3 Effect of membrane thickness
The effect of membrane thickness on the fuel cell performance is mostly on the resistance of the proton
transport across the membrane. The potential loss in the membrane is due to resistance to proton
transport across the membrane from anode catalyst layer to cathode catalyst layer. Therefore, a reduction
in the membrane thickness means that the path travelled by the protons will be decreased, thereby
reducing the membrane resistance and this leads to reducing the potential loss in the membrane, which in
turn leads to less heat generation in the membrane, and this leads to reducing the Mises stresses, the total
displacement, and the degree of the deformation inside the MEA.
These results suggested that reducing the membrane thickness played a significant role in promoting cell
performance. However, there is a limitation to this reduction, due to the effect of increased gas crossover with very thin membranes.
3.2.3 Material parameters
3.2.3.1 Effect of GDL porosity
The porosity of the gas diffusion layer has two comparing effects on the fuel cell performance; as the
porous region provides the space for the reactants to diffuse towards the catalyst region, an increase in
the porosity means that the onset of mass transport limitations occurs at higher current densities, i.e. it
leads to higher limiting currents.
The adverse effect of a high porosity is increase in the contact resistance. Higher gas diffusion layer
porosity improves the mass transport within the cell and this leads to reducing the mass transport loss.
The molar oxygen fraction at the catalyst layer increases with more even distribution with an increasing
in the porosity. This is because of a higher value of the porosity provides less resistance for the oxygen to
reach the catalyst layer. A higher porosity evens out the local current density distribution. For a lower
value of the porosity a much higher fraction of the total current is generated under the channel area. This
can lead to local hot spots inside the membrane electrode assembly. These hot spots can lead to a further
drying out of the membrane, thus increasing the electric resistance, which in turn leads to more heat
generation and therefore increasing the Mises stresses, the total displacement, and the degree of the
deformation inside the MEA.
Thus, it is important to keep the current density relatively even throughout the cell. As mentioned above,
another loss mechanism that is important when considering different gas diffusion layer porosities is the
contact resistance. Contact resistance occurs at all interfaces inside the fuel cell. The magnitude of the
contact resistance depends on various parameters such as the surface material and treatment and the
applied stack pressure. The electrode porosity has a negative effect on electron conduction, since the
solid matrix of the gas diffusion layer provide the pathways for electron transport, the higher volume
porosity increases resistance to electron transport in the gas diffusion layers.
ISSN 2076-2895 (Print), ISSN 2076-2909 (Online) ©2010 International Energy & Environment Foundation. All rights reserved.
International Journal of Energy and Environment (IJEE), Volume 1, Issue 3, 2010, pp.375-398
394
3.2.3.2 Effect of GDL thermal conductivity
Thermal management is required to remove the heat produced by the electrochemical reaction in order to
prevent drying out of the membrane and excessive thermal stresses that may result in rupture of the
membrane. The small temperature differential between the fuel cell stack and the operating environment
make thermal management a challenging problem in PEM fuel cells. The maximum temperature with
higher gradient appears in the cathode side catalyst layer of the lower thermal conductivity. Heat
generated in the catalyst layer is primarily removed through the gas diffusion layer to the current
collector rib by lateral conduction. This process is controlled by the gas diffusion later thermal
conductivity. Therefore, the membrane temperature is strongly influenced by the gas diffusion layer
thermal conductivity, indicating a significant role played by lateral heat conduction through the gas
diffusion layer in the removal of waste heat to the ambient. Therefore, a gas diffusion layer material
having higher thermal conductivity is strongly recommended for fuel cells designed to operate with high
power.
3.2.3.3 Effect of membrane thermal conductivity
The higher membrane conductivity results in more even distribution of the temperature inside the cell.
The lower membrane conductivity means that it is likely that heat accumulates at the cathode catalyst
surface during operation. Therefore, a membrane material having higher thermal conductivity is strongly
recommended for fuel cells designed to operate with high power density.
3.3 Optimal conditions to achieve long cell life
Results with deferent operating conditions are summarized in Figure 7. The maximum displacement at
various operating conditions is compared at constant nominal current density of 1.2 A/cm2. To achieve
long cell life, the results show that the cell must be operate at lower cell operating temperature, higher
cell operating pressure, higher stoichiometric flow ratio, and must have higher GDL porosity, higher
GDL thermal conductivity, higher membrane thermal conductivity, narrower gases channels, thicker gas
diffusion layers, and thinner membrane.
The parameters that achieve long cell life are presented in Table 3. These parameters have been used in
the CFD model to predict the stresses, displacement, and the degree of deformation in the cell for the
optimal conditions. Figure 8 shows von Mises stress distribution (contour plots) and deformation shape
(scale enlarged 200 times) for MEA on the y-z plane at x=10 mm for optimal operating conditions of
long cell life (Table 3). The figure illustrates the effect of stresses on the MEA. This distribution of
stresses is more uniform with less important displacement compared with all previous parametric results.
The results show that the maximum displacement is only 1.37 micro m. This value is less than the
displacement that occurs in the base case operating conditions by about 50%.
Table 3. Optimal parameters for optimum design and operating conditions to achieve long cell life
Parameter
Cell operating temperature
Cell operating pressure
Stoichiometric flow ratio
Gas channel width
GDL porosity
GDL thickness
GDL thermal conductivity
Membrane thermal conductivity
Membrane thickness
•
Value
60 C
5 atm
3
0.8 mm
0.5
0.3 mm
2.9 W/m.K
0.6 W/m.K
0.2 mm
All other parameters keeping constant at base case conditions. (Table 1 and 2)
ISSN 2076-2895 (Print), ISSN 2076-2909 (Online) ©2010 International Energy & Environment Foundation. All rights reserved.
International Journal of Energy and Environment (IJEE), Volume 1, Issue 3, 2010, pp.375-398
395
Figure 7. Change in maximum displacement with different operating conditions compared to the base
case conditions
Key:
1- Base case
2- Cell operating temperature = 60 C
3- Cell operating temperature = 90 C
4- Cell operating pressure = 1 atm
5- Cell operating pressure = 5 atm
6- Stoichiometric flow ratio = 1.5
7- Stoichiometric flow ratio = 3
8- GDL porosity = 0.3
9- GDL porosity = 0.5
10- GDL thermal conductivity = 0.5 W/m.K
11- GDL thermal conductivity = 2.9 W/m.K
12- Gas channel width = 0.8 mm
13- Gas channel width = 1.2 mm
14- GDL thickness = 0.2 mm
15- GDL thickness = 0.3 mm
16- Membrane thickness = 0.2 mm
17- Membrane thickness = 0.26 mm
18- Membrane thermal conductivity = 0.3 W/m.K
19- Membrane thermal conductivity = 0.6 W/m.K
Figure 8. Mises stress distribution (contour) and total displacement (deformed shape plot, X200) in the
MEA for optimum design and operating conditions (Table 3)
ISSN 2076-2895 (Print), ISSN 2076-2909 (Online) ©2010 International Energy & Environment Foundation. All rights reserved.
396
International Journal of Energy and Environment (IJEE), Volume 1, Issue 3, 2010, pp.375-398
4. Conclusion
A full three-dimensional, multi-phase computational fluid dynamics model of a PEM fuel cell has been
developed to investigate the hygro-thermal stresses in PEM fuel cell, which developed during the cell
operation due to the changes of temperature and relative humidity. A unique feature of the present model
is to incorporate the effect of hygro and thermal stresses into actual three-dimensional fuel cell model.
The behaviour of the gas diffusion layers and membrane during operation of a unit cell has been studied
and investigated under real cell operating conditions. The results show that the non-uniform distribution
of stresses, caused by the temperature gradient in the cell, induces localized bending stresses, which can
contribute to delaminating between the membrane and the gas diffusion layers. These stresses may
explain the occurrence of cracks and pinholes in the membrane under steady–state loading during regular
cell operation. Parametric and optimization study using this model has been performed. The study
quantifies the impact of operating, design, and material parameters on fuel cell performance. The model
is shown to be able to: (1) understand the many interacting, complex electrochemical and transport
phenomena that cannot be studied experimentally; (2) identify limiting steps and components; and (3)
provide a computer-aided tool for design and optimization of future fuel cell with much higher power
density, long cell life, and lower cost. To achieve long cell life, the results show that the cell must be
operate at lower cell operating temperature, higher cell operating pressure, higher stoichiometric flow
ratio, and must have higher GDL porosity, higher GDL thermal conductivity, higher membrane thermal
conductivity, narrower gases channels, thicker gas diffusion layers, and thinner membrane.
In conclusion, the development of physically representative models that allow reliable simulation of the
processes under realistic conditions is essential to the development and optimization of fuel cells,
improve long-term performance and lifetime, the introduction of cheaper materials and fabrication
techniques, and the design and development of novel architectures.
References
[1] Zhang, S.; Yuan, X.; Wang, H.; Merida, W.; Zhu, H.; Shen, J.; Wu, S.; Zhang, J. A review of
accelerated stress tests of MEA durability in PEM fuel cells. Int. J. Hydrogen Energy, 2009; 34(1):
388-404.
[2] Wu, J.; Yuan, X.Z.; Martin, J.J.; Wang, H.; Zhang, J.; Shen, J.; Wu, S.; Merida, W. A review of
PEM fuel cell durability: Degradation mechanisms and mitigation strategies. J. Power Sources,
2008; 184(1): 104-119.
[3] Beuscher, U.; Cleghorn, S.J.C.; Johnson, W.B. Challenges for PEM fuel cell membranes. Int J
Energy Res 2005; 29(12): 1103-1112.
[4] Gode, P.; Ihonen, J.; Strandroth, A.; Ericson, H.; Lindbergh, G.; Paronen, M.; Sundholm, F.;
Sundholm, G.; Walsby, N. Membrane durability in a pem fuel cell studied using PVDF based
radiation grafted membranes fuel cells. Fuel Cells 2003; 3(1-2): 21-27.
[5] Crum, M.; Liu, W. Effective Testing Matrix for Studying Membrane Durability in PEM Fuel
Cells. Part 2. Mechanical Durability and Combined Mechanical and Chemical Durability, vol. 3.
Electrochemical Society Inc., Pennington, NJ 08534-2896, United States, Cancun, Mexico, 2006:
541–550.
[6] Marrony, M.; Barrera, R.; Quenet, S.; Ginocchio, S.; Montelatici, L.; Aslanides, A. Durability
study and lifetime prediction of baseline proton exchange membrane fuel cell under severe
operating conditions. J. Power Sources, 2008; 182(2): 469-475.
[7] Stanic V, Hoberech M. Mechanism of pin-hole formation in membrane electrode assemblies for
PEM fuel cells. Electrode Assemblies for PEM Fuel Cells, Electrochemical Society Inc.,
Pennington, NJ 08534-2896, United States, Honolulu, HI, United States, 2004; p. 1891.
[8] Ramaswamy, N.; Hakim, N.; Mukerjee, S. Degradation mechanism study of perfluorinated proton
exchange membrane under fuel cell operating conditions. Electrochimica Acta 2008; 53(8): 3279–
3295.
[9] Tang Y, Karlsson AM, Santare MH, Gilbert M, Cleghorn S, Johnson WB. An experimental
investigation of humidity and temperature effects on the mechanical properties of
perfluorosulfonic acid membrane. J Mater Sci Eng 2006; 425(1-2): 297-304.
[10] Xie J, Wood DL, Wayne DM, Zawodzinski T, Borup RL. Durability of polymer electrolyte fuel
cells at high humidity conditions. J Electrochem Soc 2005; 152(1): A104-A113.
[11] Kim, S.; Mench, M.M. Investigation of temperature-driven water transport in polymer electrolyte
fuel cell: phase-change-induced flow. J Electrochem Soc 2009; 156(3): B353-B362.
ISSN 2076-2895 (Print), ISSN 2076-2909 (Online) ©2010 International Energy & Environment Foundation. All rights reserved.
International Journal of Energy and Environment (IJEE), Volume 1, Issue 3, 2010, pp.375-398
397
[12] Kim, S.; Mench, M.M. Investigation of temperature-driven water transport in polymer electrolyte
fuel cell: Thermo-osmosis in membranes. J. Membrane Sci. 2009; 328(1-2): 113-120.
[13] Berning, T.; Lu, D.M.; Djilali, N. Three-dimensional computational analysis of transport
phenomena in a PEM fuel cell. J. Power Sources, 2002; 106(1-2): 284-294.
[14] Berning, T.; Djilali, N. Three-dimensional computational analysis of transport phenomenon in a
PEM fuel cell-a parametric study. J. Power Sources, 2003; 124(2): 440-452.
[15] Sivertsen, B.R.; Djilali, N. CFD based modelling of proton exchange membrane fuel cells. J.
Power Sources, 2005; 141(1): 65-78.
[16] Webber, A.; Newman, J.A. Theoretical study of membrane constraint in polymer-electrolyte fuel
cell. AIChE J., 2004; 50(12): 3215–3226.
[17] Tang, Y.; Santare, M.H.; Karlsson, A.M.; Cleghorn, S.; Johnson, W.B. Stresses in proton
exchange membranes due to hygro-thermal loading. J. Fuel Cell Sci.&Tech. ASME, 2006; 3(5):
119-124.
[18] Kusoglu, A; Karlsson, A.M.; Santare, M.H.; Cleghorn, S; Johnson, W.B. Mechanical response of
fuel cell membranes subjected to a hygro-thermal cycle. J. Power Sources, 2006; 161(2): 987-996.
[19] Kusoglu, A.; Karlsson, A.M., Santare, M.H.; Cleghorn, S.; Johnson, W.B. Mechanical behavior of
fuel cell membranes under humidity cycles and effect of swelling anisotropy on the fatigue
stresses. J. Power Sources, 2007; 170(2): 345-358.
[20] Solasi, R.; Zou, Y.; Huang, X.; Reifsnider, K.; Condit, D. On mechanical behavior and in-plane
modeling of constrained PEM fuel cell membranes subjected to hydration and temperature cycles.
J. Power Sources, 2007; 167(2): 366-377.
[21] Bograchev, D.; Gueguen, M.; Grandidier, J-C.; Martemianov, S. Stress and plastic deformation of
MEA in fuel cells stresses generated during cell assembly. J. Power Sources, 2008; 180(2): 393401.
[22] Suvorov, A.P.; Elter, J.; Staudt, R.; Hamm, R.; Tudryn, G.J.; Schadler, L.; Eisman, G. Stress
relaxation of PBI based membrane electrode assemblies. Int. J. Solids and Structures, 2008;
45(24): 5987-6000.
[23] Tang, Y.; Kusoglu, A.; Karlsson, A.M.; Santare, M.H.; Cleghorn, S.; Johnson, W.B. Mechanical
properties of a reinforced composite polymer electrolyte membrane and its simulated performance
in PEM fuel cells. J. Power Sources, 2008; 175(2): 817-825.
[24] Bograchev, D.; Gueguen, M.; Grandidier, J-C.; Martemianov, S. Stress and plastic deformation of
MEA in running fuel cell. Int. J. Hydrogen Energy, 2008; 33(20): 5703–5717.
[25] Al-Baghdadi, MARS.; Shahad, H. Effect of operating parameters on the hygro-thermal stresses in
proton exchange membranes of fuel cells. Int. J. Hydrogen Energy, 2007; 32(17): 4510-4522.
[26] Fuller, E.N.; Schettler, P.D.; Giddings, J.C. A new methode for prediction of binary gas-phase
diffusion coefficients. Ind. Eng. Chem., 1966; 58(5): 18-27.
[27] Berning, T.; Djilali, N. A 3D, multi-phase, multicomponent model of the cathode and anode of a
PEM fuel cell. J. Electrochem. Soc., 2003; 150(12): A1589-A1598.
[28] Nguyen, P.T.; Berning, T.; Djilali, N. Computational model of a PEM fuel cell with serpentine gas
flow channels. J. Power Sources, 2004; 130(1-2): 149-157.
[29] Al-Baghdadi, MARS.; Shahad, H. Optimization study of a PEM fuel cell performance using 3D
multi-phase computational fluid dynamics model. Journal of Zhejiang University SCIENCE-A
2007; 8(2): 285-300.
[30] Lampinen, M.J.; Fomino, M. Analysis of free energy and entropy changes for half-cell reactions. J.
Electrochem. Soc., 1993; 140(12): 3537–3546.
[31] Wang, L.; Husar, A.; Zhou, T.; Liu, H. A parametric study of PEM fuel cell performances. Int. J.
Hydrogen Energy, 2003; 28(11): 1263– 1272.
[32] Parthasarathy, A.; Srinivasan, S.; Appleby, J.A.; Martin, C.R. Pressure dependence of the oxygen
reduction reaction at the platinum microelectrode/nafion interface: electrode kinetics and mass
transport. J.Electrochem.Soc., 1992; 139(10): 2856–2862.
[33] Siegel, N.P.; Ellis, M.W.; Nelson, D.J.; von Spakovsky M.R. A two-dimensional computational
model of a PEMFC with liquid water transport. J. Power Sources, 2004; 128(2): 173–184.
[34] Hu, M.; Gu A.; Wang, M.; Zhu, X.; Yu, L. Three dimensional, two phase flow mathematical
model for PEM fuel cell. Part I. Model development. Energy Conversion Manage, 2004; 45(1112): 1861–1882.
ISSN 2076-2895 (Print), ISSN 2076-2909 (Online) ©2010 International Energy & Environment Foundation. All rights reserved.
398
International Journal of Energy and Environment (IJEE), Volume 1, Issue 3, 2010, pp.375-398
[35] Product Information, DuPont™ Nafion® PFSA Membranes N-112, NE-1135, N-115, N-117, NE1110 Perfluorosulfonic Acid Polymer. NAE101, 2005.
ISSN 2076-2895 (Print), ISSN 2076-2909 (Online) ©2010 International Energy & Environment Foundation. All rights reserved.