- Trang chủ >>
- Khoa Học Tự Nhiên >>
- Vật lý
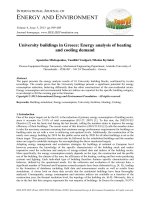
Evaluation of different weather files on energy analysis of buildings
Bạn đang xem bản rút gọn của tài liệu. Xem và tải ngay bản đầy đủ của tài liệu tại đây (468.89 KB, 14 trang )
INTERNATIONAL JOURNAL OF
ENERGY AND ENVIRONMENT
Volume 3, Issue 2, 2012 pp.195-208
Journal homepage: www.IJEE.IEEFoundation.org
Evaluation of different weather files on energy analysis of
buildings
Apostolos Michopoulos, Vassiliki Voulgari, Konstantinos Papakostas, Nikolas Kyriakis
Process Equipment Design Laboratory, Mechanical Engineering Department, Aristotle University of
Thessaloniki – POB 487 – 541 24 Thessaloniki – Greece.
Abstract
The building energy demand simulation tools consist the compass of the roadmap towards the energy
efficient building. Apart from the software itself, the result of the simulation strongly depends on the
degree the data used represent the actual situation, among which the climate data of the area are a key
factor. In this work, the energy demand of a large building complex is estimated, using the widely
accepted EnergyPlus building simulation software in combination with two, also widely accepted,
weather files. The simulation results for heating are compared with the actual fuel consumption of a
three-year operation period. The comparison reveals that the weather file and the size of the simulation
domain significantly affect the simulation representativeness.
Copyright © 2012 International Energy and Environment Foundation - All rights reserved.
Keywords: Building simulation; Energy consumption; Climate data; Weather files; Typical
meteorological years.
1. Introduction
The share of total final energy consumed by the household and service sectors in the European Union
(EU-27) was reduced from 42.5% in 1996 to 37.2% in 2008, while the corresponding figures for Greece
were 35.5% (1996) and 34.7% (2008) [1, 2]. Space heating and cooling are the major energy consumers
in buildings, accounting for about 63% to 70% (residential and tertiary sector, respectively) in Greece,
the remaining 37 to 30% being used for space illumination, appliances and electromechanical equipment
operation [3, 4].
Obviously, the energy consumption is directly related to both the operational cost of buildings and to
their negative effect on the environment. There is therefore a growing interest on the energy efficient
design, significantly intensified by the implementation of the European Directive 2002/91/EC [5] and the
recast of it, European Directive 2010/31/EC [6], concerning the energy performance of buildings. To this
direction, taking into account the aforementioned fact that the major energy consumers of a building are
the heating and cooling systems, the evaluation of the relevant energy demands becomes the first step
towards reducing the corresponding energy consumption. To this purpose, the long-term simulation of
the building and of its systems is required, with the dynamic simulation programs being the main tool for
the energy performance prediction [7-10]. A number of such tools has been developed over the last 20
years, used for both the design of new buildings and for the improvement of existing ones [11-14].
The building-specific data required for the prediction include details about: (1) construction (design and
materials), (2) design and control characteristics of the HVAC system and (3) usage patterns. These data,
ISSN 2076-2895 (Print), ISSN 2076-2909 (Online) ©2012 International Energy & Environment Foundation. All rights reserved.
196
International Journal of Energy and Environment (IJEE), Volume 3, Issue 2, 2012, pp.195-208
combined with detailed weather description, allow for energy demand estimation, the accuracy of which
obviously depends on both the quality of the data and on the sophistication of the simulation.
Of these data, those concerning the construction of the building and of the HVAC system are well
defined in existing constructions or they can be detailed in the design phase. The ones, however,
concerning the usage of the building, on which the estimation of internal loads depends on, and the
weather details, on which the external loads depend on, are less certain.
The influence of the internal loads uncertainty on the final result depends on the time scale of the
simulation and on the size of the simulation domain, since the increase of either or both results in
reducing the statistical error involved.
The effect the climate data have on the simulation result is rather obvious, since they affect not only the
energy losses estimation through the envelope [15, 16], in most cases being the major load, but also the
efficiency of RES based systems, e.g. solar thermal systems, which in many cases are installed in order
to cover building’s heating and cooling energy demands [17, 18].
This paper attempts to quantify the effect the simulation domain size and the climate data have on the
accuracy of the energy demands of a rather large complex of buildings. To this aim, the energy demands
of the buildings of the Aristotle University of Thessaloniki Campus were calculated and compared to the
actual fuel consumption for heating. The energy demands of the buildings were calculated with the aid of
the EnergyPlus software, using climate data from two different weather file databases.
2. Details of the simulation exercise
2.1 The university and the buildings
The Aristotle University of Thessaloniki is the largest in the Southeast Europe, with 42 Departments and
about 80,000 students. It is located at the city centre and the campus covers an area of 230,000 m2, with
36 buildings of 275,500 m2 covered area.
The older building was built in 1880 and the newer ones in 2003. As a result, all types of buildings are
found: from stone built to modern concrete ones, with various degrees of thermal insulation, single or
double glazing depending on the year of construction, and with or without shading elements. All the
buildings however have central heating installation, while cooling is provided mainly by split type local
air-to-air heat pumps.
Table 1. The heated area and the insulation category of building complexes
Group of Buildings
Kindergarten
Faculty of Education
Central Library
Administrative Building
Faculty of Veterinary Medicine
Faculty of Philosophy
Faculty of Engineering
Faculty of Natural Sciences
Chemistry Department
Meteorology Department
Faculty of Law, Economic and Political Sciences
Faculty of Medicine
Faculty of Dentistry
Observatory
Faculty of Theology
Total
Heated area [m2]
1,110
6,670
6,370
11,120
15,210
25,140
55,200
48,310
15,845
860
18,420
19,440
14,345
715
7,620
246,375
Insulation category
II
III
0.72/I – 0.28/III
I
0.75/I – 0.25/III
0.92/I – 0.08/III
0.57/I – 0.34/II – 0.09/III
0.61/I – 0.29/II – 0.10/III
I
I
I
0.80/I – 0.20/II
0.86/I – 0.14/III
I
0.87/I – 0.13/II
The thermal insulation characteristics strongly depend on the construction year of the building. Buildings
built before 1975 have no insulation at all, and for the purposes of this study they are characterized as
Category I. Buildings built between 1975 and 1990 are partially insulated, and they are characterized as
Category II. Finally, the newer buildings (construction year 1990 onwards) are insulated according to the
Greek Thermal Insulation Regulation and they are characterized as Category III. Based on this
ISSN 2076-2895 (Print), ISSN 2076-2909 (Online) ©2012 International Energy & Environment Foundation. All rights reserved.
International Journal of Energy and Environment (IJEE), Volume 3, Issue 2, 2012, pp.195-208
197
categorization, 66.3% of built area is Category I, 23.2% Category II and 10.5% Category III. For the
purposes of this study, the buildings of the campus are grouped, the grouping accounting for the
shadowing between buildings which affects the thermal gains. The groups of buildings identified are
listed in Table 1.
2.2 The parameters of the energy analysis
The campus buildings include offices, classrooms and auditoriums, laboratories, libraries, refreshment
rooms and other auxiliary spaces.
With the aid of in-situ inspection in every space, the internal heat sources (people, lights, appliances) and
ventilation habits were recorded, in order to reflect as accurately as possible the real conditions.
Following the ASHRAE suggestions [19, 20], the required temperature of each space was defined,
according to the space usage and the time of the year (heating or cooling period). The simulation
performed with 1 h time step and accounted for vacations and legislated holidays, considered as nonoperation periods of the facilities. The basic parameters of the simulation are listed in Table 2.
Table 2. Basic simulation parameters
Latitude / Longitude
Operating hours
Heating period
Desired indoor temperature during heating period (operating/non-operating
hours)
Cooling period
Desired indoor temperature during heating period (operating/non-operating
hours)
Air changes at Auditoriums, Classrooms, Laboratories, Refreshment rooms
(operating/non-operating hours)
Air changes at Offices, Libraries (operating/non-operating hours)
40° 36’ / 22° 59’
08:00 – 21:00
16 October – 15 May
22°C / 18°C
16 May – 15 October
26°C / 30°C
2 arch / 0.3 arch
1 arch / 0.3 arch
2.3 Description of the weather files
As already mentioned, climate data are required for energy simulation of buildings. Typically, these data
consist of 8760 (the hours of a year) sets of characteristic values, such as wet and dry bulb temperatures,
solar radiation, wind speed and direction etc., grouped in 12 typical months, finally forming the typical
year of the area. In order to derive the typical year of an area, long term actual climate data and/or
climate modelling results are statistically evaluated and weighted. A number of evaluation methodologies
and sets of weighing factors are reported [21-24]. As a result and for each area, a number of different
typical years can be found, such as the Typical Reference Year (TRY), the Weather Year for Energy
Calculations (WYEC, WYEC2), the Typical Meteorological Year (TMY, TMY2, TMY3) and the
International Weather for Energy Calculations (IWEC) [25]. Despite their differences, all these variations
constitute a set of 12 months that are representative of the past. As such, the typical year is unlikely to
include climate extremes and therefore it is suitable for the prediction of energy consumption but
unsuitable for sizing the HVAC systems [26].
For the purposes of this study the IWEC from ASHRAE (GRC - IWEC 166220 WMO) and the
METEONORM TMY2 (TMY-2 16622 WMO) were used.
For the development of IWEC [27] weather file, the nine climatic parameters selected are the maximum,
minimum and mean daily dry bulb and dew point temperature, the maximum and average daily wind
speed, and total daily solar radiation. The weighting factors are: 1/20 for the maximum and minimum
dry bulb temperature, 6/20 for the mean dry bulb temperature, 0.5/20 for the maximum and minimum
dew point temperature, 1/20 for the mean dew point temperature, 1/20 for the maximum and average
wind speed, and 8/20 for the total global solar radiation.
The TMY2 [28] weather file is based on the same parameters, with the addition of the direct normal solar
radiation, and the weighting factors are: 1/20 for the maximum and minimum dry bulb and dew point
temperature, 2/20 for the average dry bulb and dew point temperature, 1/20 for the maximum and
average wind speeds, and 5/20 for the average daily solar and direct normal radiation.
ISSN 2076-2895 (Print), ISSN 2076-2909 (Online) ©2012 International Energy & Environment Foundation. All rights reserved.
International Journal of Energy and Environment (IJEE), Volume 3, Issue 2, 2012, pp.195-208
198
3. Assessment of the weather files
The two weather files of the Thessaloniki used in this work are based on measurements of the Micra
Meteorological Station, situated at the Macedonia International Airport of Thessaloniki at a suburban
area, 14 km from the city centre.
The first of these weather files (GRC - IWEC 166220 WMO) has been produced by ASHRAE, IWEC
hereafter, in the framework of the 1015 research project for the development of International Weather
Year for Energy Calculation (IWEC) weather files [27] and it is available at the USA Department of
Energy (DOE) site.
The second weather file is from the METEONORM, version 5.0, database. It is a type 2 Typical
Meteorological Year (reference code TMY-2 16622 WMO), TMY-2 hereafter.
Despite the fact that both files are based on data from the same meteorological station, they are not
identical, due to the different weighing factors mentioned. Figure 1 presents the monthly variation of
minimum, maximum and average dry bulb temperatures resulting from the two weather files. The TMY2 weather file results in systematically higher mean temperatures, with the exceptions of January and
December, higher maximum temperatures, with the exception of May, and lower minimum temperatures,
with the exception of May and November.
40
Dry Bulb Air Temperature [°C]
35
IWEC
TMY-2
30
25
20
15
10
5
0
-5
-10
1
2
3
4
5
6
7
8
9
10
11
12
Month
Figure 1. The distribution of the air temperature based on the TMY-2 and IWEC weather files maximum, minimum and monthly average
Figure 2 shows the cumulative temperature distribution according to the two files. As it can be seen, at
temperatures below 9°C the frequency of lower temperatures is higher in the TMY-2 case. At
temperatures higher than 20°C the IWEC weather file shows higher frequency of higher temperatures,
while the frequency of mid-range temperatures (9-20°C) is more or less identical in both files.
These observations mean that the TMY-2 weather file suggests colder winter and probably hotter
summer, it is expected therefore that the energy consumption predictions of a building will be higher in
both winter and summer when they are based on TMY-2 weather file.
ISSN 2076-2895 (Print), ISSN 2076-2909 (Online) ©2012 International Energy & Environment Foundation. All rights reserved.
International Journal of Energy and Environment (IJEE), Volume 3, Issue 2, 2012, pp.195-208
199
9,000
TMY-2
IWEC
8,000
Hours of Occurance [h]
7,000
6,000
5,000
4,000
3,000
2,000
1,000
-5.0
0.0
5.0
10.0
15.0
20.0
25.0
30.0
35.0
Temperature [°C]
Figure 2. Cumulative distribution of the dry bulb temperature based on the TMY-2 and IWEC weather
files
In order to further investigate the differences between the two weather files, the heating and cooling
degree-days (HDD and CDD, respectively) for base temperatures 15°C, 18°C and 22°C, 24°C
respectively were determined. The results are shown in Figures 3-6.
350
1400
IWEC
TMY-2
Cumul. IWEC
Cumul. TMY-2
1200
250
1000
200
800
150
600
100
400
50
Cumulative Distribution of HDD
[Kdays]
Heating Degree Days [Kdays]
300
Base Temperature: 15°C
200
0
0
Oct
Nov
Dec
Jan
Feb
Mar
Apr
May
Month
Figure 3. Monthly and cumulative distribution of the HDD, based on the TMY-2 and IWEC weather
files. Base Temperature: 15°C
ISSN 2076-2895 (Print), ISSN 2076-2909 (Online) ©2012 International Energy & Environment Foundation. All rights reserved.
International Journal of Energy and Environment (IJEE), Volume 3, Issue 2, 2012, pp.195-208
450
1800
TMY-2
400
Heating Degree Days [Kdays]
2000
Base Temperature: 18°C
IWEC
Cumul. IWEC
350
1600
Cumul. TMY-2
1400
300
1200
250
1000
200
800
150
600
100
400
50
Cumulative Distribution of HDD
[Kdays]
200
200
0
0
Oct
Nov
Dec
Jan
Feb
Mar
Apr
May
Month
Figure 4. Monthly and cumulative distribution of the HDD, based on the TMY-2 and IWEC weather
files. Base Temperature: 18°C
450
160
400
350
120
300
100
250
80
200
60
150
40
100
20
50
0
Cumulative Distribution of CDD [Kdays]
Cooling Degree Days [Kdays]
140
Base Temperature: 22°C
IWEC
TMY-2
Cumul. IWEC
Cumul. TMY-2
0
Jun
Jul
Aug
Sep
Month
Figure 5. Monthly and cumulative distribution of the CDD, based on TMY-2 and IWEC weather files.
Base Temperature: 22°C
ISSN 2076-2895 (Print), ISSN 2076-2909 (Online) ©2012 International Energy & Environment Foundation. All rights reserved.
International Journal of Energy and Environment (IJEE), Volume 3, Issue 2, 2012, pp.195-208
120
300
Base Temperature: 24°C
IWEC
TMY-2
Cumul. IWEC
Cumul. TMY-2
250
80
200
60
150
40
100
20
50
0
Cumulative Distribution of CDD [Kdays]
Cooling Degree Days [Kdays]
100
201
0
Jun
Jul
Aug
Sep
Month
Figure 6. Monthly and cumulative distribution of the CDD, based on TMY-2 and IWEC weather files.
Base Temperature: 24°C
Figures 3 and 4 present the monthly and the cumulative distribution of heating degree-days for base
temperatures 15°C and 18°C respectively. The conclusion drawn from Figure 2 is confirmed: the TMY-2
weather file results in higher HDD values for the colder months (November to January) and similar
values for the months with intermediate temperatures (February and March) while the IWEC weather file
results in higher values for the hotter months (April, May and October).
The cumulative distribution of heating degree-days resulting from the TMY-2 weather file is always
higher than the one from the IWEC for both base temperatures, the difference being more enhanced at
lower base temperatures (base temperature 15°C: 1194 HDD from IWEC, 1257 HDD from TMY-2 – 5%
deviation; base temperature 18°C: 1790 HDD from IWEC, 1831 HDD from TMY-2 – 2.2% deviation).
This reduction of percentage deviation confirms the aforementioned overall colder climate of TMY-2.
Figures 5 and 6 present the monthly and cumulative distribution of cooling degree-days for 22°C and
24°C base temperatures according to the two weather files.
The cooling degree-days resulting from TMY-2 weather file for all months and both base temperatures
are always higher. As a result, the cumulative distribution is also always higher in the TMY-2 case, with
the sum of CDD being 346 for the IWEC weather file and 420 CDD for the TMY-2 (17.6% deviation) in
the 22°C base temperature case and 208 and 272 - deviation 23.6% - in the 24°C base temperature case.
This increase in percentage deviation confirms the aforementioned conclusion that the TMY-2 weather
file results in hotter summer.
4. Simulation results and discussion
Figure 7 presents the annual energy consumption of all building groups, as it resulted from the simulation
with both weather files. As it was expected, the adoption of TMY-2 weather file results in higher energy
demands for all building groups and both heating and cooling periods.
The higher energy consumption group of buildings is that of the Engineering School, followed by that of
the School of Natural Sciences and of Philosophy. This was expected, since these groups are the largest
ones in terms of temperature regulated area (see Table 1).
In order to eliminate the effect of the size of buildings, the energy consumption according to both climate
files, reduced to the respective temperature regulated area (kWh/m2/a), is calculated and presented in
Figure 8.
ISSN 2076-2895 (Print), ISSN 2076-2909 (Online) ©2012 International Energy & Environment Foundation. All rights reserved.
202
International Journal of Energy and Environment (IJEE), Volume 3, Issue 2, 2012, pp.195-208
Energy Consumption [MWh/a]
5,000
4,500
IWEC-Heating
4,000
IWEC-Cooling
TMY-2-Heating
3,500
TMY-2-Cooling
3,000
2,500
2,000
1,500
1,000
500
0
0
0
0
0
5
0
0
0
0
0
5
0
0
15
60
42
20
37
14
11
84
21
62
44
67
34
12
31
-7
-8
8,
6,
5,
5,
5,
7,
9,
1,
5,
4,
6,
1,
8,
y
y
-1
-5
-2
-1
-1
-1
-1
-1
-4
or
n
n
og
ry
gy
at
try
ry
ol
hy
tio
es
ng
ne
de
try
on
ra
i cs
lo
v
r
a
r
is
p
a
ti
ri
ib
i ci
tis
nc
in
er
m
eo
eo
ra
ga
om
so
uc
ee
lL
er
ed
en
bs
et
ci e
er
he
ist
in
Th
ilo
on
ra
et
Ed
D
M
O
g
M
C
in
nd
V
lS
nt
Ph
Ec
m
En ura
Ki
Ce
nd
t
Ad
a
Na
w
La
2
Block of Buildings - Heating/Cooling Area [m ]
140
IWEC-Heating
2
Energy Consumption [kWh/m /a]
Figure 7. Energy consumption of the buildings’ groups of the A.U.Th. on annual basis
120
IWEC-Cooling
TMY-2-Heating
TMY-2-Cooling
100
80
60
40
20
En
gi
N
ne
at
er
ur
in
al
g
Sc
-5
ie
5,
nc
20
es
Ph
0
-4
ilo
8,
so
31
ph
La
0
y
M
-2
w
ed
an
5,
ic
14
d
in
Ec
0
e
-1
on
9,
om
44
ic
0
s
C
-1
he
8,
m
42
is
try
0
Ve
-1
te
5,
rin
84
ar
5
y
D
-1
en
5,
Ad
tis
21
try
m
0
in
-1
is
tra
4,
34
tio
5
n
-1
Th
1,
eo
12
lo
0
gy
Ed
-7
uc
,6
C
at
20
en
io
tra
n
-6
lL
,6
ib
Ki
70
ra
nd
ry
er
-6
ga
,3
rd
70
en
M
et
-1
eo
,1
ro
10
lo
O
gy
bs
-8
er
va
60
to
ry
-7
15
0
2
Block of Buildings - Heating/Cooling Area [m ]
Figure 8. Energy Consumption per temperature regulated area of the buildings’ groups of the A.U.Th. on
annual basis
The highest heating specific energy consumption results for the Meteorology and Observatory buildings,
followed by the Education School, the Philosophy School and the Medicine School groups, with
significant differences however.
ISSN 2076-2895 (Print), ISSN 2076-2909 (Online) ©2012 International Energy & Environment Foundation. All rights reserved.
International Journal of Energy and Environment (IJEE), Volume 3, Issue 2, 2012, pp.195-208
203
The highest cooling specific energy consumption results for the Central Library, followed by the
Dentistry School and Theology School groups.
The observed differences in both heating and cooling specific energy consumptions are due to the
differences in construction and main orientation of the buildings as well as to the different usage profiles.
Summarizing the results of Figure 8 and for the IWEC weather file, the heating specific energy
consumption of University Campus building groups varies from 52 up to 113.2 kWh/m2/a, while for the
TMY-2 weather file from 60 to 123.5 kWh/m2/a.
The ranges for the cooling specific energy consumption are 10.5 – 64.3 kWh/m2/a and 12.4 – 65.7
kWh/m2/a, for the IWEC and TMY-2 weather files, respectively.
Based on the specific energy consumptions shown in Figure 8, a strong deviation between heating and
cooling periods is observed, with ratios as high as 11. This is attributed to the fact that the majority of the
University buildings is not in operation in the second half of July and in the first half of August, which is
the worst period from the energy consumption for cooling point of view. During winter, the holiday
period is significantly short; therefore it can’t strongly affect the heating specific energy consumption.
The simulation results based on the two weather files are compared in Figure 9. As it can be seen, the
results with the TMY-2 weather file in all but one case are higher, from 7.8% to 18.6% for heating and
from 0.5% to 18.5% for cooling.
A more detailed picture of the total energy demand for heating is given in Figure 10. As it can be seen,
the demand resulting with the TMY-2 weather file for the months November to March is always higher
than the one with the IWEC weather file. The comparison is inversed for October, April and May, with
the IWEC file resulting in higher energy consumption. It has to be noted however that these months are
the ones with the higher temperatures, therefore with the lower need for heating. Consequently the total
energy consumption according to the TMY-2 file results higher. This picture confirms the overall milder
character of the IWEC typical weather year, already expected from Figures 2-6.
Heating
Cooling
15%
10%
5%
0%
gi
ne
at
er
ur
in
al
g
Sc
-5
ie
5,
nc
20
es
Ph
0
-4
ilo
so
8,
31
ph
La
0
y
M
-2
w
ed
an
5,
ic
14
d
in
Ec
0
e
-1
on
9,
om
44
ic
0
s
C
-1
he
8,
m
42
is
try
0
Ve
-1
te
5,
rin
84
ar
5
y
D
-1
en
5,
Ad
tis
21
try
m
0
in
-1
is
tra
4,
34
tio
5
n
-1
Th
1,
eo
12
lo
0
gy
Ed
-7
uc
,6
C
at
20
en
io
tra
n
-6
lL
,6
ib
Ki
70
ra
nd
ry
er
-6
ga
,3
rd
70
en
M
et
-1
eo
,1
ro
10
lo
O
gy
bs
-8
er
va
60
to
ry
-7
15
Discrepancies between TMY-2 - IWEC
20%
N
En
-5%
2
Block of Buildings - Heating/Cooling Area [m ]
Figure 9. Discrepancies on energy consumption of the building groups using the TMY-2 and IWEC
weather files
ISSN 2076-2895 (Print), ISSN 2076-2909 (Online) ©2012 International Energy & Environment Foundation. All rights reserved.
204
International Journal of Energy and Environment (IJEE), Volume 3, Issue 2, 2012, pp.195-208
7,000
25,000
TMY-2
Heating Energy Demand [MWh]
6,000
Cumul. IWEC
20,000
Cumul. TMY-2
5,000
15,000
4,000
3,000
10,000
2,000
5,000
1,000
-
Cumulative Heating Energy Demand
[MWh]
IWEC
Oct
Nov
Dec
Jan
Feb
Mar
Apr
May
Month
Figure 10. Monthly and cumulative heating energy demand of the University Campus buildings using the
TMY-2 and IWEC weather files
The respective results of the cooling period are shown in Figure 11. The energy demand of the months
May, June and August results higher according to the TMY-2 weather file, while for July, September and
October the energy demands according to IWEC result higher. It is reminded at this point that, belonging
to an educational establishment, the majority of the buildings is not in operation during the second half of
July and the first half of August. Consequently, the resulting energy demand of these months, the hottest
during the cooling period, can be considered as typical only for the university buildings.
2,500
7,000
Cooling Energy Demand [MWh]
TMY-2
6,000
Cumul. IWEC
2,000
Cumul. TMY-2
5,000
1,500
4,000
3,000
1,000
2,000
500
1,000
-
Cumulative Cooling Energy Demand
[MWh]
IWEC
May
Jun
Jul
Aug
Sep
Oct
Month
Figure 11. Monthly and cumulative cooling energy demand of the University Campus buildings using the
TMY-2 and IWEC weather files
ISSN 2076-2895 (Print), ISSN 2076-2909 (Online) ©2012 International Energy & Environment Foundation. All rights reserved.
International Journal of Energy and Environment (IJEE), Volume 3, Issue 2, 2012, pp.195-208
205
Figure 12 summarizes the annual energy demand estimations for heating and cooling of all buildings of
the Aristotle University Campus. It can be clearly seen that the estimations based on the TMY-2 weather
file are higher by 11.1% and 3.8%, for heating and cooling respectively. Based on the CDD differences
presented in Figures 5-6, the discrepancy for the cooling period was expected higher, the result however
being justified considering the fact that the majority of the buildings is not in operation during the hottest
period (mid July to mid August) of the year.
25,000
12.0%
20,000
10.0%
8.0%
15,000
6.0%
10,000
3.8%
5,000
4.0%
Discrepancy [%]
Annual Energy Demand [MWh]
11.1%
IWEC
TMY-2
Discrepancy [%]
2.0%
0.0%
Heating
Cooling
Operating Period
Figure 12. Annual energy demand of the buildings groups using the TMY-2 and IWEC weather files
5. Comparisons with actual data and discussion
As already mentioned, all buildings have central heating installation, the required hot water being
produced by boilers. There are three natural gas fired boiler systems: one supplying the Engineering
School complex, one for the Education School and a central one, for all other buildings (district heating).
The above estimated heating energy demands can be translated in estimated natural gas consumption per
boiler system, using the appropriate overall annual average efficiency, accounting for both boiler
efficiency [29] and distribution system losses [30], and then be compared to the actual natural gas
consumption, determined from the relevant invoices. This comparison is shown in Figure 13, the actual
consumption being the annual three years average (2005-2007).
As it can be clearly seen, the fuel consumption estimation based on the TMY-2 weather file is always
significantly closer to the actual one. Taking into account the area being heated by each boiler system,
the deviation between estimated and actual fuel consumption as a fuction of the heated area can be
plotted (Figure 14).
Clearly, the fuel consumption is underestimated in all cases. The underestimation is significantly higher
in the IWEC weather file case, ranging from 12 to 24%, while in the TMY-2 case it ranges from 1 to
17%. It is of interest to note that the highest underestimation with both weather files results in the
smallest boiler system case, that of the Education School, which heats a total of only 6,670 m2. This
finding suggests that, apart from the climate data, the accuracy of estimation depends also on the size of
the building, which obviously affects the relative significance of the statistically estimated parameters,
namely the internal gains, which depend on the usage profile.
Based on the above, it can be concluded that the results of energy consumption simulations are strongly
affected by both the quality of the climate data used and the size of the simulation domain.
Unfortunately, due to the cooling system used in the vast majority of buildings (split-type local air-to-air
heat pumps) it was not possible to verify the cooling energy demand estimations.
ISSN 2076-2895 (Print), ISSN 2076-2909 (Online) ©2012 International Energy & Environment Foundation. All rights reserved.
International Journal of Energy and Environment (IJEE), Volume 3, Issue 2, 2012, pp.195-208
206
1.0E+07
3
NG Consumption [Nm ]
IWEC
TMY-2
MEASURED CONSUMPTION
1.0E+06
1.0E+05
1.0E+04
Education
Engineering
Central
Boiler System of the Buildings' Complex
AUTh
Figure 13. Total and per boiler system actual and estimated annual natural gas consumption for heating
Underestimation of fuel consumption [%]
24%
IWEC
TMY-2
22%
20%
18%
16%
14%
12%
10%
8%
6%
4%
2%
0%
0
50,000
100,000
150,000
200,000
250,000
2
Heating Area [m ]
Figure 14. Underestimation of fuel consumption as a function of the area served by the boiler system
6. Conclusion
A large scale simulation of heating and cooling energy demands estimation, concerning educational
buildings, is reported. The commercially available EnergyPlus software was used in combination with
the ASHRAE IWEC (GRC - IWEC 166220 WMO) and the METEONORM TMY2 (TMY-2 16622
WMO) weather files for Thessaloniki – Greece area.
The exercise showed that for the specific area (Thessaloniki) and the specific use of buildings
(educational establishment), the resulting energy consumption for both heating and cooling is lower with
the IWEC weather file.
The comparison of the results with the actual fuel consumption for heating showed that the estimations
based on the TMY-2 weather file is much closer to reality, with the underestimation depending on the
ISSN 2076-2895 (Print), ISSN 2076-2909 (Online) ©2012 International Energy & Environment Foundation. All rights reserved.
International Journal of Energy and Environment (IJEE), Volume 3, Issue 2, 2012, pp.195-208
207
size of the simulation domain, ranging from 1 to 17% - the highest value resulting for the smallest
building.
References
[1] Energy, transport and environmental indicators. Eurostat pocketbook, ISSN 1725-4566, 2010.
[2] Energy, transport and environmental indicators. Eurostat pocketbook, ISSN 1725-4566, 2008.
[3] Balaras C.A., Droutsa K., Argiriou A.A., Asimakopoulos D.N. Potential for energy conservation
in apartment buildings. Energy and Buildings 2000 31(1), 143-154.
[4] Balaras C.A., Gaglia A.G., Georgopoulou E., Mirasgedis S., Sarafidis Y., Lalas D.P. European
residential buildings and empirical assessment of the Hellenic building stick, energy consumption,
emissions and potential energy savings. Building and Environment 2007 42(3), 1298-1314.
[5] 2002/91/EC, Directive of the European Parliament and of the Council on the energy efficiency of
the building, 2002.
[6] 2010/31/EC, Directive of the European Parliament and of the Council on the energy efficiency of
the building (recast), 2010.
[7] Papadopoulos A.M., Oxizidis S., Papandritsas G. Energy, economic and environmental
performance of heating systems in Greek buildings. Energy and Buildings 2008 40(3), 224-230.
[8] Woloszyn M., Rode C. Tools for Performance Simulation of Heat, Air and Moisture Conditions of
Whole Buildings. Building Simulation 2008 1(1), 5-24.
[9] Magraner T., Montero A., Quilis S., Urchueguia J.F. Comparison between design and actual
energy performance of a HVAC-ground coupled heat pump system in cooling and heating
operation. Energy and Buildings 2010 42(9), 1394-1401.
[10] Zhu L., Hurt R., Correia D., Boehm R. Detailed energy saving performance analyses on thermal
mass walls demonstrated in a zero energy house. Energy and Buildings 2009 41(3), 303-310.
[11] Xia C., Zhu Y., Lin B. Building Simulation as Assistance in the Conceptual Design. Building
Simulation 2008 1(1), 46-52.
[12] Anastaselos D., Oxizidis S., Papadopoulos A.M. Energy, environmental and economic
optimization of thermal insulation solutions by means of an integrated decision support system.
Energy and Buildings 2011 43(2-3), 686-694.
[13] Djuric N., Novakovic V., Holst J., Mitrovic Z. Optimization of energy consumption in buildings
with hydronic heating systems considering thermal comfort by use of computer-based tools.
Energy and Buildings 2007 39(4), 471-477.
[14] Strand R.K., Baumgartner K.T. Modeling radiant heating and cooling systems: integration with a
whole-building simulation program. Energy and Buildings 2005 37(4), 389-397.
[15] Chow T.T., Chan A.L.S., Fong K.F., Lin Z. Some perceptions on typical weather year-from the
observations of Hong Kong and Macau. Solar Energy 2006 80(4), 459-467.
[16] Yang L., Lam J.C., Liu J., Tsang C.L. Building energy simulation using multi-years and typical
meteorological years in different climates. Energy Conversion and Management 2008 49(1), 113124.
[17] Tina G., Gagliano S. Probabilistic analysis of weather data for a hybrid solar/wind energy system.
International Journal of Energy Research 2011 35(3), 221-232.
[18] Diaf S., Notton G., Belhamel M., Haddadi M., Louche A. Design and techno-economical
optimization for hybrid PV/wind system under various meteorological conditions. Applied Energy
2008 85(10), 968-987.
[19] ASHRAE Standard 55-2004. Thermal Environmental Conditions for Human Occupancy,
American Society of Heating, Refrigerating and Air-Conditioning Engineers, Inc., Atlanta, USA,
2005.
[20] ASHRAE Handbook, HVAC Applications. American Society of Heating, Refrigerating and AirConditioning Engineers, Inc., Atlanta, USA, 2007.
[21] ΕΝ ΙSO 15927-4:2005. Hygrothermal performance of the buildings – Calculation and presentation
of climate data – Part 4: Hourly data for assessing the annual energy use for heating and cooling.
[22] Thevenard D.J., Brunger A.P. The development of typical meteorological weather years for
international locations: Part I, Algorithms. ASHRAE Transactions 2002 108(1), 376-383.
[23] Hall I.J., Prairie R.R., Anderson H.E., Boes E.C. Generation of a typical meteorological years for
26 SOLMET stations. Sandia Laboratories report, SAND 78-1601, Albuquerque, New Mexico,
USA, 1978.
ISSN 2076-2895 (Print), ISSN 2076-2909 (Online) ©2012 International Energy & Environment Foundation. All rights reserved.
208
International Journal of Energy and Environment (IJEE), Volume 3, Issue 2, 2012, pp.195-208
[24] Ebrahimpour A., Maerefat M. A method for generation of typical meteorological year. Energy
Conversion and Management 2010 51(3), 410-417.
[25] Su F., Huang J., Xu T., Zhang C. An evaluation of the effects of various parameter weights on
typical meteorological years used for building energy simulation. Building Simulation 2009 2(1),
19-28.
[26] ASHRAE Handbook, Fundamentals. American Society of Heating, Refrigerating and AirConditioning Engineers, Inc., Atlanta, USA, 2009.
[27] Thevenard D., Brunger A. Typical weather years for international locations, ASHRAE Research
Project 1015-RP Final Report, April 2001.
[28] Marion W., Urban K. User’s Manual for TMY2s. National Renewable Energy Laboratory, Golden
CO, USA, 1995.
[29] Technical Service of AUTh, Personal Communication, 2010.
[30] Technical Chamber of Greece, Energy Performance of Buildings Directive – Technical Guidelines
– T.O.T.E.E. 20701-1/2010 – Guidelines on the evaluation of the energy performance of buildings,
Athens, 2010 (in Greek).
Apostolos Michopoulos obtained his Diploma (M.Sc.) in Mechanical Engineering from the Aristotle
University of Thessaloniki (A.U.Th.) in 2003 and then conducted his Ph.D. research on Ground Source
Heat Pump Systems, which was completed in 2008. His research interests are focused on the study of
vertical ground heat exchangers and ground source heat pumps, energy systems analysis, and energy
efficiency of equipment and processes. He has 11 scientific journal publications in international
journals, 11 contributions in national and international conferences and 13 articles published in
specialized national technical magazines. Dr. Michopoulos has been elected as a Member of
American Society of Heating, Refrigerating, and Air-Conditioning Engineers (ASHRAE), and of the
European Technology Platform on Renewable Heating & Cooling, (RHC-Platform) on Geothermal Technology Panel. He is also
elected as a Junior Member of the International Institute of Refrigeration (IIR), and he is participating in many technical societies
and scientific institutes in Greece.
E-mail address:
Vasiliki Voulgari holds a Diploma (M.Sc.) in Mechanical Engineering from Aristotle University of
Thessaloniki (2007). She is a research assistant of the Process Equipment Design Laboratory. Her
research interests are focused on energy simulation of buildings and energy analysis of the
electromechanical systems. She has participated in a number of research projects during the last 4 years,
including “Heating and cooling loads estimation of the A.U.Th. campus buildings” and “Full scale A/C
system design for the teaching rooms of Engineering School, based on absorption units”. Mrs. Voulgari is
Member of the Technical Chamber of Greece, and Member of the Union of Mechanical and Electrical
Engineers of Northern Greece.
E-mail address:
Konstantinos Papakostas received the Mechanical Engineering Diploma in 1981 and the Ph.D in HVAC
Systems Energy Analysis in 2001, both from the Aristotle University of Thessaloniki, Greece. In 1982 he
joined the Mechanical Engineering Department of the Aristotle University of Thessaloniki where he is
currently Assistant Professor. He published numerous papers in National and International Scientific
Journals and has various presentations in National and International Conferences with published
proceedings. His main field of interest is the analysis of energy systems, the design of HVAC systems and
the energy conservation. Dr Papakostas is member of ASHRAE and member of the Greek Institute of
Solar Technology.
E-mail address:
Nikolas Kyriakis is the Director of the Process Equipment Design Laboratory and President of the
Mechanical Engineering Department – Aristotle University of Thessaloniki, Greece. He is also Chairman
of the Greek Institute of Solar Technology. His interests include energy systems analysis, thermal and
physical processes and equipment, internal combustion engines, utilization of renewable energy sources
and de-pollution systems and technology for industrial and mobile applications. He received his MSc in
Mechanical Engineering in 1977 and his PhD in 1985, both from the Mechanical Engineering Department
of the Aristotle University of Thessaloniki – Greece. Prof. Kyriakis has more than 80 publications in
international journals and congresses in the mentioned fields.
E-mail address:
ISSN 2076-2895 (Print), ISSN 2076-2909 (Online) ©2012 International Energy & Environment Foundation. All rights reserved.