- Trang chủ >>
- Khoa Học Tự Nhiên >>
- Vật lý
Increasing energy efficiency of HVAC systems of buildings using phase change material
Bạn đang xem bản rút gọn của tài liệu. Xem và tải ngay bản đầy đủ của tài liệu tại đây (1.47 MB, 20 trang )
INTERNATIONAL JOURNAL OF
ENERGY AND ENVIRONMENT
Volume 3, Issue 5, 2012 pp.667-686
Journal homepage: www.IJEE.IEEFoundation.org
Increasing energy efficiency of HVAC systems of buildings
using phase change material
Lee Chusak, Jared Daiber, Ramesh Agarwal
Department of Mechanical Engineering and Materials Science, Washington University in St. Louis, St.
Louis, MO 63130, USA.
Abstract
Using Computational Fluid Dynamics (CFD), four different cooling systems used in contemporary office
environments are modeled to compare energy consumption and thermal comfort levels. Incorporating
convection and radiation technologies, full-scale models of an office room compare energy efficiency of
(a) an all-air overhead system, (b) a combined all-air overhead and hydronic radiant system (chilled
ceiling), (c) an all-air raised floor system (displacement ventilation), and (d) a combined displacement
ventilation with a chilled ceiling. The computational domain for each model consists of one temperature
varying wall (simulating the temperature of the exterior wall of the building during a 24-hour period) and
adiabatic conditions for the remaining walls, floor, and ceiling (simulating interior walls of the room).
Two sets of computations are conducted. The first set considers a glass window and plastic shade
configuration for the exterior wall. The second set of computations includes a phase change material
layer between the glass window and the plastic shade. Results show substantial energy savings can be
accrued using the displacement ventilation and especially the displacement ventilation with a chilled
ceiling over the conventional overhead mixing ventilation system. The results also show that the addition
of a PCM layer to the exterior wall can significantly decrease the cooling energy requirements.
Copyright © 2012 International Energy and Environment Foundation - All rights reserved.
Keywords: Energy efficiency; HVAC systems; Phase change materials; Thermal comfort.
1. Introduction
1.1 Conventional variable-air-volume (VAV) ventilation
In general, buildings, especially modern designs, are tightly constructed with low leakage rates from
materials that provide high thermal insulation. In the simplest HVAC systems, where all-air overhead
ventilation relies on turbulent mixing of room air with ventilated air, the mechanical air-conditioning
must overcome the internal heat loads in a very direct way. The internal heat loads typically consist of
heat plumes created from occupants, lights, and office equipment (including electronic devices on
standby). The conventional office and industrial building design criteria for ventilation are based on the
need to remove this excess heat (and pollutants) rather than to provide adequate air for respiration. A
person requires about 7.5 liter/sec for respiration, while typical air changes needed for thermal comfort
require at least ten times this amount [1].
In addition, for the typical mixing system, initial construction costs are low and it requires little
maintenance; however, because of the large volume of air needed for heat exchange, this results in an
increase in space allocation in comparison to the alternative systems. This increased space requirement
ISSN 2076-2895 (Print), ISSN 2076-2909 (Online) ©2012 International Energy & Environment Foundation. All rights reserved.
668
International Journal of Energy and Environment (IJEE), Volume 3, Issue 5, 2012, pp.667-686
typically results in greater building envelope surface area, and an associated increase in envelope heating
and cooling loads. Given these factors, it is reasonable to assume that considerable inroads towards
energy efficiency can be made by modifying these traditional HVAC systems.
1.2 Displacement ventilation
A superior system is the displacement ventilation (DV) in which ventilated air is dispersed at low speeds
along the floor (or near the floor along the walls) and is warmed by internal heat sources (occupants,
lights, plug-in equipment) as it rises to the top, displacing the air already present. DV is more effective at
removing contaminants than conventional turbulent mixing ventilation, while permitting a smaller
airflow rate by a factor of two [2]. In addition, the supply air temperature for DV is significantly higher
for the same comfort conditions (about 18 oC versus about 13 oC in a conventional mixing ventilation
system), reducing the chilling load significantly. Depending on the regional climate, DV can reduce
energy use for cooling and ventilation by 30-60% [3, 4].
1.3 Displacement ventilation with radiant cooling
The radiant (hydronic) heating/cooling system provides even greater potential for energy efficiency.
Water is 25-100 times more effective than air at transferring heat energy. Thus, tremendous efficiency
gains can be made by decoupling the ventilation from the heating/cooling load. In general, this decoupled
system circulates chilled or hot water through the ceilings and walls of office buildings and the floors of
residential units for temperature control, while only distributing the volume of air required for
ventilation. This decoupled system allows for 100% of the ventilated air to be from the outside rather
than re-circulating a portion of the indoor air, thereby providing health benefits. For example, it is not
uncommon for conventional HVAC systems to recirculate up to 80% of the internal air on each circuit
and replace the remaining 20% with fresh air [5]. Also, further energy gains are achieved because the
internal heat plumes generated by occupants, lighting, and plug-in equipment (constituting up to 30% of
total cooling requirement [5]) are vented directly outside rather than partly re-circulated, as in a
conventional system. Using a decoupled system with constant ventilation can produce savings of 2030%. It should be noted that the required airflow – now decoupled from heating/cooling functions – can
be made to vary with changing building occupancy. A demand controlled ventilation (DCV) system uses
CO2 and/or other sensors to adjust the ventilation rate; this can reduce total HVAC energy by an
additional 20-30% when compared with fixed rate ventilation based on maximum occupancy [6].
In a chilled ceiling system, a large fraction of the ceiling is chilled by circulating cool water through
pipes or lightweight panels. In addition to the aforementioned increased effectiveness of water over air in
transporting heat, there is a reduced cooling load since typically water is supplied at 16-20 oC rather than
5-7 oC, as in conventional hydronic cooling systems. Not only does this reduction in cooling load allows
a higher chiller coefficient of performance (COP, or cooling power divided by fan power, a direct
measure of efficiency), but it also allows more frequent use of 'water-side free cooling', where the
mechanical chilling is bypassed altogether and supplied water for space cooling directly comes from
cooling tower. As an example, if chilled water is supplied at 18 oC, a cooling tower could provide the
cooling requirements 97% of the time in Dublin, Ireland, and 67% percent of the time in Milan, Italy [7].
In the case of conventional dehumidification systems with air-conditioning, dehumidification is
accomplished by overcooling the air so that sufficient water vapor is condensed, and then the air is
reheated to be supplied at a comfortable temperature. Dehumidification can be decoupled from cooling
through a variety of desiccant-based techniques, with energy use savings of 25-30%, or by up to 50% if
solar heat is used to regenerate the desiccant [8].
Lastly, perceived temperature depends on more than just air temperature and its velocity. Infrared
radiation from surrounding surfaces also plays a role, especially if there is significant radiant asymmetry.
Infrared radiation depends on the temperature and emissivities of the surfaces enclosing the occupied
space. As a result, radiant asymmetry happens when there is one surface, such as a window or exterior
wall, is much hotter than other surfaces, such as the interior walls. Likewise, humans emit infrared
radiation and if the emission of the surrounding surfaces and its subsequent absorption is greater than
that of the human, then the person will feel warm even if the air is cool. Therefore, in the case of radiant
cooling, the set points for temperature and humidity can be adjusted higher due to the perceived
temperature difference from traditional ventilation systems.
ISSN 2076-2895 (Print), ISSN 2076-2909 (Online) ©2012 International Energy & Environment Foundation. All rights reserved.
International Journal of Energy and Environment (IJEE), Volume 3, Issue 5, 2012, pp.667-686
669
1.4 Phase change material layers
The addition of a phase change material (PCM) into the external wall of a building has been shown to
reduce the amount of energy required to cool the building [9-15]. This is accomplished through the
melting and solidification of the PCM. During the day, the PCM melts absorbing energy that would
otherwise be transferred into the interior of the room. At night, the PCM freezes rejecting energy to both
the interior and exterior of the room.
2. Methodology
2.1 CFD solver
ANSYS - FLUENT [16] is a general-purpose CFD code, which solves the Unsteady Reynolds-averaged
Navier-Stokes (URANS) equations using the finite-volume method on a collocated grid. It can model
fluid flow and heat transfer in complex geometries using an interactive, menu-driven interface. It can
solve 2- and 3-D problems in steady and unsteady simulations. FLUENT has the capability to solve
incompressible and compressible flows using inviscid, laminar, and turbulent viscosity models. There is
a wide array of turbulence models available, including Spalart-Allmaras (S-A), k-ω, and k-ε (standard,
RNG, Realizable) models.
2.2 Flow field computations
The initial starting values of temperature, T0=288.16 K, and density, ρ0= 1.225 kg/m3, were employed.
Discrete-ordinate method for the radiation calculation was employed. The governing equations are
solved using the First-Order-Upwind scheme and the pressure is calculated using the PRESTO! scheme.
The SIMPLE algorithm was employed for the coupling of the velocity and pressure. The k-ε (RNG)
model, which uses two equations to calculate the eddy viscosity, was used in the first set of
computations. The S-A turbulence model was used in the PCM computations because it is a simpler oneequation model. The Boussinesq approximation was utilized to simulate the buoyancy effects. The
Boussinesq approximation takes the density to be a constant in all terms except in the buoyancy term of
the momentum equation.
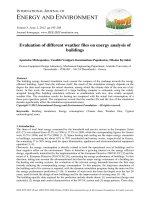
2.3 Temperature controller
The temperature controller was designed and coded into a Fluent function so that it maintained a band of
temperatures deemed comfortable, 72.4 F to 76.0 F (295.6 K to 297.6 K). The controller was setup such
that if the temperature reached the upper set point in the controller, the mass flow inlets would turn on
and drive the temperature down to the lower set point, at which the jets would turn off. Figure 1 shows
the behavior of the temperature controller as it cycles the mass flow inlets.
0.05
297
0.04
296.5
0.03
296
0.02
295.5
0.01
295
2000
2500
3000
3500
4000
4500
Mass Flow [kg/s]
0.06
297.5
Temperature [K]
298
0
5000
Time [s]
Control Temperature
Mass Flow
Figure 1. Temperature controller behavior
ISSN 2076-2895 (Print), ISSN 2076-2909 (Online) ©2012 International Energy & Environment Foundation. All rights reserved.
670
International Journal of Energy and Environment (IJEE), Volume 3, Issue 5, 2012, pp.667-686
Constant mass flux was specified across the mass flow inlets. The controller read the temperature 3" off
of the rear wall and halfway between the floor and ceiling, and the two side walls. This was done to
simulate realistic placement of the thermostat inside of the room.
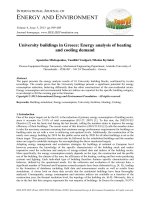
2.4 Exterior wall temperature wave form
Two external wall temperature wave forms were used in these simulations (Figure 2). For the first set of
computations (without PCM) an ASHRAE TETD curve [17] was coded into FLUENT.
320
Temperature [K]
315
310
305
300
295
0
5
10
15
20
Time [hr]
Figure 2. Hot wall temperature wave form
The second temperature wave form was utilized for the PCM calculations. It was created using the
ASHRAE SolAir calculation that approximates all the heat transfer from convection, conduction and
radiation on a surface of a building as an equivalent temperature. The SolAir temperature for Sioux Falls,
SD was used [17].
2.5 Exterior wall modeling
The exterior wall was modeled as traditional glazed window construction with a window shade. The
materials, layer thicknesses and properties are given in Table 1.
Table 1. Exterior wall section properties
Material
Insulated Glass
Air
Plastic Shade
Thickness [in]
1
1
1/32
Cp [J/kg-K]
840
1006.43
1670
ρ [kg/m3]
2500
1.225
905
k [W/m-K]
0.0405
0.0242
0.12
For the PCM simulations a PCM layers was added between the air and plastic shade in the external wall.
Table 2 shows the PCM thickness and properties.
Table 2. Phase change material (PCM) properties
Material
PCM 1 (Outlast 7815)*
Thickness [in]
1/32
Cp [J/kg-K]
1700
Hf [kJ]
74.1
k [W/m-K]
297-305.3
*commercial Trade Mark products
PCM 2 (Rubitherm RT 31)*
1/4
2400
150
304.2-306.2
ISSN 2076-2895 (Print), ISSN 2076-2909 (Online) ©2012 International Energy & Environment Foundation. All rights reserved.
International Journal of Energy and Environment (IJEE), Volume 3, Issue 5, 2012, pp.667-686
671
3. CFD simulations and results
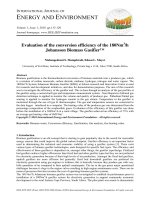
3.1 Pre-processing: Mesh generation
Case 1: Case 1 was created to simulate the conventional variable-air-volume (VAV) ventilation system.
A 3-D Cartesian mesh inside Case 1 was generated by GAMBIT [18], with a uniform grid of spacing of
3" (Figure 3). The exterior wall layers were meshed with each layer having three nodes across their
thickness.
Figure 3. Case 1 mesh: Top view and 3-D view
Despite the steep gradients near the walls, this spacing is sufficient to capture the flow field with
reasonable accuracy. This mesh has a cell count of 87,552 and a node count of 110,322.
Case 1's vent was sized based on HVAC requirements. The inlet and outlet dimensions of the vents are
9" × 36" (0.2286 m × 0.9144 m) spaced 12" (0.3048 m) off of the rear wall as shown in Figure 4, which
gives an area of 2.25 ft2 (0.2090 m2) for each vent.
Case 1 has a volume of 1,368 ft3 (38.74 m3). By meeting the guidelines of four air changes per hour [8],
this vent size gives a flow velocity of 40.54 ft/min (0.206 m/s).
Case 2: Case 2 was created to simulate the conventional variable-air-volume (VAV) ventilation system
with radiant cooling. Case 2's vents were of the same size and position as of Case 1. Case 2 has the
addition of the radiation slab, 6' × 6' × 6", which provides the chilled ceiling effect (Figure 5). The
radiation slab is placed 6" below the ceiling in the center of the room.
The Case 2 mesh varies slightly from the Case 1 mesh, since the radiation slab is included in Case 2.
Consequently the volume for Case 2 is also slightly smaller than Case 1 (Case 2 Volume = 1,350 ft3
(38.228 m3)). A 3-D Cartesian mesh inside Case 2 was generated by GAMBIT, with a uniform grid
spacing of 3" (Figure 6). The exterior wall layers were meshed with each layer having 3 nodes across
their thickness.
ISSN 2076-2895 (Print), ISSN 2076-2909 (Online) ©2012 International Energy & Environment Foundation. All rights reserved.
672
International Journal of Energy and Environment (IJEE), Volume 3, Issue 5, 2012, pp.667-686
Figure 4. Case 1 vent sizes
Figure 5. Case 2 vent sizes
Despite the steep gradients near the walls, this spacing is sufficient to capture the flow field with
reasonable accuracy. This mesh has a cell count of 97,344 and a node count of 109,793.
The discrete-ordinate radiation model was employed for heat transfer calculations due to radiation. This
adds another term qradiation to the total surface heat flux from a given surface. Fluent calculates the
values for qradiation and qconvection for the chilled ceiling. The radiation block is made of weathered
stainless steel with external emissivity of 0.85. The walls (hot wall and adiabatic walls) are gray and
diffuse and have an absorption coefficient of 0.85. The air has an absorption coefficient of 0.17 to
account for the water vapor [19]. Thus, radiation is transferred from the slab to the air and walls. Note
that after the radiation transfers heat to the walls, the portion of heat that is not absorbed is diffusely
reflected onto the air and to the other walls.
Case 3: Case 3 was created to simulate a displacement ventilation (DV) system. Figure 7 shows the
schematic of Case 3 with the two outlet vents in the ceiling and six inlet vents on the floor.
ISSN 2076-2895 (Print), ISSN 2076-2909 (Online) ©2012 International Energy & Environment Foundation. All rights reserved.
International Journal of Energy and Environment (IJEE), Volume 3, Issue 5, 2012, pp.667-686
673
Figure 6. Case 2 mesh, top view and 3-D view
Figure 7. Case 3 vent sizes on the ceiling and the floor
Case 3's inlet vents are designed to have the same total inlet vent area as Case 1 and 2. There are six inlet
vents on the floor. Hence, the Case 3 inlet vents are 6" × 9", which gives an area of 2.25 ft2 (0.209 m2)
for six vents (Figure 7). Since there is no change in the total inlet vent area compared to Case 1, Case 3
meets the ASHRAE guidelines of air movement in the room. The six inlet vents are placed on the floor
near the adiabatic walls. The outlet vent area of Case 3 is double the size of the outlet vent area of Case
1. Each outlet vent is of the size, 9" × 36" (0.2286 m × 0.9144 m) spaced 12", giving an area of 4.5 ft2
(0.418 m2)) for the 2 outlet vents in Case 3. Case 3 has a volume of 1,368 ft3 (38.74 m3).
A 3-D Cartesian mesh inside Case 3 was generated by GAMBIT, with a uniform grid spacing of 3"
(Figure 8). The exterior wall layers were meshed with each layer having three nodes across their
thickness.
ISSN 2076-2895 (Print), ISSN 2076-2909 (Online) ©2012 International Energy & Environment Foundation. All rights reserved.
674
International Journal of Energy and Environment (IJEE), Volume 3, Issue 5, 2012, pp.667-686
Figure 8. Case 3 mesh, 3-D view
This mesh has a cell count of 100,320 and a node count of 112,233.
Case 4: Case 4 was created to simulate a distributed ventilation system with radiant cooling. There are no
changes in the sizes or placement of the inlet or outlet vents from Case 3, so Case 4 meets the ASHRAE
guidelines of air movement in the room. Case 4 has the addition of a 6' × 6' × 6" radiation slab that
provides the chilled ceiling effect (Figure 9). The radiation slab is placed 6" below the ceiling in the
center of the room.
Figure 9. Case 4 geometry
Similar to Cases 1, 2 and 3, a 3-D Cartesian mesh inside Case 4 was generated by GAMBIT, with a
uniform grid spacing of 3" (Figure 10). The exterior wall layers were meshed with each layer having
three nodes across their thickness.
The Case 4 mesh varies slightly from Case 3, since the radiation slab is included in Case 4. Consequently
the volume for Case 4 is also slightly smaller than the other two cases (Case 4 Volume = 38.228 m3).
This mesh has a cell count of 99,120 and a node count of 111,681. The same radiation model as in Case
2 is utilized in Case 4. Figure 11 shows the interior view of the room with vents and radiation slab for
Case 4.
ISSN 2076-2895 (Print), ISSN 2076-2909 (Online) ©2012 International Energy & Environment Foundation. All rights reserved.
International Journal of Energy and Environment (IJEE), Volume 3, Issue 5, 2012, pp.667-686
675
Figure 10. Case 4 mesh, 3-D view
Figure 11. Case 4 interior view
3.2 Results
3.2.1 Cooling scheme comparisons
The simulations utilize a mass flow rate of 0.0528 kg/s, a flow temperature of 288.706 K (60 F) and a
time step of 10 seconds. Figure 12 shows the mass flow rate through the vents for the four ventilation
schemes.
Figure 13 shows the average volume temperature and the control point temperatures for the four cases.
The control point temperature and the average volume temperatures behave similarly; however, in the
cases with DV, the average volume temperature tends to be higher than the control point temperature,
while it tends to be the reverse in the VAV cases. This is most likely caused by the nature of the flow
field. While the average volume temperature and controller temperature do overshoot the desired peak
and minimum values for temperatures in the room, the performance of the controller is sufficient to yield
a reasonable comparison of the four ventilation systems. Figure 14 shows that by switching from the
ISSN 2076-2895 (Print), ISSN 2076-2909 (Online) ©2012 International Energy & Environment Foundation. All rights reserved.
676
International Journal of Energy and Environment (IJEE), Volume 3, Issue 5, 2012, pp.667-686
VAV system to a DV system, cool air requirements can be reduced by 26%. When a radiation slab is
added to the VAV system, cool air requirements are reduced by 28%. When a radiation slab is added to
the DV case, cool air requirements are reduced by 39% over the DV case and 56% over the VAV case.
Mass Flow Rate - VAV
0.06
Mass Flow Rate [kg/s]
0.05
0.04
0.03
0.02
0.01
0
0
1000
2000
3000
4000
5000
6000
7000
8000
6000
7000
8000
6000
7000
8000
Time Step [10s]
(a)
Mass Flow Rate - DV
0.06
Mass Flow Rate [kg/s]
0.05
0.04
0.03
0.02
0.01
0
0
1000
2000
3000
4000
5000
Time Step [10s]
(b)
Mass Flow Rate - VAV+Radiation Slab
0.06
Mass Flow Rate [kg/s]
0.05
0.04
0.03
0.02
0.01
0
0
1000
2000
3000
4000
5000
Time Step [10s]
(c)
Figure 12. Continued
ISSN 2076-2895 (Print), ISSN 2076-2909 (Online) ©2012 International Energy & Environment Foundation. All rights reserved.
International Journal of Energy and Environment (IJEE), Volume 3, Issue 5, 2012, pp.667-686
677
Mass Flow Rate - DV+Radiation Slab
0.06
Mass Flow Rate [kg/s]
0.05
0.04
0.03
0.02
0.01
0
0
1000
2000
3000
4000
5000
6000
7000
8000
Time Step [10s]
(d)
Figure 12. Mass flow rate through the vents for (a) Case 1, (b) Case 2, (c) Case 3 and (d) Case 4
VAV
298.5
298
297.5
Temperature [k]
297
296.5
296
295.5
295
294.5
294
0
1000
2000
3000
4000
5000
6000
7000
8000
7000
8000
Time Step [10s]
Controller Temperature
Average Volume Temperature
(a)
DV
298.5
298
Temperature [k]
297.5
297
296.5
296
295.5
295
294.5
0
1000
2000
3000
4000
5000
6000
Time Step [10s]
Controller Temperature
Average Volume Temperature
(b)
Figure 13. Continued
ISSN 2076-2895 (Print), ISSN 2076-2909 (Online) ©2012 International Energy & Environment Foundation. All rights reserved.
678
International Journal of Energy and Environment (IJEE), Volume 3, Issue 5, 2012, pp.667-686
VAV+Radiation Slab
298.5
298
297.5
Temperature [k]
297
296.5
296
295.5
295
294.5
294
0
1000
2000
3000
4000
5000
6000
7000
8000
7000
8000
Time Step [10s]
Controller Temperature
Average Volume Temperature
(c)
DV+Radiation Slab
299
298.5
298
Temperature [k]
297.5
297
296.5
296
295.5
295
294.5
0
1000
2000
3000
4000
5000
6000
Time Step [10s]
Controller Temperature
Average Volume Temperature
(d)
Figure 13. Average volume temperature and control point temperature for (a) Case 1, (b) Case 2, (c) Case
3 and (d) Case 4
Figure 14 shows that by switching from the VAV system to a DV system, cool air requirements can be
reduced by 26%. When a radiation slab is added to the VAV system, cool air requirements are reduced
by 28%. When a radiation slab is added to the DV case, cool air requirements are reduced by 39% over
the DV case and 56% over the VAV case.
3.2.2 Simulations with a PCM layer in the exterior wall
The simulations utilize a mass flow rate of 0.0528 kg/s, a flow temperature of 288.706 K (60 F) and a
time step of 10 seconds. The VAV and VAV with radiant cooling cases (Cases 1 and 2) were analyzed
using two different PCM layers whose properties are listed in Table 2. Figure 15 shows the mass flow
rate through the vents for the simulations.
ISSN 2076-2895 (Print), ISSN 2076-2909 (Online) ©2012 International Energy & Environment Foundation. All rights reserved.
International Journal of Energy and Environment (IJEE), Volume 3, Issue 5, 2012, pp.667-686
679
Total Inlet Mass Flow
1400
1200
Mass of Cool Air [kg]
1000
VAV
800
VAV + Radiation Slab
DV
600
DV+Radiation Slab
400
200
0
0
1000
2000
3000
4000
5000
6000
7000
8000
Time Step [10s]
Figure 14. Total mass of cold air input in Cases 1, 2, 3 and 4
Mass Flow Rate - VAV
0.06
Mass Flow Rate [kg/s]
0.05
0.04
0.03
0.02
0.01
0
0
1000
2000
3000
4000
5000
6000
7000
8000
6000
7000
8000
Time Step [10s]
(a)
Mass Flow Rate - VAV with PCM 1
0.06
Mass Flow Rate [kg/s]
0.05
0.04
0.03
0.02
0.01
0
0
1000
2000
3000
4000
5000
Time Step [10s]
(b)
Figure 15. Continued
ISSN 2076-2895 (Print), ISSN 2076-2909 (Online) ©2012 International Energy & Environment Foundation. All rights reserved.
680
International Journal of Energy and Environment (IJEE), Volume 3, Issue 5, 2012, pp.667-686
Mass Flow Rate - VAV with PCM 2
0.06
Mass Flow Rate [kg/s]
0.05
0.04
0.03
0.02
0.01
0
0
1000
2000
3000
4000
5000
6000
7000
8000
6000
7000
8000
7000
8000
Time Step [10s]
(c)
Mass Flow Rate - VAV+Radiation Slab
0.06
Mass Flow Rate [kg/s]
0.05
0.04
0.03
0.02
0.01
0
0
1000
2000
3000
4000
5000
Time Step [10s]
(d)
Mass Flow Rate - VAV+Radiation Slab with PCM 1
0.06
Mass Flow Rate [kg/s]
0.05
0.04
0.03
0.02
0.01
0
0
1000
2000
3000
4000
5000
6000
Time Step [10s]
(e)
Figure 15. Mass flow rate through the vents for Cases 1 and 2 with the two types of PCM layer
Figure 16 shows the average volume temperature and control point temperature for Cases 1 and 2 with
two types of PCM layers.
ISSN 2076-2895 (Print), ISSN 2076-2909 (Online) ©2012 International Energy & Environment Foundation. All rights reserved.
International Journal of Energy and Environment (IJEE), Volume 3, Issue 5, 2012, pp.667-686
681
VAV
298
297.5
Temperature [k]
297
296.5
296
295.5
295
0
1000
2000
3000
4000
5000
6000
7000
8000
7000
8000
7000
8000
Time Step [10s]
Controller Temperature
Average Volume Temperature
(a)
VAV with PCM 1
298
297.5
Temperature [k]
297
296.5
296
295.5
295
0
1000
2000
3000
4000
5000
6000
Time Step [10s]
Controller Temperature
Average Volume Temperature
(b)
VAV with PCM 2
298
297.5
Tem perature [k]
297
296.5
296
295.5
295
0
1000
2000
3000
4000
5000
6000
Time Step [10s]
Controller Temperature
Average Volume Temperature
(c)
Figure 16. Continued
ISSN 2076-2895 (Print), ISSN 2076-2909 (Online) ©2012 International Energy & Environment Foundation. All rights reserved.
International Journal of Energy and Environment (IJEE), Volume 3, Issue 5, 2012, pp.667-686
682
VAV+Radiation Slab
298
297.5
Tem perature [k]
297
296.5
296
295.5
295
0
1000
2000
3000
4000
5000
6000
7000
8000
7000
8000
Time Step [10s]
Controller Temperature
Average Volume Temperature
(d)
VAV+Radiation Slab with PCM 1
298
297.5
Tem perature [k]
297
296.5
296
295.5
295
0
1000
2000
3000
4000
5000
6000
Time Step [10s]
Controller Temperature
Average Volume Temperature
(e)
Figure 16. Average volume temperature and control point temperature for Cases 1 and 2 with the two
types of PCM layers
Figure 17 shows the PCM 1 layer having a minimal effect on the amount of cool air entering the room
for the VAV case. There is a 4% reduction in cool air requirements for the VAV + Radiation Slab case.
If PCM 2 is used, 42 % less cool air is required in the VAV case.
In order to calculate the energy being removed from various Cases by the jet, we must numerically
integrate:
∫ m *C
p
* (T jet − TRoom − average )dt
(1)
The radiation slab's energy was calculated by numerically integrating:
∫ flux * area * dt
(2)
ISSN 2076-2895 (Print), ISSN 2076-2909 (Online) ©2012 International Energy & Environment Foundation. All rights reserved.
International Journal of Energy and Environment (IJEE), Volume 3, Issue 5, 2012, pp.667-686
683
where flux refers to the total surface heat flux measured on the radiation slab's surfaces and area is the
total surface area of the radiation slab.
The total energy removed from the cases with a radiation slab is the sum of the flow energy and radiation
slab energy.
Total Inlet Mass Flow
800
700
Mass of Cool Air [kg]
600
500
VAV
VAV + PCM 1
400
VAV + Radiation Slab
VAV + Radiation Slab + PCM 1
VAV + PCM 2
300
200
100
0
0
1000
2000
3000
4000
5000
6000
7000
8000
Time Step [10s]
Figure 17. Total mass of cold air input in the rooms for Cases 1 and 2 with the two types of PCM layer
Figure 18 also shows that PCM 1 has a minimal effect on the amount of energy being removed from the
room by the flow and the radiation slab in the VAV case. There is a 3.2% reduction in energy removed
with PCM 1 in the VAV + Radiation Slab case. PCM 2 again shows a significant reduction (43%) in
energy being removed from the room while the temperature controller maintained thermal comfort.
Total Energy Removed
0
0
1000
2000
3000
4000
5000
6000
7000
8000
-1000
Energy [kJ]
-2000
VAV
-3000
VAV + PCM 1
VAV with Radiation Slab
VAV with Radiation Slab + PCM 1
-4000
VAV + PCM 2
-5000
-6000
-7000
Time Step [10s]
Figure 18. Total energy removed by the slab and the flow
ISSN 2076-2895 (Print), ISSN 2076-2909 (Online) ©2012 International Energy & Environment Foundation. All rights reserved.
684
International Journal of Energy and Environment (IJEE), Volume 3, Issue 5, 2012, pp.667-686
4. Conclusion
1. The air conditioning energy needs can be reduced through the use of distributed ventilation and chilled
ceilings. Assuming the energy requirements for a cooling tower are small in comparison to that for an air
conditioning unit with similar capacity, the energy savings should be roughly proportional to the
reduction in chilled air being supplied to each room. For the cases analyzed in this paper, there could be a
28% reduction in energy if there was a radiant cooler added to the traditional VAV system, a 26%
reduction if a displacement ventilation system was used over the traditional VAV system and a 56%
reduction in energy if a displacement ventilation system with a chilled ceiling was used over the
traditional VAV system.
2. Full CFD analysis of each room is required because the manner in which the air enters and exits each
room creates distinct flow fields whose behavior determines the efficiency of each ventilation system.
For example, the DV system introduces cold air on the floor of the room at low velocities. Temperature
stratification is allowed to develop so that the hot air exits the room through the air outlets. The VAV
system does not allow the stratification to take place due to the duct placement and higher air velocity;
thus, the outlet air temperature is lower.
3. If the PCM is selected properly, significant energy savings can be achieved. The PCM must melt and
freeze during the course of a day to realize any energy savings.
References
[1] Linden P. F., The Fluid Mechanics of Natural Ventilation. Annual Review of Fluid Mechanics
1999, 31, 291-338.
[2] Ürge-Vorsatz D., Harvey L.D, Mirasgedis S., Levine M. D., Mitigating CO2 Emissions from
Energy Use in the World's Buildings. Building Research and Information 2007, 35, 379-398.
[3] Bourassa N., Haves P., Huang J., A Computer Simulation Appraisal of Non-Residential Low
Energy Cooling Systems in California. American Council for Energy Efficient Economy,
Washington, DC, 2002, 41–53.
[4] Howe M., Holland D., Livchak A., Displacement Ventilation-Smart Way to Deal with Increased
Heat Gains in the Telecommunication Equipment Room. ASHRAE Transactions 2003, 109, 323–
327.
[5] Harvey L. D., Reducing Energy Use in Buildings Sector: Measures, Costs, and Examples. Energy
Efficiency 2009, 2, 139-163.
[6] Brandemuehl M. J., Braun J. E., The Impact of Demand-Controlled and Economizer Ventilation
Strategies on Energy Use in Buildings. ASHRAE Transactions 1999, 105, 39–50.
[7] Costelloe B., Finn D., Indirect Evaporative Cooling Potential in Air–Water Systems in Temperate
Climates. Energy and Buildings 2003, 35, 573–591.
[8] Harvey L.D.D., Handbook on Low-Energy Buildings and District-Energy Systems: Fundamentals,
Techniques and Examples. Earthscan, London, 2006.
[9] Salyer I. O., Sircar A. K., A Review of Phase Change Materials Research for Thermal Energy
Storage in Heating and Cooling Applications at the University of Dayton from 1982 to 1986.
International Journal of Global Energy 1997, 9, 183-198.
[10] Frank B., Using Phase Change Material (PCMs) for Space Heating and Cooling in Buildings.
Proceedings of AIRAH Performance Enhanced Buildings Environmentally Sustainable Design
Conference, 2004.
[11] Ravikumar M., Srinivasan P. S. S., Phase Change Material as a Thermal Energy Storage Material
for Cooling of Buildings. Journal of Theoretical and Applied Information Technology 2008, 4,
503-511.
[12] Tyagi V. V., Buddhi D., PCM Thermal Storage in Buildings. Renewable and Sustainable Energy
Reviews 2007, 11, 1146-1166.
[13] Khudhair A. M., Farid M.M., A Review on Energy Conservation in Buildings: Application with
Thermal Storage by Latent Heat Using Phase Change Materials. Energy Conversion and
Management 2004, 45, 263-275.
[14] Richardson M.J., Woods A.W., An Analysis of Phase Change Material as Thermal Mass.
Proceedings of Royal Society A: Mathematical, Physical and Engineering Sciences 2008, 464,
1029-1056.
ISSN 2076-2895 (Print), ISSN 2076-2909 (Online) ©2012 International Energy & Environment Foundation. All rights reserved.
International Journal of Energy and Environment (IJEE), Volume 3, Issue 5, 2012, pp.667-686
685
[15] Muruganantham K., Phelan P., Horwath P., Ludlam D., McDonald T., Experimental Investigation
of a Bio-Based Phase Change Material to Improve Building Energy Performance. Proceedings of
the ASME 2010 4th International Conference on Energy Sustainability, 2010.
[16] Ansys Inc., FLUENT 6.3: Flow Modeling Software, 2007.
[17] Howell R. H., Saur H. J., Coad W. J., Principles of Heating, Ventilation and air Conditioning.
American Society of Heating, Ventilation and Air-Conditioning, New York, 1998.
[18] Ansys Inc., GAMBIT 6.2: Geometry and Grid Generation Pre-Processor, 2007.
[19] Donnelly P., Becker R., Dedorko D., PCM Membranes in Architectural Enclosures. Proceedings
of the Washington University McDonnell Academy Global Energy and Environment Partnership,
2008, 130-138.
Lee Chusak received the M.S degree in mechanical engineering from Washington University in St.
Louis, MO, USA in 2009. His research interests are in the application of computational fluid dynamics
to study the HVAC systems and energy efficiency of buildings. He is currently working as a CFD
applications specialist at MEMC Electronic Materials, Inc., 501 Pearl Drive, St. Peters, MO 63376,
USA.
Email address:
Jared Daiber received the M.S degree in mechanical engineering from Washington University in St.
Louis, MO, USA in 2011. His research interests are in the application of computational fluid dynamics
to study the HVAC systems and energy efficiency of buildings. He is currently working as a
Maintenance Reliability Manager at Anheuser-Busch, 1 Busch Place, St. Louis, MO 63118, USA.
Email address:
Ramesh Agarwal received the Ph.D degree in aeronautical sciences from Stanford University, Palo
Alto, CA, USA in 1975. His research interests are in the theory and applications of computational fluid
dynamics to study the fluid flow problems in aerospace and renewable energy systems. He is currently
the William Palm Professor of Engineering in department of Mechanical Engineering and Materials
Science at Washington University in St. Louis, MO, USA. He is a Fellow of ASME, AIAA, IEEE, and
SAE.
Email address:
ISSN 2076-2895 (Print), ISSN 2076-2909 (Online) ©2012 International Energy & Environment Foundation. All rights reserved.
686
International Journal of Energy and Environment (IJEE), Volume 3, Issue 5, 2012, pp.667-686
ISSN 2076-2895 (Print), ISSN 2076-2909 (Online) ©2012 International Energy & Environment Foundation. All rights reserved.