Báo cáo thực hành sản phẩm sữa
Bạn đang xem bản rút gọn của tài liệu. Xem và tải ngay bản đầy đủ của tài liệu tại đây (634.53 KB, 15 trang )
University of Agriculture and Forestry
Faculty of Food Science and Technology
MILK AND DAIRY PRODUCTS
LABORATORY REPORT
Name: Nguyễn Thị Thanh Hằng
Experiment 1: Freshness/ raw milk quality
1.1
Measurement of density
a.
Objective
The purpose of the first experiment are measure the density and identify 3
samples: normal raw milk, skimmed milk and water-added milk.
b.
Materials and Methods
Apparatus and reagents
- Milk: normal milk, skimmed milk and water-added milk.
- Lactometer used for measuring the density.
Method: Put the lactometer into the flask, which contain milk inside, to measure
the density. Part of lactometer rises on the surface. Record the value.
c.
Results
Table 1. The density value of 3 milk samples
Sample
Density (Kg/ m3)
Conclusion
1
1025
Water-added milk
2
1040
Normal raw milk
3
1050
Skimmed milk
d.
Discussion
- The density of milk depends on temperature. The higher the temperature is, the
more liquid expenses, the lower the density is.
- Density also depends on composition of milk:
• Fat content decrease density
• Solubilized components increase density, so Dskimmed milk > Dwhole milk
• Addition of water leads to the decreasing of milk density.
e.
Conclusion
- The identification of various types of milk can be considered based on its
density value.
- The density of milk can be measured by using a lactometer. The standard
temperature for the measurement is normally 20 ⁰C. However, this experiment
was conducted at room temperature and because of some human mistake
during value recording step, the results maybe not entirely accurate.
1.2
Acidity
a. Objective
This experiment was conducted to measure the acid value of milk as well as to
evaluate milk quality based on this value
b.
Materials and Methods
Apparatus and reagents
- pH meter
- Burret
- Pipet 10 mL
- Beaker 25 mL
1.2.1
1.2.2
-
-
Bottle of distilled water
Erlen 50 or 100 mL
NaOH 0.1 N solution
Phenolphthalein sulution
Method
Procedure for pH reading
Put several mL of the sample into the beaker
Calibrate the pH meter before use. Read pH with the pH meter (pay
attention to the sample temperature).
Procedure for titration
Pipet 10 mL of the sample into the Erlen, add 10 mL of distilled water and 2
drops of phenolphthalein solution (indicator)
Titrate the content with NaOH 0.1 N to the appearance of pink color which
remains for about 10 seconds
Calculate into Dornic degree using the following conversion
1° Dornic is equal to 0.1ml of NaOH 1/9N necessary to neutralize 10 mL of
sample
c.
Results
Table 2. pH result, volume of titrated NaOH (mL) and Dornic degree of milk samples
Sample
pH
Volume of titrated
NaOH (mL)
Dornic degree
1
6.1
2.6
23.4
2
6.28
2.3
20.7
3
6.25
2.3
20.7
4
6.29
2.3
20.7
5
6.43
2.2
19.8
6
d.
e.
1.3
6.4
2.2
19.8
Discussion
- Acidity is an important parameter to indicate the quality of milk as well as
fermentation process. Normal milk often has pH of 6.6 to 6.8 and is the result
of dry matter, not lactic acid
Conclusion
- In conclusion, this is a quantitative method used to evaluate the quality of milk.
- The result cannot be exactly due to mistake from equipment (burret for
titration) as well as human during conducting the experiment.
Alcohol test
a. Objective
This experiment was conducted to evaluate the freshness of milk by observing
its coagulation when adding alcohol.
b.
c.
Materials and Methods
Apparatus and reagents
- Test tubes (e.g, 150 mm length x 16 mm diameter)
- Test tube rack
- 68% alcohol solution (68% of 96% alcohol + 28% of distilled water)
Method
Single test
1. Bring equal volumes of milk and 68% alcohol (2 mL each) into a test tube
2. Invert the test tube several times which the thumb held tightly over the
open end of the tube
3. Examine the tube to determine whether the milk has coagulated. If it has,
fine particles of curd will be visible.
Double test
1. Bring 1 volume of milk and 2 volumes of 68% alcohol into a test tube.
2. Proceed and examine similarity.
Results
Table 3. Phenomenon results of Alcohol test
Sample
Single test
Double test
1
Precipitation occurs
2
Precipitation occurs
3
No Precipitation
4
No Precipitation
5
No Precipitation
Precipitation appear but less
than single test experiment
Precipitation appear but less
than single test experiment
No Precipitation
6
1.4
No Precipitation
Precipitation occurs
d.
Discussion
- Milk that contains more than 0.21% lactic acid, or calcium and magnesium
compounds in greater than normal amounts, will precipitate when alcohol is
added.
- In case of this experiment, when alcohol was added, the two samples (1 and 2),
did not coagulate when alcohol is added. It shows negative alcohol test or both
of samples had good quality.
e.
Conclusion
- Milk quality can be tested by using alcohol test, especially for determining the
sour milk.
- When using this test, the observer should differentiate the bubbles and curd
particle so that the result in this test can be obtained exactly.
Clot-on-boiling and CaCl2 20% test
a. Objective
The clot-on-boiling test is used to determine whether milk is suitable for
processing, as it indicates whether milk is likely to coagulate during processing
(usually pasteurisation).
b.
Materials and Methods
Apparatus
- One boiling water bath (a 60 mL beaker on a gas or electric heater is adequate)
- Test tubes
- Timer (a watch or clock is adequate)
Method
- Place about 5 ml of milk in a test tube (the exact amount is not critical) and
place the test tube in boiling water for 5 minutes.
- Carefully remove the test tube and examine for precipitate. The milk is
rejected if any curd forms.
- Place 2 drops of CaCl2 in each test tube
c. Results
-
All samples give precipitate.
Milk in sample 1 and 2 showed with visible fine particles of curd around
the test tube when heating.
With milk in the three sample (3,4,5 and 6), there was a lot of precipitate
when heating so it not suitable for processing due to poor quality.
d. Discussion
- The experiment is based on the acidity of milk.
-
When milk is stored for a long time at ambient temperature, the increased
acidity will reduce the heat stability of milk caused by fermentation or growth
of bacteria. Heating will precipitate protein if milk is sour. Therefore, that milk
cannot be used.
e. Conclusion
Beside the other testing methods, clot-on-boiling test is one type of test that
used to check the milk quality, especially the heat stability of milk during storing
in long time
- Results cannot be accurate due to human error and long execution time while
conducting experiments.
1.5
The methylene blue reduction test
a.
Objective
This experiment was carried out to determine the length of time milk takes to
decolourise methylene blue is a good measure of its bacterial content and hence of
its hygienic quality.
b.
Materials and Methods
Apparatus and reagents
- A water bath at 37 – 38⁰C
- Test tubes graduated at the 10 mL mark.
- A supply of 1 mL pipettes (bacteriological type)
- A thermometer, 0 - 100⁰C graduated at 0.5⁰C intervals
- A supply of sterilised rubber stoppers for closing the tubes when the samples
have been put into them. These can be conveniently sterilised before use by
immersing in boiling water for 10 minutes
- A methylene blue solution made up from standard methylene blue milk testing
tablets which are available commercially.
- Test-tube racks
Method
When the test is used to grade suppliers’ milk the samples are taken in the milk
reception area.
1. Mix the supplier’s milk thoroughly.
2. Take the sample with a clean, sterile dipper and fill the test tube to the 10 mL
mark.
3. Stopper the test tube with a sterile rubber stopper and mark the milk supplier’s
number on the tube.
4. Place the test tube in the test tube rack.
5. When sufficient samples to fill the test tube rack have been collected, add 1 ml
of the methylene blue solution to each test tube. Replace the rubber stopper
with aseptic precautions.
6. Invert each tube twice, to mix the milk and solution thoroughly, and place the
tubes in the water bath at a temperature of 37 - 38⁰C.
7. Make a note of the time at which the tubes are put into the water bath.
8. Examine the samples after 30 minutes, note the numbers of decolourised
samples and remove them from the bath. Do not disturb partly decolourised
tubes. Invert all other tubes.
9. At half-hourly intervals examine again for decolourised samples and repeat as
above
Control tubes
Include two control tubes with each batch consisting of:
• 10 mLof mixed milk plus 1 ml of methylene blue solution.
• 10 mL of mixed milk plus 1 ml of water.
Immerse both tubes in boiling water for 3 minutes to destroy the natural reduction
action of the milk.
Table 4. Standard time for evaluating milk quailty
Time taken to
Grade
decolorized milk
< 30 min
Very bad
30 min - 1h
Bad
1 - 2h
Poor
2 - 4.5h
Fair
> 4.5 h
Good
c.
Results
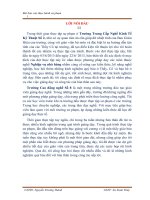
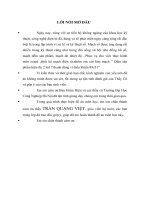
10h05’
13h20’
Figure 1 & 2. Color changes during incubation time
d.
Discussion
- The time for blue color of methylene solution to disappear is related to amount
of microorganisms in milk.
- In this experiment, milk takes more than 3 hours to decolorize blue color of
methylene and this indicate the low amout of microorganism in milk.
- The length of time milk takes to decolorize methylene blue is a good measure
of its bacterial content and hence of its hygienic quality. The time is governed
by the activity of reducing bacterial present in milk and the oxygen content.
When oxygen has been used the methylene blue is reduced, changing in color
from blue to white.
-
e.
The temperature of incubation tank can cause error to this experiment. If the
temperature is too high, it can destroy all the bacteria and then the milk will
not decolorize methylene blue.
Conclusion
- This experiment can test the stability of milk but takes time.
- Incubation tank should be check carefully to ensure the result of this
experiment
- Results cannot be accurate due to human error and long execution time while
conducting experiments.
Experiment 2: Fermented milks: yogurt
a.
Objective
This experiment was conducted to know how to make two types of yogurt, namely set
yogurt and stirred yogurt. Yogurt products were made from different recipes and than
were evaluated by sensory test
b.
Materials and methods
Apparatus and reagents
- Raw milk
- UTH –full fat milk
- Skim milk powder
- Starter culture (thermophilic bacteria)
Method
Yogurt was made by following the procedure below
Milk
Standardize
Homogenize
15 - 35 MPa, 50⁰C
Heat
15 min at 90⁰C
Cool down
To 43⁰C
Innoculate
Pour into pots
Incubate
43⁰C or 37⁰C
Cool down
e.g. by ice water
Storage
4⁰C
Explanation of main steps
- Milk/ standardization
Each group starts with one litter of milk and proceeds accordingly with the
table below
Table 5. Types of milk and incubation temperatures for making yogurt
Types of milk
Incubation temperature
43⁰C
UHT full-fat milk
UHT full-fat milk + 2% Skim milk powder
43⁰C
37⁰C
UHT full-fat milk
UHT full-fat milk + 2% Skim milk powder
37⁰C
Inoculation
• Add appropriate amount of starter culture (0.25%) into milk.
• Mix the content after addition and then incubation.
- Incubation/ Fermentation
• For set type of yogurt: Leave a small amount of sample for determination of pH
and ⁰Dornic at the starting point. Pour the rest into pots (e.g., 100 mL) and
incubate at 43⁰C until a pH of 4.6 (90-120⁰D). The fermentation time is about
4 - 5h, depending on the strength of the starter culture.
-
•
c.
For stirred type of yogurt: Leave a small amount of sample for determination
of pH and ⁰Dornic at the starting point. Incubate the rest directly at 37 ⁰C until a
pH of 4.6 (14 - 16h). Cool down, stir and transfer into pots.
Results
Table 6. pH assessment during incubation time.
Time
1
2
3
4
pH
5.3
5.0
4.8
4.6
- pH of the final yogurt is 4.6
- The final product after
incubation and cool storage
had these
characteristics: white color,
smooth texture, and slightly
sour
d.
Discussion
- Heating step in the procedure is carried out to destroy the undesirable
microorganism and inhibit the activity of enzyme.
- The final product belongs to stir type group, this group is incubated at 37 ⁰C so that
it has longer fermentation time (14 - 16 hours) compare to at 43 ⁰C (4 - 5 hours).
e.
Conclusion
- Yogurt is a fermented product that can help preserve milk for a long time.
- Each step in making process should be carried out carefully to obtain the final
product.
Experiment 3: Making ice cream
Objective
- This experiment was carried out to show how to make ice cream product as well as
factors affect to the processing.
I.
II.
-
-
Materials and methods
Apparatus and reagents
2 chicken eggs
4 egg yolks
250gr of sugar
20 mL of vanilla
800 mL of fresh milk without sugar
300 mL of whipping cream
10gr of cornstarch
30gr of cocoa powder
34gr of instant coffee powder
8 passion fruits
Method
Making ice cream
• Beat eggs, egg yolk and sugar then adding milk heat with a small flame
(warm) and stir boil the mixture at low temperature (warm), adding
cornstarch (which should be stirred first with a little water). Lifted out of the
kitchen.
• Whip the whipping cream and adding to the mixture.
• Incubate in the fridge for 4 hours and then pour into the ice cream maker.
-
• Get the final product.
Making chocolate ice cream: Take the same steps as making vanilla ice cream but
instead of adding vanilla, we adding cocoa powder and instant coffee powder.
Results
III.
Table 7. Sensorial properties of the product
Vanilla ice cream
- Dark brown color
- Cocoa, coffee and milk
flavor
- Not fatty
- Sweet
IV.
-
V.
Chocolate ice cream
Passion fruit ice cream
- Light yellow color
- Smoother and fattier than
chocolate ice cream.
- Slightly sweet
- Yellow color
- Smoother
- Slightly sour taste
- Natural aroma of passion
fruit
Discussion
When making ice cream, milk is not heated to very high temperature, if not, when
add egg yolk, it will not curdle.
Some stabilizers (CMC, xanthan gum, corn starch) can be used to increase the
thickness and help the product melt slowly
Conclusion
- Ice cream is one type of frozen dairy product that can be served as a dessert.
- The quality of ice cream varies depends on how it made so that every step in
process should be taken out carefully.
Experiment 4: Tasting of milk and dairy products
Consumption milk
Table 8. Sensorial evaluation results of milk product
Yakult
-
Light yellow color
Sweet and sour taste
Steurilized milk
-
Smell of fresh milk
White color
Fatty taste
Fermented milk products
Table 9. Sensorial evaluation results of fermented milk product.
Fermented milk
products
Characteristics
Dink yogurt
-
Odorous, sweet taste
Opaque yellow color
Liquid form
Yogurt 1
-
Sour taste
White with slightly yellowish color
The structure is smooth
Yogurt 2
-
Slightly sour taste, sweet
White color
The structure is very smooth
Yogurt 3
-
Sour taste
White color
Soft texture, smooth, no water separation
Yogurt 4
-
Slightly sour taste
Whiter color
Soft texture, no smooth, water separation
Cheese products
Table 10. Sensorial evaluation results of cheese product
Types of cheese
product
Smoked cheese
Blue vein cheese
LaVache quirit cheese
Chracteristics
-
In the form of yarn, tough
Yellow color outside, white inside
Very salty taste, smell of smoke
-
White color with blue veins
No smell of milk, horrible smell, salty
-
Salty taste
Ivory white solor
Soft and smooth texture