Nghiên cứu nồng độ yếu tố tăng sinh tân mạch trong thủy dịch trước và sau tiêm nội nhãn bevacizumab ở bệnh võng mạc đái tháo đường tt tiếng anh
Bạn đang xem bản rút gọn của tài liệu. Xem và tải ngay bản đầy đủ của tài liệu tại đây (218.36 KB, 27 trang )
MINISTRY OF EDUCATION AND TRAINING
MINISTRY OF HEALTH
HANOI MEDICAL UNIVERSITY
NGUYEN TUAN THANH HAO
VASCULAR ENDOTHELIAL GROWTH FACTOR
IN AQUEOUS HUMOR BEFORE AND AFTER
INTRAVITREAL INJECTION OF BEVACIZUMAB
IN EYES WITH DIABETIC RETINOPATHY
Major : Ophthalmology
Code : 62720157
MEDICAL DOCTOR DISSERTATION SUMMARY
HA NOI - 2019
THE DISSERTATION IS COMPLETED AT
HANOI MEDICAL UNIVERSITY
Scientific guidance:
Assoc. Pro. Ph.D Pham Trong Van
Reviewer 1: Assoc. Pro. Ph.D Hoang Nang Trong
Reviewer 2: Assoc. Pro. Ph.D Nguyen Van Dam
Reviewer 3: Assoc. Pro. Ph.D Tran Van Khanh
The dissertation will be presented to the Board of Ph.D
dissertation at University level at Hanoi Medical University.
At the time
, date
The dissertation can be found at:
- National Library of Vietnam
- Library of Hanoi Medical University
LIST OF PUBLIC SCIENTIFIC WORKS RELATED
TO THE DISSERTATION
1.
Nguyen Tuan Thanh Hao, Nguyen Quoc Dat, Pham Trong
Van, Vu Tuan Anh (2018). "Vascular endothelial growth
factor in the intraocular fluid of eyes with diabetic
retinopathy and influemce of therapy with Bevacizumab”.
Journal of Medical Research, vol. 112 (3), 60 - 67.
2.
Nguyen Tuan Thanh Hao, Pham Trong Van, Vu Tuan Anh
(2018). Vascular endothelial growth factor in aqueous humor
before and after intravitreal injection of Bevacizumab in eyes
with diabetic retinopathy. Journal of Medical Research, vol.
114 (5), 25 - 33.
3.
Nguyen Tuan Thanh Hao, Pham Trong Van, Vu Tuan Anh
(2019). Vascular endothelial growth factor in aqueous humor
before and after intravitreal injection of Bevacizumab in eyes
with proliferative diabetic retinopathy, VietNam Medical
Journal, vol. 1(2), 147 – 151.
1
INTRODUCTION
Diabetic retinopathy (DR) is a serious complication secondary
to diabetic mellitus and a leading cause of blindness. The
pathogenesis of DR is multifactorial, complex and still not entirely
understood. The molecular pathophysiology involves the
interaction of several factors: breakdown of the blood- retinal
barriers, expression and release of biochemical factors, tissue
hypoxia, retinal circulatory changes, or vitreous traction. There is
strong evidence that VEGF plays a key role in the blood-retinal
barriers breakdown and retinal microvascular occlusion leading to
macular edema and retinal ischemia in DR. Intravitreal
Bevacizumab (Avastin, Genentech Inc.) is commonly used for the
effective treatment of DR. Studies have proposed that determining
the dose of intravitreal Bevacizumab rely on intraocular levels of
VEGF should be optimized. Recent studies have shown that
intravitreal Bevacizumab decrease the intraocular VEGF level,
cause regression of the retinal neovascular and reduce leakage.
Studies reported that the VEGF level in the aqueous was
correlated with the severity of DR. In Vietnam, up to now, no
report has been published on measurement of intraocular VEGF
levels in DR. That’s the reason why we conducted this study to:
1. To compare the concentration of vascular endothelial
growth factor in the aqueous humor before and after
intravitreal invjection of Bevacizumab in eyes with diabetic
retinopathy.
2. Analysize the correlation of the VEGF level in the aqueous
with the disease.
2
New contributions of the thesis as follows:
1. This is the first study in Viet Nam update the key role of
VEGF in the molecule pathogenesis which has become target
for treatment of diabetic retinopathy.
2. The thesis determined the concentration of VEGF in the
aqueous humor before and after intravitreal injection of
Bevacizumab in eyes with diabetic retinopathy and the
correlation with the disease.
3. The thesis provided the base from which further studies will
continue to elucidate the pathogenesis remains unclear and
find the dose of intravitreal Bevacizumab rely on intraocular
levels of VEGF.
The layout of thesis:
There are 113 pages, including: Introduction (2 pages); Chapter 1.
Overview (31 pages); Chapter 2. Methods and objects of the reseach
(18 pages); Chapter 3. Results (30 pages); Chapter 4. Discussion (31
pages); Conclusion (2 pages); Recommendations (1 page);
Information on new contributions of the thesis (1 page). Reference:
149 documents, including 7 Vietnamese documents and 142 English
documents.
Chapter 1. OVERVIEW
1.1. Diabetic retinopathy
DR is a serious microvascular complication secondary to
diabetic mellitus and involves 30-50% diabetic patient. DR is one
of the leading cause of blindness globally. Typical clinical
manifestations of DR reflect damage to retinal blood vessels
with sequelae that include of breakdown of the blood- retinal
barriers, retinal microvascular occlusion leading to macular edema
and retinal ischemia and neovascular in proliferative DR. The
3
pathophysiology underlying these changes is multifactorial,
complex and still not entirely understood. Besides microvascular
disease, there is evidence of inflamation and retinal
neurodegeneration in the development and progression of DR.
Chronic hyperglycemia induces inflamation and oxidative stress,
both of which promote many interconected biochemical processes
that ultimately lead to microvascular and neuronal dysfunction.
The ischemic retina secretes VEGF, an endothelial cell mitogen
and an angiogenic inducer, into the vitreous cavity. VEGF increase
vascular permeability and cause the formation of new vessels
arising from the plane of the retina resulting in DME and PDR.
Studies have shown that VEGF plays a central role in the
pathophysiology of DR disease.
1.2. Vascular Endothelium Growth Factor
VEGF is a critical component in the tissue growth and organ
repair processes of angiogenesis and vasculogenesis. While it
plays a central role in the development of pathologic
microvascular complications, and diabetic retinopathy in
particular, VEGF is also a survival factor for endothelial cells,
increases microvascular permeability and is a potent vasodilator.
The most important VEGF- mediated actions in the
pathogenesis of DR are the breakdown of the blood- retinal
barriers (BRB) and angiogenesis.
1.2.1. Breakdown of BRB - Diabetic macula edema (DME)
Vascular leakage as a consequence of the breakdown of the
BRB, in particular the inner BRB, contributes to the pathogenesis
of DME. Vascular permeability is mediated by increased VEGF,
due to its ability to induce vascular leakage. VEGF may induce
permeability by transport through cells by inducing fenestrae and
vesicles by breakdown of the junctional complex.
4
1.2.2. Angiogenesis- Proliferative Diabetic Retinopathy (PDR)
The mechanism by which VEGF induces neovascularization
in PDR are multifactorial. The increase of VEGF induced by
hypoxia as well as the enhancement of VEGF receptors, will be
crucial in determining its angiogenic effect. VEGF concentration
has been found strikingly higher in the vitreous fluid of PDR
patients.
1.3. The research situation about intraocular VEGF
concentration
1.3.1. Intraocular VEGF concentration in normal eyes
VEGF is produced by several types of cells within the eye
(retinal pigment epithelial cells, glial cells, retinal capillary
pericytes, endothelial cells, Mullers cells and ganglion cells). Kim
et al (1999) reported that VEGF, VEGF-R1, and VEGF-R2 are
each essential for normal blood vessel development. Many studies
have shown that VEGF was detected in normal eyes. VEGF is an
angiogenic factor. Because no active neovascularization occurs in
normal eyes, it is possible that the VEGF observed in studies is
not bioactive.
1.3.2. Intraocular VEGF concentration in DR and influence of
therapy with Bevacizumab
Intravitreally injected bevacizumab decrease the intraocular
VEGF level, cause regression of the retinal and iris
neovascularization, and reduce leakage. Funk et al (2010) reported
that intravitreal injecton of bevacizumab substantially decreased
the VEGF concentration in the aqueous humor in eyes with PDR
by at least 20- fold. It was reported that the VEGF level in the
aqueous humor was substantially correlated with the VEGF level
5
in the vitreous. Takayuki Hattori et al (2010) estimated the amount
of bevacizumab that would be required to block VEGF in the
vitreous at a VEGF concentration of 10 000 pg/ml. Assuming the
volume of the vitreous to be 4 ml and the molecular weight of
VEGF to be 38 kDa, the calculated total amount of VEGF present
in the vitreous is 1.1 x 10⁻¹²mol. Because 1 molecule of
bevacizumab binds with 2 molecules of VEGF, the total amount of
bevacizumab (molecular weight, 150 kDa) required to block
VEGF in the vitreous would be 83 ng, which is a minute amount.
1.3.3. The correlation of the intraocular VEGF
level with the disease
VEGF is a critical stimulus for DME and PDR. Diabetic
patients with DME or PDR have elevated intraocular VEGF in the
vitreous and aqueous fluids that are correlated with the disease
presence and severity. VEGF is soluble and can be measured in
fluid compartments within the eye as an indicator of increase
retinal VEGF. Some studies have been done that tested aqueous
samples for VEGF levels as a mean to predict risk of DME.
Futnasu et al (2002) studied in 54 eyes with DME and found that
the aqueous levels of VEGF are significantly correlated with the
severity of macular edema as assessed using biomicroscopy and
fluorescein angiography. Kim et al (2015) reported that there were
no differences in aqueous levels of VEGF between groups
according to morphologic patterns based on OCT. Praidou (2009)
reported that the vitreous levels of VEGF are significantly
correlated with the severity of retinal ischemia, retinal
neovascular, and the activity of PDR but not correlated with the
posterior vitreous detachment, vitreous haemorrhage, retinal
6
detachment.
Chapter 2: SUBJECTS AND METHODOLOGY
This prospective trial was performed at DaNang Eye Hospital
from January 2016 to May 2018.
2.1. Study subjects.
2.1.1. Inclusion criteria
- DR group: Diabetic patients with diabetic clinical significant
macular edema or proliferative diabetic retinopathy who were
scheduled for intravitreal invjection of 1.25mg Bevacizumab.
Patients agreed to participate to the study.
- Control group: Patients were scheduled to have cataract
surgery, did not have a history of diabetic mellitus and have no
retinal vascular diseases. Patients agreed to participate to the
study.
2.1.2. Exclusion criteria
- Patients had ocular disease apart from DR and cataracts; iris
neovascular or neovascular glaucoma; previous ocular surgery or
intravitreal triamcinolone or anti VEGF injection or laser
photocoagulation within 3 months before entry into the study.
2.2. Research methodology
2.2.1. Study design
Prospective clinical observational study with control group.
2.2.2. Sample size
Formula:
∂12 + ∂22
n = Z2(α,β)
(µ1 - µ2)2
n: sample size; Z2(α,β): express to significance, if α = 0,05; β = 0,1
Calculated sample size:
7
- DR group n = 41 eyes. The study took more, selected 60 eyes
to meet selection criteria for the study.
- Control group n = 9 eyes. The study took more, selected 15
eyes to meet selection criteria for the study.
2.2.3. Research tools
2.2.4. Research procedure
2.2.4.1. Clinical procedures and investigations
- Information of patients.
- Endocrine examination and treatment.
- Ophthalmic examination.
- Taking fundus photographs with 7 standards fields of the
ETDRS classification.
- Undergoing OCT
- Undergoing fundus fluorescein angiography.
- Undergoing B scan.
2.2.4.2. Collection of aqueous humor
Before starting the intravitreal bevacizumab injection in the DR
group or cataract surgery in the control group, undiluted samples
of aqueous humor (0.1-0.2 ml) were aspirated by limbal
paracentesis using a 30-gauge needle attached to a tuberculine
microsyringe. The samples were placed immediately into sterile
tubes and stored at -80oC in a deep freezer until they were
assayed.
The same procedure was performed 1 week later in the DR
group.
2.2.4.3. Intravitreal injection of Bevacizumab
Under sterile conditions in the operating room, 1.25 mg (0.05
ml) of bevacizumab (Avastin 100mg/4ml) was injected into the
vitreous in the superior temporal quadrant with a sharp 30-gauge
needle that was inserted into the eye at 3.5-4.0 mm from the
8
limbus. The needle was carefully removed, and a sterile cotton
applicator was used to prevent reflux. The postoperative
medications included topical antibiotics four times daily for at
least 7 days.
2.2.4.4. Measurement of VEGF
The VEGF concentration in the aqueous humor was measured
using an enzym- linked immunosorbent assay for human VEGF
(R&D System Inc, Minneapolis, Minnesota).
2.2.5. Evaluation criterias
2.2.5.1. Evaluation of medical characteristics
- Patients’ age: divided into 3 groups of age.
- Gender.
- Type of diabetes.
- Duration of diabetes.
- Glycemia.
- HbA1C level.
2.2.5.2. Evaluation of ophthalmic characteristics
- Visual acuity.
- History of laser photocoagulation.
- Posterior vitreous detachment.
- Severity of DR.
- Grade of macula edema.
- Classification of DME on fluorescein angiography.
- Classification of DME according to morphologic pattern on
OCT.
- Vitreous haemorrhage.
- Tractional retinal detachment.
- Fibrosis.
- Activity of PDR.
2.2.5.3. Complication
9
- Ocular adverse events.
- Systemic adverse events.
2.6. Data analysis
All data were collected in a Microsoft Excel 2016 and analysed
with SPSS version 20.0. The results were expressed as the mean ±
standard error value. The Wilcoxon, Mann-Whitney, Kruskal-Wallis
tests were used to analyze the different VEGF concentrations
between groups. Spearman’s rank order correlation coefficients were
calculated. A (p<0.05) was considered statistically significant.
2.6. Ethical consideration
Topic was approved by the council of science and ethics, as
well as through the university council and the science of medical
ethics hospital, all data were obtained as confidentially.
Chapter 3: RESULTS
A total of 75 eyes were included in our study: 60 eyes (38
patients) in DR group and 15 eyes (15 patients) in control group.
3.1. Characteristics of the sample
3.1.1. Age and gender characteristics
The mean age of 38 patients in DR group was 53,97 ± 7,87
years. The mean age of 15 patients in control group was 57,40 ±
9,49 years. There were no significant differences between the
diabetic and controls with respect to sex and age.
3.1.2. Type of diabetes
13,16% of patients had diabetes type 1; 86,84% of patients had
diabetes type 2.
3.1.3. Duration of diabetes
The mean duration of diabetes was 11,97 ± 6,05 years. Mainly
of patients had duration of diabetes over 10 years.
3.1.4. Glycemia
10
The mean HbA1C was 7,91 ± 2,03 %. Mainly of patients had
HbA1c rate > 7% (73,68%).
3.1.5. Vision acuity
76.67% of eyes had vision acuity lower than counting fingers
from 3 meters.
3.1.6. Vitreous haemorrhage
In this research, there were 48 eyes of PDR classifying into 4
groups of vitreous haemorrhage:
- Group 0: no vitreous haemorrhage (19 eyes)
- Group 1: vitreous haemorrhage grade 1 (11 eyes)
- Group 2: vitreous haemorrhage grade 2 (7 eyes)
- Group 3: vitreous haemorrhage grade 3 (11 eyes)
3.1.7. Macula edema
In this research, there were 42 eyes (include of NPDR and
PDR) had no vitreous haemorrhage or vitreous haemorrhage grade
1 so we can view clearly the fundus to evaluate the macula and
retina. Bemong these eyes, there were 35 eyes had CSME, 30 eyes
had PDR.
3.2. VEGF concentration in aqueous humor before and after
intravitreal injection of bevacizumab
3.2.1. VEGF concentration in DR group and control group
VEGF concentration in 60 eyes with DR was 428,70 ± 337,74
pg/ml, higher than in 15 eyes control with cataract was 120,65 ±
45,05 pg/ml. (p = 0,000). VEGF concentration in 60 eyes with DR
dramatically decrease to 14,34 ± 17,18 pg/ml 1 week after
injection of bevacizumab (p = 0,000).
3.2.2. VEGF concentration in DR group
3.2.2.1. VEGF concentration in PDR and DME group
11
VEGF concentration in 35 eyes with DME before intravitreal
injection of bevacizumab was 447,39 ± 368,77 pg/ml,
dramatically decrease to 14,04 ± 17,82 pg/ml 1 week after
injection (p = 0,000).
VEGF concentration in 48 eyes with PDR before intravitreal
injection of bevacizumab was 474,23 ± 361,32 pg/ml,
dramatically decrease to 16,96 ±18,11 pg/ml 1 week after
injection (p = 0,000).
3.2.2.2. VEGF concentration according to severity of DR
VEGF concentration in 12 eyes with NPDR before intravitreal
injection of bevacizumab was 246,56 ± 93,45 pg/ml, significantly
decrease to 3,93 ± 5,87 pg/ml 1 week after injection (p = 0,002).
VEGF concentration in 48 eyes with PDR before intravitreal
injection of bevacizumab was 474,23 ± 361,32 pg/ml,
dramatically decrease to 16,96 ±18,11 pg/ml 1 week after
injection (p = 0,000).
3.2.2.3. VEGF concentration according to status of retinal laser
photocoagulation
VEGF concentration in 15 eyes with retinal laser
photocoagulation before intravitreal injection of bevacizumab was
327,61 ± 362,40 pg/ml, significantly decrease to 16,55 ± 14,59
pg/ml 1 week after injection (p = 0,001); VEGF concentration in
45 eyes without retinal laser photocoagulation before intravitreal
injection of bevacizumab was 462,39 ± 326,37 pg/ml,
significantly decrease to 13,62 ± 18,05 pg/ml 1 week after
injection (p = 0,000).
3.2.3. VEGF concentration in DME group
3.2.3.1. VEGF concentration according to classification of DME
on fluorescein angiography
12
VEGF concentration in 18 eyes with hyperfluorescent DME
before intravitreal injection of bevacizumab was 588,52 ± 440,79
pg/ml, significantly decrease to 21,29 ± 21,15 pg/ml 1 week after
injection; VEGF concentration in 17 eyes with minimally fluorescent
DME before intravitreal injection of bevacizumab was 297,95 ±
190,83 pg/ml, significantly decrease to 6,35 ± 8,83 pg/ml 1 week
after injection (p = 0,000).
3.2.3.2. VEGF concentration according to morphologic pattern on
OCT
VEGF concentration in 20 eyes with DRT before intravitreal
injection of bevacizumab was 452,66 ± 363,21 pg/ml,
significantly decrease to 12,80 ± 19,02 pg/ml 1 week after
injection (p = 0,000).
VEGF concentration in 9 eyes with CME before intravitreal
injection of bevacizumab was 389,68 ± 301,79 pg/ml,
significantly decrease to 18,53 ± 17,33 pg/ml 1 week after
injection (p = 0,008).
VEGF concentration in 6 eyes with SRD before intravitreal
injection of bevacizumab was 516,38 ± 515,69 pg/ml,
significantly decrease to 11,42 ± 15,93 pg/ml 1 week after
injection (p = 0,028).
3.2.4. VEGF concentration in PDR group
3.2.4.1. VEGF concentration according to status of vitreous
haemorrhage
VEGF concentration in 19 eyes without vitreous haemorrhage
before intravitreal injection of bevacizumab was 411,62 ± 235,98
pg/ml, significantly decrease to 15,53 ± 16,52 pg/ml 1 week after
injection; VEGF concentration in 29 eyes with vitreous
haemorrhage before intravitreal injection of bevacizumab was
515,26 ± 423,01 pg/ml, significantly decrease to 17,89 ± 19,3
pg/ml after injection (p = 0,000).
13
3.2.4.2. VEGF concentration according to status of tractional
retinal detachment (TRD)
VEGF concentration in 40 eyes without TRD before
intravitreal injection of bevacizumab was 497,38 ± 365,63 pg/ml,
significantly decrease to 18,60 ± 18,82 pg/ml 1 week after
injection (p=0,000); VEGF concentration in 8 eyes with TRD
before intravitreal injection of bevacizumab was 358,52 ± 336,74
pg/ml, significantly decrease to 8,76 ± 11,61 pg/ml after injection
(p = 0,012).
3.2.4.3. VEGF concentration according to status of fibrosis
VEGF concentration in 14 eyes without fibrosis before
intravitreal injection of bevacizumab was 330,23 ± 185,92 pg/ml,
significantly decrease to 13,64 ± 12,07 pg/ml 1 week after
injection (p=0,001).
VEGF concentration in 23 eyes with fibrosis before intravitreal
injection of bevacizumab was 581,46 ± 434,63 pg/ml, significantly
decrease to 19,60 ± 22,41 pg/ml after injection (p = 0,000).
3.2.4.3. VEGF concentration according to activity of PDR
VEGF concentration in 31 eyes with active PDR before intravitreal
injection of bevacizumab was 535,72 ± 392,03 pg/ml, significantly
decrease to 18,66 ± 19,30 pg/ml after injection (p = 0,000).
VEGF concentration in 6 eyes with inactive PDR before intravitreal
injection of bevacizumab was 273,44 ± 258,99 pg/ml, significantly
decrease to 11,55 ± 20,84 pg/ml after injection (p = 0,028).
3.3.The
relationship
between
VEGF and
disease
characteristics
3.3.1. The relationship between VEGF and DR
3.3.1.1. The relationship between VEGF and clinical parameters
There was no correlation between VEGF concentration in the
aqueous humor with the age, diabetic duration, glycemia, HbA1C,
vision loss time, best corrected visual acuity (p > 0,05).
3.3.1.2. The relationship between VEGF and severity of DR
14
VEGF concentration in the aqueous humor was significantly
higher in patients with proliferative diabetic retinopathy than in
nonproliferative diabetic retinopathy (r = 0,284; p = 0,029).
3.3.1.3. The relationship between VEGF and status of retinal laser
photocoagulation
VEGF concentration in the aqueous humor was significantly
higher in patients without retinal laser photocoagulation before
than in patients with retinal laser photocoagulation before (r =
-0,294; p = 0,024).
3.3.1.4. The relationship between VEGF and status of PVD
There were no differences in aqueous concentration levels of
VEGF between groups classified according to the status of
posterior vitreous detachment (r = -0.161; p = 0,271).
3.3.2. The relationship between VEGF and DME
3.3.2.1. The relationship between VEGF and OCT and FFA
parameters
There was no correlation between VEGF concentration in the
aqueous humor with the central retinal thickening, cube volume (p
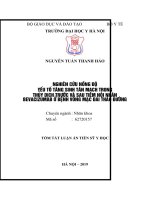
= 0,954, r = 0,010). There was high correlation between VEGF
concentration in the aqueous humor with the area of retinal
ischaemia (p=0,001,r =0,522).
15
Figure 1. The correlation between VEGF and the area of retinal
ischaemia in DME group
3.3.2.2. The relationship between VEGF and status of fluorescent DME
VEGF concentration in the aqueous humor was significantly
higher in patients with hyperfluorescent DME than in minimally
fluorescent DME (r = 0,436; p = 0,011).
3.3.2.2. The relationship between VEGF and status of
morphologic pattern on OCT
There were no differences in aqueous concentration levels of
VEGF between 3 groups DRT, CME, SRD classified according to
the status of morphologic pattern on OCT (r = 0.012; p = 0,879).
3.3.3 The relationship between VEGF and DR
3.3.3.1. The relationship between VEGF and FFA parameters
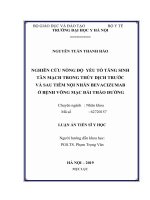
Figure 2. The correlation between VEGF and the area of retinal
neovascular in PDR group
Tablet 1. The multivariate linear regression models for the
correlation between VEGF and FFA parameters in PDR group
VEGF concentration(n = 30)
FFA parameters
B (SE)
Beta
VIF
P
46,646
C
(134,072)
4,349
Retinal ischaemia area
0,304 1,005 0,042
(2,040)
Retinal neovascular area
36,902
0,580 1,005 0,000
16
(9,072)
R2
0,454
P (Anova)
0,000
There was high correlation between VEGF concentration in the
aqueous humor with the area of retinal ischaemia and retinal
neovascular (p = 0,000, VIF = 1,005, R2 = 0,454). Using logistic
regression models, it was determined that the estimated VEGF
concentration of patient with PDR could be calculated as follows:
VEGF concentration (pg/ml) = 46,646 + 4,349 Retinal
ischaemia area + 36,902 Retinal neovascular area.
3.3.3.2. The relationship between VEGF and status of vitreous
haemorrhage
There were no differences in aqueous concentration levels of
VEGF between 4 groups classified according to the status of
vitreous haemorrhage (r = -0,039; p = 0,406).
3.3.3.3. The relationship between VEGF and status of fibrosis
There were no differences in aqueous concentration levels of
VEGF between 4 groups classified according to the status of
fibrosis (r= 0,136; p = 0,166).
3.3.3.4. The relationship between VEGF and status of tractional
retinal detachment
There were no differences in aqueous concentration levels of
VEGF between 4 groups classified according to the status of
tractional retinal detachment (r=-0,218; p=0,135).
3.3.3.5. The relationship between VEGF and status of activity of
PDR
VEGF concentration in the aqueous humor was significantly
higher in patients with activitive PDR than inactivitive PDR (r=
0.371; p = 0,026).
3.4. Complication
17
3.4.1. Ocular adverse events
After injection of bevacizumab, no serious ocular
complications developed, such as uveitis, endophthalmitis…There
were 24 eyes ( 40%) had ocular pain, 14 eyes ( 23,3%) had ocular
hyperemia, 10 eyes ( 16,7%) had subconjunctival haemorrhage.
These symptoms were mild.
3.4.2. Systemic adverse event
During the follow- up period, none of the patients developed
any serious systemic adverse event. There were 2 cases (5.3%)
had hypertension which be well controlled.
Chapter 4: DISCUSSION
4.1. VEGF concentration in aqueous humor before and after
intravitreal injection of bevacizumab
4.1.1. VEGF concentration in DR group and control group
The mean VEGF concentration in the aqueous humor in eyes
with DR in our study was similar to that found by other authors
who reported that intravitreal injection of bevacizumab
dramatically decrease the VEGF concentration in the aqueous
humor in eyes with PDR and DME by at least 10 folds . Our
results showed that the VEGF concentration in the aqueous humor
was also higher than in control eyes.
4.1.2. VEGF concentration in DR group
4.1.2.1. VEGF concentration in PDR and DME group
There were no differences in aqueous concentration levels of
VEGF among the subgroups with PDR and DME, was similar to
that found by Sawada (2007). There may be no differences among
the types of severe DR such as PDR and DME.
4.1.2.2. VEGF concentration according to severity of DR
The mean VEGF concentration in the aqueous humor in eyes
according to severity of DR before and after intravitreal injection
18
of bevacizumab was similar to that found by Futnasu (2002),
Sawada (2007) and Kayako Matsuyama (2009).
4.1.2.3. VEGF concentration according to status of retinal laser
photocoagulation
As expected, intravitreal injection of bevacizumab substantially
decrease the VEGF concentration in the aqueous humor in eyes
with or without retinal laser photocoagulation before. It was
similar to other studies in the world.
4.1.3. VEGF concentration in DME group
4.1.3.1. VEGF concentration according to classification of DME
on fluorescein angiography
In DME, breakdown of the BRB is followed by leakage of
fluid from the damaged retinal capillaries, and leakage of
fluorescein associated with BRB breakdown leads to
hyperfluorescence on FA. The mean VEGF concentration in the
aqueous humor in eyes with hyperfluorescent and minimal
fluorescent DME before and after intravitreal injection of
bevacizumab was similar to that found by Futnasu (2009).
4.1.3.2. VEGF concentration according to morphologic pattern on
OCT
Intravitreal injection of bevacizumab substantially decrease the
VEGF concentration in the aqueous humor in eyes according to
morphologic pattern on OCT. It was similar to other studies in the
world. Many studies including this study showed that antiVEGF
treatment was successful in reducing intraocular VEGF and the
degree of DME.
4.1.4. VEGF concentration in PDR group
4.1.4.1. VEGF concentration according to status of vitreous
haemorrhage
19
Intravitreal injection of bevacizumab substantially decrease the
VEGF concentration in the aqueous humor in eyes with or without
vitreous haemorrhage. It was similar to that found by Qian (2011),
Sawada (2007), Forooghian (2010).
4.1.4.2. VEGF concentration according to status of tractional
retinal detachment (TRD)
Angiogenic
phase
switch
to
fibrotic
phase
causing
fibrovascular contracton leading to TRD in PDR. The mean VEGF
concentration in the aqueous humor in eyes with or without TRD
before and after intravitreal injection of bevacizumab was similar
to that found by Jiu-Ke Li (2015).
4.1.4.3. VEGF concentration according to status of fibrosis
Intravitreal injection of bevacizumab substantially decrease the
VEGF concentration in the aqueous humor in eyes with or without
fibrosis. It was similar to other studies in the world.
4.1.4.3. VEGF concentration according to activity of PDR
VEGF is the most potent angiogenic factor in PDR. The mean
VEGF concentration in the aqueous humor in eyes with active or
quiescent PDR before and after intravitreal injection of bevacizumab
was similar to that found by other studies in the world.
4.2.
The
relationship
between
VEGF
and
disease characteristics
4.2.1. The relationship between VEGF and DR
4.2.1.1. The relationship between VEGF and clinical parameters
There was no correlation between VEGF concentration in the
aqueous humor with the age, diabetic duration, hyperglycemia,
20
HbA1C, vision loss time, BCVA. HbA1C levels at the time of
operation may not necessarily reflect their long-term glycemic control.
4.2.1.2. The relationship between VEGF and severity of DR
In agreement to previous reports, VEGF concentration in the
aqueous humor was significantly higher in patients with PDR than
in NPDR.
4.2.1.3. The relationship between VEGF and status of retinal laser
photocoagulation
Intraocular VEGF concentration has previously been shown to
be reduced after laser photocoagulation. The mean VEGF
concentration in the aqueous humor higher in eyes without retinal
laser photocoagulation than in eyes with retinal laser
photocoagulation, was similar to that found by Praidou (2009) and
Watanabe (2005).
4.2.1.4. The relationship between VEGF and status of PVD
The role of PVD in DR pathogenesis still unclearly understood.
There was no differences between VEGF concentration in the
aqueous humor and status of PVD in agreement to Ishizaki
(2006), Praidou (2009)’s reports.
4.2.2. The relationship between VEGF and DME
4.2.2.1. The relationship between VEGF and OCT and FFA
parameters
The correlation between VEGF and CRT and CV on OCT
remains unclearly. Previous studies found that not only VEGF but
also proinflamatory cytokines may play an important role in
breakdown of the BRB and development of DME. In our study, no
21
correlation noted between VEGF and CRT and CV agreed with
new previous studies.
There were strong correlation between VEGF and retinal
ischaemia area. Because ischemic retina release high levels of
VEGF, the aqueous VEGF levels also may represent the severity
of retinal ischemia
4.2.2.2. The relationship between VEGF and status of macula
fluorescent
VEGF concentration in the aqueous humor was significantly
higher in patients with hyperfluorescent DME than in minimally
fluorescent DME. It was similar to that found by previous studies.
It is likely minimally fluorescent DME represents an earlier phase
of disease.
4.2.2.3. The relationship between VEGF and status of
morphologic pattern on OCT
There were no differences in aqueous concentration levels of
VEGF between 3 groups DRT, CME, SRD, was similar to that
found by Sonado (2014) and Kim (2015). VEGF is one of the key
factors for the DME. However, VEGF is not the only factor. There
have been many reports descibing an increase of other
proinflamatory cytokines such as IL-6, IL-8,…in the intraocular
fluid of eyes with DME.
4.2.3 The relationship between VEGF and PDR
4.2.3.1. The relationship between VEGF and FFA parameters
There was high correlation between VEGF concentration in the
aqueous humor with the area of retinal ischaemia and retinal
neovascular. VEGF is reported to be the most potent angiogenic
factor in retinal ischemic progressing to retinal neovascularization.
22
Multivariate logistic regression models showed the equation to
estimate the VEGF concentration of patient with PDR: VEGF
concentration (pg/ml) = 46,646 + 4,349 Retinal ischaemia area +
36,902 Retinal neovascular area.
4.2.3.2. The relationship between VEGF and status of vitreous
haemorrhage
There were no differences in aqueous concentration levels of
VEGF between 4 groups classified according to the status of
vitreous haemorrhage, was similar to that found by recent sttudies.
4.3.3.3. The relationship between VEGF and status of fibrosis
The causal factors of fibrosis and scarring and the regulation of
the transit from angiogenesis to the fibrotic phase of PDR remain
largely unknown. In our study there were no differences in
aqueous concentration levels of VEGF between 4 groups
classified according to the status of fibrosis was similar to that
found by recent studies.
4.3.3.4. The relationship between VEGF and status of tractional
retinal detachment
PDR progresses to a fibrotic phase with fibrovascular
contraction causing retinal detachment. In our study, there were no
differences in aqueous concentration levels of VEGF between 4
groups classified according to the status of tractional retinal
detachment. It was similar to that found by other recent studies.
Several growth factors have been shown to play a role in PDR
such as CTGF, bFGF,..
4.3.3.4. The relationship between VEGF and status of activity of
PDR