Nghiên cứu tổng hợp vật liệu khung cơ kim fe MOFs, ứng dụng làm xúc tác quang để xử lý một số hợp chất nitro vòng thơm trong sản xuất thuốc phóng thuốc nổ tt tiếng anh
Bạn đang xem bản rút gọn của tài liệu. Xem và tải ngay bản đầy đủ của tài liệu tại đây (850.69 KB, 28 trang )
MINISTRY OF EDUCATION AND TRAINING
MINISTRY OF NATIONAL DEFENCE
ACADEMY OF MILITARY SCIENCE AND TECHNOLOGY
TRAN DINH TUAN
STUDY ON SYNTHESIS OF THE METAL ORGANIC
FRAMEWORKS Fe-MOFs MATERIALS AND USED AS
PHOTOCATALYST FOR TREATMENT OF AROMATIC NITRO
COMPOUNDS IN EXPLOSIVES PRODUCTION
Specialization: Chemical engineering
Code: 952 03 01
SUMMARY OF DOCTORAL THESIS
Hanoi - 2019
This thesis has been completed at:
Academy of Military Science and Technology, Ministry of Defence
Scientific supervisors:
Assoc. Prof. Dr. Ninh Duc Ha
Dr. Do Huy Thanh
Reviewer 1:
Prof. Dr. Vu Thi Thu Ha
Reviewer 2:
Assoc. Prof. Dr. Cao Hai Thuong
Reviewer 3:
Assoc. Prof. Dr. Tran Van Chung
The thesis was defended in front of the Doctoral Evaluating Council at
Academy level held at Academy of Military Science and Technology at
8:30 AM, date … month … , 2019.
The thesis can be found at:
- The Library of Academy of Military Science and Technology
- Vietnam National Library.
THE SCIENTIFIC PUBLICATIONS
1. Tran Dinh Tuan, Ninh Duc Ha, Nguyen Thi Hoai Phuong, Nguyen
Cong Thang (2015), “Synthesis and study reactive photocatalysis of
Fe-BDC and Cr-BDC”, Vietnam Journal of Chemistry, No.53(5e1),
p.43-47.
2. Tran Dinh Tuan, Le Thanh Bac, Ninh Duc Ha, Do Huy Thanh
(2015), “Study on synthesis of MIL-100(Fe) at low temperature and
atmospheric pressure”, Vietnam Journal of Chemistry, No.53(6e4),
p.322-325.
3. Le Thanh Bac, Tran Dinh Tuan, Nguyen Thi Hoai Phuong,
Nguyen Duy Anh, Tran Van Chinh, Doan Thi Ngai (2015), “Study
synthesis on material metal organic framework based on Fe-BDC”,
Vietnam Journal of Chemistry, No.53(4e1), p.33-36.
4. Tran Dinh Tuan, Nguyen Thi Hoai Phuong, Ngo Hoang Giang,
Nguyen Tien Hue, Do Huy Thanh, Ninh Duc Ha (2016), “Study on
synthesis of Fe-BTC MOF material at low temperature and
atmospheric
pressure”.
Proceedings
CASEAN-4,
Bangkok,
Thailand.
5. Tran Dinh Tuan, Nguyen Thi Hoai Phuong, Do Huy Thanh, Ninh
Duc Ha (2016), “Synthesis and reactive photocatalysis of MOF
material based on Fe-BTC”, Vietnam Journal of Catalysis and
Adsorption, No.2, 91-96.
6. Tran Dinh Tuan, Le Viet Ha, Nguyen Thi Hoai Phuong, Ninh Duc
Ha (2017), “A new photocatalyst for the degredation of TNT by
metal organic framework NH2-MIL-88B(Fe)”. Journal of Military
Science and Technology, Special Issue, No.51A, 71-76.
1
INTRODUCTION
1. The urgency of the thesis topic
In Vietnam, defense industry factories produce a large amount of
explosives for military and civil purposes every year. This industry uses
a range of aromatic nitro derivatives such as trinitro toluene (TNT),
dinitro toluene (DNT), trinitro phenol (TNP)... which results in a large
amount of waste containing toxic aromatic compounds. Meanwhile, the
present technologies for handling military waste in general and aromatic
ring nitro compounds in particular still exist many limitations. Many
catalysts have been used for treatment of aromatic ring nitro
compounds. Among them, the photocatalysis materials based on
semiconductors such as TiO2, ZnO… are well-known which have
proven their high effectiveness for degradation of toxic organic waste.
However, the disadvantagies such as the poor recyclibility, low light
harvesting efficiency, fast charge recombination... have limited their
application in practical.
Metal-organic frameworks materials (MOFs) are known as hybrid
inorganic-organic material, which metal-oxide units or metal ions joined
by organic linkers through strong covalent bonds. MOFs have unique
crystal structure, large specific surface area, flexible structural frame,
resizable size, porosity through synthetic methods. Therefore, MOFs
can be employed as best candidate for adsorption and catalysts
application. Many domestic and international scientists had been studied
on the field of MOFs materials for few decade. It must be emphasized
that MOFs are very potential materials. More research is needed to
contribute to the database of the MOFs material synthesis and catalysis
applications, especially as photocatalyst for environmental treatment.
In order to fulfill this task, the PhD student has proposed and
implemented the thesis topic: "Study on synthesis of the metal organic
frameworks Fe-MOFs materials and used as photocatalyst for treatment
of aromatic nitro compounds in explosives production", with the aim is
to contribute to the diversification of MOFs material synthesis
techniques, characterize and evaluation of prepared materials and their
potential application as photocatalyst for the degradation of toxic
aromatic nitro waste in explosive production.
2. The contents
- Study on the synthesis of Fe-BTC and Fe-BDC-NH2 by the
refluxing method at low pressure and temperature.
2
- Study on the synthesis of Fe-BDC and Fe2Ni-BDC by the
solvothermal method.
- Analyzing structure and characterization of synthesized materials.
- Investigate photocatalytic activity of the Fe-MOFs materials for
degradation of TNT, TNP solutions in lab scale.
- Study on the mechanism of the photocatalytic behavior toward the
TNT, TNP solutions of Fe-MOFs materials.
3. The research method
The thesis used the solvothermal and the refluxing methods at low
temperature to synthesize Fe-MOFs materials. Modern physical and
chemical analysis techniques are used to structure analysis and
characterizration of synthesized materials such as: XRD, FT-IR, SEM,
BET, TGA, EDX, XPS, UV-Vis DRS. Furthermore, the qualitative and
quantitative analysis techniques for content of TNT, TNP in the solutions
after degradation reactions such as HPLC, TOC are also employed to
determine photocatalysis treatment effectiveness.
4. Scientific significance and applicability of the thesis
- Synthesis of several Fe-MOFs materials by solvothermal and
refluxing methods and using physical and chemical analyzing
techniques to contribute to the database of the materials.
- Study on the application of synthesized materials as the
photocatalyst to removal of TNT, TNP out of wastewater in the
explosive industry. The results show that four synthesized materials
have high efficiency and degradation rate. The results of the thesis are
primary for application of Fe-MOFs materials for treatment of
wastewater containing nitro aromatic ring compounds.
5. The layout of thesis
The thesis contains 119 pages which is constructed as following:
Overview 3 pages; chapter 1 - Introduction, 31 pages; chapter 2 Experiments, 18 pages; chapter 3 - Results and Dicussion, 50 pages;
Conclusion 3 pages; List of published scientific reports, 1 page and 106
references.
Chapter 1. Introduction
Overview about structural properties, synthesis methods and
application of MOFs as well as Fe-MOFs materials. Analysis and
evaluation of research status on the application of photocatalytic
properties and photocatalytic degradation mechanism of MOFs
materials in Vietnam and around the world. Overview about status of
solutions for the removal of aromatic nitro compounds out of
3
wastewater in propellant and explosive manufacture industry. As a
result, establishscientific basis and orientation for implementing of the
research content of the thesis.
Chapter 2. Experiments
2.1. Synthesis method
2.1.1. Materials
Terephthalic acid (H2BDC), C8H6O4; Trimesic acid (H3BTC),
C9H6O6; 2-Amino terephthalic acid (NH2-BDC), C8H7NO4; FeCl3.6H2O;
Fe(NO3)3.9H2O; Ni(NO3)2.6H2O; Dimethyl formamide (DMF),
C3H7NO; Hydro peroxide, H2O2; Trinitro toluene, C6H2(CH3)(NO2)3;
Trinitro phenol, C6H2(OH)(NO2)3.
2.1.2. Accessories and equpipments
- Basic laboratorial accessories.
- 250 mL three - neck flask, gauge glass, reflux condenser.
- Analytic balance, measure range from 0,001 to 220 g
- Mechanical stirrer with glass stirrer, IKA RW16, Germany.
- 200 mL Autoclave reactor 304 stainless with PTFE liner.
- Heating oven, 101 HU VUE, China.
- Centrifugal machine, EBA 21 Hettich, Germany, maximum speed
6000 rpm.
- Heating plate and magnetic stirrer, IKA C-MAGSH, Germany.
- Photocatalytic reactor.
2.1.3. Synthesis of Fe-BTC
2.1.3.1. Synthesis process of Fe-BTC
Fe-BTC was synthesized by refluxing method. Typically, mixture of
Fe(NO3).9H2O and acid H3BTC were dissolved in 50.4 mL distilled
water and magnetic stirred for 30 minutes. After that, the solution was
poured into the three-neck flask and adjusted pH about 6 and stirred in
15 minutes. The refluxing condenser system was installed, magnetic
stirring speed was adjusted about 300 rpm. The system was heated to
100oC and and maintained for 8 hours. The product was washed many
times by distilled water to remove impurities and washed by ethanol at
70oC. Finally, the product was filtered and heated at 60oC for 10 hours.
2.1.3.2. Study on the effect of factors on the synthesis
Study on the effect of factors on the synthesis of Fe-BTC such as:
percentage of reactants, reaction time, reaction temperature... by
adjusting mol ratio of H3BTC/Fe3+ from 0.5:2 to 2:2; reation time is 4, 6,
8, 10 hours; reaction temperature is 60, 80, 100oC.
4
2.1.4. Synthesis of Fe-BDC-NH2
2.1.4.1. Synthesis process of Fe-BDC-NH2
Fe-BDC-NH2 was synthesized by refluxing method. Typically, the
mixture of FeCl3.6H2O and DMF were dissolved in glass cup, magnetic
stirred for 30 minutes, added NH2-BDC acid and stirred continually for
15 minutes. After that, the solution was poured into the three-neck flask
and adjusted pH about 6 and stirred for 15 minutes. The refluxing
condenser system was installed, magnetic stirring speed was adjusted
about 300 rpm. The system was heated to 100oC and and maintained for
8 hours. The product was washed many times by DMF to remove acid
and washed by ethanol at 70oC to remove DMF. Finally, the product
was filtered and heated at 60oC for 10 hours.
2.1.4.2. Study on the effect of factors on the synthesis Fe-BDC-NH2
Study on the effect of factors on the synthesis of Fe-BDC-NH2
such as: percentage of reactants, reaction time, reaction temperature...
by adjustment mol ratio of NH2-BDC/Fe3+ from 0.5:1 to 2:1; reation
time is 4, 6, 8, 10 hours; reaction temperature is 60, 80, 100oC.
2.1.5. Synthesis of Fe-BDC, Fe2Ni-BDC
2.1.5.1. Synthesis technique of Fe-BDC
Fe-BDC was synthesized by solvothermal method. Typically, a
mixture of FeCl3.6H2O, H2BDC and DMF were dissolved with mol ratio
of which were 1:1:280, respectively. A mixture of FeCl3.6H2O and 160
mL DMF were dissolved and then added gently 1.235 g H2BDC acid in
the solution and stirred continually until the solution was
transmisparent, yellow and pH of which was 6. After that, the solution
was poured into autoclave reactor and heated at 110oC for 10 hours. The
product was washed 2 times by DMF and washed 2 times by ethanol at
70oC. Finally, the product was filtered and heated at 60oC for 5 hours
and maintained in vacuum condition.
2.1.5.2. Synthesis of Fe2Ni-BDC
Fe2Ni-BDC was synthesized by solvothermal method. Typically,
prepared a mixture of [FeCl3.6H2O + Ni(NO3)2.6H2O] and H2BDC and
DMF with mol ratio were 1:1:280, respectively and mol ratio of
FeCl3.6H2O/Ni(NO3)2.6H2O were 2:1. The mixture of FeCl3.6H2O,
Ni(NO3)2.6H2O and 160 mL DMF were dissolved and then added gently
1.235 g H2BDC acid in the solution and strirred continually until the
solution was transmisparent, yellow and pH=6. After that, the solution
was poured into autocalve reactor and heated at 110oC in 10 hours. The
product was washed 2 times by DMF at room temperature and washed 2
5
times by ethanol at 70oC. Finally, the product was filtered, heated at
60oC for 5 hours and maintained in vacuum condition.
2.2. Photocatalytic degradation of TNT/TNP solutions using FeMOFs materials
Photocatalytic degradation tests were carried out by dispersion of
MOFs materials in TNT/TNP solutions, the reacted solution were
poured into a 250 mL glass beaker and magnetic stirred with speed of
300 rpm, the period temperature were controlled at room temperature,
under simulated sunlight conditions (Philips LED lights, 40 W power,
1200 lux intensity, 440-415 nm wavelength, 4 - 6% UV light).
Experiments were performed with 100 mL of TNT / TNP solutions,
Fe-MOFs catalytic dosage were 0.5 g / L, adding 0.4 mL of 30% H2O2
solution (0.05 M) for reaction times of 15, 30, 45, 60 minutes, after each
period time took 2 mL of sample, filted and analyzed HPLC, TOC to
determine the concentration of TNT / TNP. Determination of adsorption
characteristics of synthesized materials was carried out the same in the
dark condition.
2.2.1. Study on the effect of factors on photocatalyst degradation
TNT solution using Fe-BDC-NH2 materials
Study on the effect of factors such as: content of catalyst, luminous
intensity, initial concentration of TNT solution, pH, temperature and
content of additive H2O2.
2.2.2. Study on recyclability of catalytic materials
The photocatalytic experiments were repeated several times with
100 mL of TNT solution of 50 mg/L, with pH = 7, a catalyst content of
0.5 g/L, adding 0.4 mL of 30% H2O2 solution. Photocatalytic reactions
were performed at room temperature and take samples for analysis
every 60 minutes. For the second, third and fourth experiments, the
solution was regenerated and calculated to add a content of TNT so that
concentration of TNT in solution is 50 ppm.
2.3. Analysis techniques for investidation of photocatalytic activity.
2.3.1. Analysis technique to characterization
The modern physical and chemical analysis techniques were used to
analyze and evaluate properties synthesized material consist of XRD,
FT-IR, SEM, TGA, BET, EDX, XPS, UV-Vis-DRS.
2.3.2. Analysis technique to evaluate treated wastewater samples
The efficiency of photocatalytic degradation was determined by
using HPLC and TOC technique.
6
Chapter 3. RESULT AND DICUSSION
3.1. Synthesis of Fe-BTC
3.1.1. Study on the effect of some factors on the synthesis of Fe-BTC
material
3.1.1.1. The effect of H3BTC/Fe3+ contents
Fe-BTC materials were synthesized for 8 hours, at 100oC, with mol
ratio of H3BTC/Fe3+ in turn are: 0.5:2; 1:2; 1.5:2; 2:2. Synthesized
reaction equation is followed:
Fe(NO3)3.9H2O + H3BTC → Fe3O(H2O)2(OH)(BTC)2.nH2O + H2O
+ HNO3
XRD patterns in Figure 3.1 showed that sample M1.1-2 had peaks
of Fe-BTC with high intensity, and position of the peaks at 2θ = 6.03o;
6.6o; 10.59o, 11.12o were similar to XRD patterns of MIL-100 in
previous works, thus synthesized Fe-BTC material was MIL-100(Fe).
When mol ratio of H3BTC/Fe3+ was 0.5:1 (M2.0,5-1 sample), acid
concentration was not enough to form crystalline structure of Fe-BTC
material. XRD patterns of the samples with high molar ratio of
H3BTC/Fe3+ (M1.1,5-2, M1.2-2) had low intensity of specific peaks,
simultaneously the presence of other peaks were ascribed to diffracted
peaks of H3BTC acid. M1.1-2 sample was considerred as the most
similar to MIL-100(Fe) reported previously. Therefore, the H3BTC/Fe3+
molar ratio of 1:2 was chosen as optimized ratio to synthesize Fe-BTC
material.
Figure 3.1. XRD patterns of synthesized Fe-BTC material with the
different molar ratios of H3BTC/Fe3+
3.1.1.2. Effect of temperature on the MOF formation
Formation of Fe-BTC materials was investigated at various
temperatures such as 60oC, 80oC and 100oC. The reaction time of the
7
refluxing process was 8 hours and the molar ratio of H3BTC/
Fe(NO3)3.9H2O/H2O was 1:2:280.
The synthesized Fe-BTC materials is investigated by XRD analysis
with 2θ from 5 to 35o. XRD patterns showed that the materials have
similar structure reported previously without any byproduct. All
investigated materials had the specific peaks at same positions. The
material synthesized at 80oC revealed the highest crystalline intensity
peaks. The result was in consistent with published reports.
3.1.1.3. Effect of reaction time on MOF synthesis
Fe-BTC materials reaction were caried out for different period of
time such as 4; 6; 8 and 10 hours. The temperature of reaction was held
at 80oC and the mol ratio of H3BTC/ Fe(NO3)3.9H2O/ H2O was 1:2:280.
The synthesized Fe-BTC materials were investigated by XRD
analysis with 2θ from 5 to 35o. XRD patterns showed that the materials
had similar structure without presence of byproduct. All investigated
materials had the specific peaks at same positions. The material
obtained with 8h of reaction time revealed the highest crystalline
intensity peaks. The result is consistent with published reports.
XRD patterns in 3.4 showed that M1-4h sample had the lowest
intensity specific peaks, while M1-8h and M1-10h have the highest
intensity peaks. No impurity peaks were observed in all samples.
Therefore, the reaction time of 8 hours was chosen as optimal reation
time. The result is similar to published reports.
Figure 3.4. XRD patterns of synthesized Fe-BTC with various reaction
time
3.1.2. Synthesizing procedure of Fe-BTC
Based on the investigations of the influencing factors on the MOFs
synthesis as well as selection of optimal reaction condition, synthesized
8
procedure of Fe-BTC material in lab scale by refluxing method with
H3BTC: Fe(NO3)3.9H2O: H2O molar ratio of 1:2:280 was established as
following:.
A mixture of 4.07 g Fe(NO3)3.9H2O and 1.05 g H3BTC was
dissolved in 50.4 mL distilled water. The solution was homogenised on
magnetic stirred for 30 minutes and then poured into three neck flask
and sitrred for 15 minutes. The refluxing condenser system was
installed, magnetic stirring speed was adjusted about 300 rpm. The
system was heated to 80oC and maintained for 8 hours. The product was
washed three times by distilled water and washed three times by ethanol
at 70oC. Finally, the product was filtered and heated at 60oC for 10
hours. Obtained Fe-BTC material is pink, the yield of the synthesis
process was 66,8%.
Figure 3.5. Diagram of synthesis procedure of Fe-BTC material
3.1.3. Characteristic of synthesized Fe-BTC material
Structural investigation of synthesized Fe-BTC material was
analyzed as follow:
XRD pattern of synthesized Fe-BTC material showed in Figure 3.6
and indicated that the presence of peaks at 2θ = 5.3o; 6.03o; 6.6o; 10.59o;
11.12o; 20.15o; 27.79o. In which the peaks at 2θ = 6.03o; 6.6o; 10.59o;
11.12o were specific peaks of MIL-100(Fe) materials. XRD pattern
showed that the peaks were very sharp and high intensity which
approved material had high crystalline. This result was consistent with
published results.
9
Figure 3.6. XRD patterns of synthesized Fe-BTC material
IR spectrum of synthesized Fe-BTC material was showed in Figure
3.7. Several main vibrations included:
- The band at wave number 585 cm-1 corresponds to metal-O bond.
- The strong band at 712 cm-1 corresponds to bending vibration of
C-H bond in benzene ring.
- The stronger band at 1382 represents C-O valence vibration in
carboxyl group.
- The present of the band at 1634 cm-1 results from the stretching
vibration of C=C bond.
- Finally, the other band at 3443 cm-1 corresponds to stretching
vibration of O-H bond in H2O molecular in structure.
Figure 3.7. FT-IR spectrum of synthesized Fe-BTC material
Figure 3.8. SEM image of synthesized Fe-BTC material
The crystals of synthesized Fe-BDC-NH2 material were in
hexagonal shape with the average dimension of 0.5÷1 µm (Figure 3.8).
10
BET result of Fe-BTC material showed that surface area was 1777 m2/g,
volume of porous hole was 0.85 cm3/g. TGA result indicated that
synthesized material was resisted the elevate temperature of 346oC.
3.2. Synthesis of Fe-BDC-NH2
3.2.1. Study on the effect of reaction conditions on the synthesis of
Fe-BDC-NH2
The thesis studied on the optimal conditions to synthesize Fe-BDCNH2 by refluxing approach.
3.2.1.1. Effect on the molar ratio of NH2-BDC to Fe3+
The materials were synthesized at 80oC for 8 hours, with molar
ratios of NH2-BDC/Fe3+ were 0.5:1; 1:1; 1.5:1; 2:1. Reaction equation
was showed as following:
FeCl3.6H2O + H2N-BDC → Fe3O(H2O)2(OH)(H2N-BDC)3.nH2O + HCl
+ H2O
Figure 3.11. XRD patterns of resultant Fe-BDC-NH2 compounds with
different molar ratios of NH2-BDC/Fe3+
Figure 3.11 show the XRD patterns of MOFs materials obtained
with various molar ratios. When molar ratio between NH2-BDC/Fe3+ is
0.5:1 (M2.0,5-1 sample), acid concentration was not enough to form
crystalline structure of Fe-BDC-NH2 material, thus obtained product
showed amorphous nature. XRD patterns of the samples with high
molar ratio of NH2-BDC/Fe3+ (M2.1,5-1, M2.2-1) had low intensity of
specific peaks which characterize for Fe-BDC-NH2 material, moreover
the presence of impurity peaks were characteristic difraction peaks of
NH2-BDC acid. M2.1-1 sample with NH2-BDC/Fe3+ molar ratio 1:1 had
specific peak of Fe-BDC-NH2 at 2θ = 9.12o; 9.74o; 18.90o with high
intensity. The result was consistent with previous reports. Therefore, the
11
NH2-BDC/Fe3+ molar ratio of 1:1 was chosen as optimal ratio to
synthesize Fe-BDC-NH2 material.
3.2.1.2. Effect of DMF contents
Figure 3.12. XRD patterns of synthesized Fe-BDC-NH2 materials with
different content of solven
XRD patterns in Figure 3.12 showed that DMF content significantly
affected crystalline intensity of Fe-BDC-NH2 materials. It has been
known that DMF was suitable solvent for the synthesis of Fe-BDC-NH2
material. This could be explained that DMF was polarized solvent
which have high dissolving ability toward the organic acids. As a result,
the process of crystalline development of Fe-BDC-NH2 occurred facily.
However, when content of DMF solvent was higher than the optimized
condition, crystalline intensity of synthesized material would decrease.
The highest crystalline of Fe-BDC-NH2 was obtained M2-140dm
sample with NH2-BDC : Fe3+ : DMF molar ratio of of 1:1:140.
3.2.1.3. Effect of temperature of refluxing condensation on the synthesis
of Fe-BDC-NH2 material
XRD patterns of the synthesized materials at different refluxing
temperatures were shown in Figure 3.13:
The result indicated that the refluxing temperature greatly affected
to crystalline nature of Fe-BDC-NH2 materials. At low temperature, the
crystallisation occurred slowly. When the refluxing temperature
increased, crystalline structure increase. At 80oC, synthesized material
had the high crystalline intensity. Thus, the high temperature promoted
formation and development of crystall. However, the refluxing
condensation required the continuous stirring to increase possibility of
the reaction, therefore the low temperature was more suitable for
crystallization of this MOFs. The chosen refluxing temperature was
80oC.
12
Figure 3.13. XRD patterns of synthesized Fe-BDC-NH2 materials at
different refluxing temperatures
3.2.1.4. Effect of the refluxing time on the synthesis of Fe-BDC-NH2
material
The refluxing time was an important factor that affected to the
synthesis of Fe-BDC-NH2 material. XRD patterns in 3.14 showed that
M1-4h sample had the lowest intensity specific peaks, while M1-8h and
M1-10h had the highest intensity peaks. All samples are without the
presence of impurity peaks. Therefore, the refluxing time was selected
to be 8 hours. The result is consistent with published reports.
Figure 3.14. XRD patterns of Fe-BDC-NH2 materials synthesized in the
different refluxing times.
3.2.2. Synthesized procedure of Fe-BDC-NH2 material
The investigations of the influencing factors has established a
following synthesized procedure of Fe-BDC-NH2 material in lab scale
by refluxing method with NH2-BDC: Fe3+: DMF molar ratio of 1:1:140.
A mixture of 0.72 g FeCl3.6H2O is dissolved in 28 mL DMF. The
solution is homogenised on magnetic stirred in 30 minutes, added 0.48g
NH2-BDC, poured into three neck flask and sitrred in 15 minutes. Install
13
reflux condenser, adjust magnetic stirring speed about 300 rpm, heat to
80oC and maintain in 8 hours. The product is washed three times use
distilled water and three times use ethanol at 70oC. Finally, the product
is filtered and heated at 60oC in 10 hours. Obtained Fe-BDC-NH2
material is pink, the yield of the synthesis process was 58%.
Figure 3.15. Diagram of synthesized procedure of Fe-BDC-NH2
material
3.2.3. Characteration of synthesized Fe-BDC-NH2 material
Structural characteristic of synthesized Fe-BDC-NH2 material was
analyzed by IR spectrum. IR spectrum of synthesized Fe-BDC-NH2
materials was showed in Figure 3.16.
Some main vibrations include:
- The band at wave number 520 cm-1 corresponds to Fe-O valence
vibration in FeO6 octahedra.
- The strong band at 768 cm-1 corresponds to bending vibration of
C-H bond in benzene ring.
- The strong band at 1255 cm-1 corresponds to vibration of C-N
bond.
- The stronger band at 1381 represents C-O valence vibration in
carboxyl group.
14
- The present of the band at 1578 cm-1 results from the stretching
vibration of C=C bond.
- Finally, the other band at 3334 cm-1 corresponds to stretching
vibration of N-H bond in amin group.
IR spectrum of synthesized Fe-BDC-NH2 are consistent with
previous works.
XRD pattern of Fe-BDC-NH2 exhibits four peaks at 2θ = 9.12o;
9.74o; 18.90o; 28.36o with high intensity, which are similar to NH2-MIL88B reported previously [67], therefore resultant Fe-BDC-NH2 was
NH2-MIL-88B(Fe). In addition, XRD pattern also indicates that the
obtained MOFmaterial is highly crystalline without the presence of
impurity. This result exhibit that the synthesized material was relative
pure. The result was consistent with previous reports.
Figure 3.16. IR spectrum of Fe-BDC-NH2
Figure 3.18. XRD pattern of synthesized Fe-BDC-NH2
Morphology of the material was determined by SEM analysis. The
crystals of Fe-BDC-NH2 were hexagonal shape with the length of 1.5
µm and the width of 0.3 µm.
15
Figure 3.19. SEM image of synthesized Fe-BDC-NH2
The porosity of synthesized material including surface area and
porous volume was analysed by Quantachrome equipment. The porosity
of prepared material was determined by BET technique. The result
showed that the material had a relative high surface area of 560 m2/g.
The result of TGA analysis indicated that the material is stable at high
temperature, only decompose after 346oC.
3.2.4. The stability of synthesized Fe-BDC-NH2
3.2.4.1. The stability of the material in ambient conditions
The result showed that synthesized Fe-BDC-NH2 was stable in
ambient condition and the structure of the material was not changed
after three months exposure. Thus, prepared Fe-BDC-NH2 had a good
resistance to the ambient condition and can be stored in room
temperature for long time.
3.2.4.2. The stability of the material in salty medium and dilute H2O2
solution
The result showed that synthesized Fe-BDC-NH2 was quite stable in
salty medium and diluted H2O2 solution in period of time. Thus,
synthesized Fe-BDC-NH2 can be employed as a photocatalyst in salty
medium.
3.3. Synthesis of Fe-BDC, Fe2Ni-BDC
3.3.1. Synthesis and characterizer of Fe-BDC
The material based on Fe-BDC was synthesized by solvothermal
method with FeCl3.6H2O : H2BDC : DMF molar ratio of to 1:1:280.
FT-IR and XRD patterns of synthesized Fe-BDC material were
showed n Figure 3.23, 3.24, the peaks were consistent with published
samples.
SEM image showed that synthesized Fe-BDC material has granular
shape of octagon or polyhedron, with dimension in range of from 500
nm to 3 µm. BET image showed that surface area of synthesized
materialis approximately 259 m2/g with pores volume of 0.1 cm3/g
corresponding to mesoporous material. The result of TGA analysis
16
indicated that the decompose of material only occurs at temperature of
higher than 410oC.
Figure 3.23 XRD pattern of Fe-BDC material
Figure 3.24. FT-IR pattern of Fe-BDC material
3.3.2. Characterisation of synthesized Fe2Ni-BDC material.
Results from FT-IR and XRD patterns of synthesized Fe2Ni-BDC
are consistent with the published reports.
Element compositions in synthesized Fe2Ni-BDC material was
determined by using EDX spectroscopy. The result indicated atomic
percentage of elements in synthesized Fe2Ni-BDC material consist of
57.54% C; 35.32% O; 4.86% Fe and 2.28% Ni. These results were in
agreement with theory component in assumption molecular formula of
synthesized material. Thus, it can be concluded that Fe and Ni were
involved into construction of Fe2Ni-BDC crystals.
The SEM image showed the synthesized Fe2Ni-BDC material has
uniform octagonal shape with dimension in range of from 200 to 300
nm. The BET result indicated that the material has surface area of about
589 m2/g and pore volume of about 0.45 cm3/g corresponding to
mesoporous material. The result of TGA analysis indicated that the
material had heat resistance at 455oC.
17
Figure 3.28. FT-IR spectrum Fe2Ni-BDC material
Figure 3.29. XRD pattern of Fe2Ni-BDC material
3.4. Study photocatalytic performance of synthesized Fe-MOFs
materials as photocatalyst for degradation of TNT, TNP
3.4.1. Adsorption behavior of the synthesized Fe-MOFs
In order to determinate adsorption behavior, tests were performed in
dark condition with initial concentration of TNT 50 ppm and Fe-MOFs
dose 0.5 g / L. The results showed that, in the first 15 minutes, the
concentration of TNT in all solutions decreased quickly, proving that in
this period all 4 materials have high adsorption capacity for TNT and
saturated adsorption obatained for 1 hour, concentration of TNT
decreased from 72 to 83%. Among them, Fe2Ni-BDC has the lowest
adsorption capacity (72%), Fe-BDC-NH2 has the best adsorption
capacity (83%) for TNT. This may be explained that because iron can
form complexes with some organic compounds to increase the
adsorption capacity of Fe-MOFs materials. These results are consistent
with other studies when using MOFs base on Fe as adsorbent.
3.4.2. Photocatalytic performance of the synthesized Fe-MOFs
In order to study the photocatalytic characteristic of Fe-MOFs
materials, optical properties of materials were measured by UV-VisDRS method and energy band gap of the materials determined by the
Tauc-Plot method. The results showed that the light absorption area of
Fe-MOFs materials stretched from the UV region to the visible area.
18
Using Tauc - plot and Kubleka - Munk function, the energy band gap of
synthesized Fe-MOFs materials were also determined respectively: FeBDC (2.65 eV), Fe2Ni-BDC (2.6 eV), Fe-BTC (2.8 eV), Fe-BDC-NH2
(2.1 eV). These values are consistent with other studies. Thus, all
synthesized materials can have photocatalytic acitivity in visible light
areas or simulated sunlight with energy of ≥ 2.8 eV, equivalent
wavelengths from 440 nm. For this thesis, in order to ensure the
accuracy and stability of the studies, all photocatalyst experiments were
performed with simulated solar light source (40 W capacity, wavelength
440 -415 nm).
Concentration of TNT in degraded solution using various MOFs
materials were analyzed HPLC and the results were shown in Figure
3.36.
Figure 3.36. Photocatalytic degradation of TNT using synthesized FeMOFs materials
(100 mL initial concentration of TNT 50 ppm; 0.5 g/L catalyst dose; 0.4
mL H2O2 30%; room temperature; pH7)
Figure 3.36 show that photocatalytic degradation of TNT using FeMOFs catalytic materials in simulated light condition with the presence
of H2O2 were quickly and different from adsorption reaction of TNT.
After 15 minutes, transformed ratio of TNT obtained from 40 to 61%
and after 60 minutes, transformed ratio obtained respectively: 96,5%
(Fe-BTC); 97,8% (Fe-BDC); 99% (Fe2Ni-BDC) and 100% (Fe-BDCNH2).
3.4.3. Compararison TNT photocatalytic degradation performance
of synthesized MOFs materials with commercial TiO2
Photocatalytic degradation of TNT by synthesized Fe-MOFs
materials were studied in comparison with photocatalytic degradation
using commercial TiO2 (P25 grade). Figure 3.37 show that in UV light
19
condition, degradation rate of TNT were 62% (TNT/TiO2/UV) and 84%
(TNT/TiO2/H2O2/UV) for 1 hour and after 2 hours for TiO2 and the 75%
(TNT/TiO2/UV) and 98% (TNT/TiO2/H2O2/UV) for the prepared MOFs
material. This indicats that the synthesized Fe-MOFs materials has
higher photocatalytic activity than that of TiO2.
3.4.4. Study on the effect of factors on photocatalytic degradation of
TNT
Fe-BDC-NH2 was employed to study the effect of various factors on
the photocatalytic degradation of TNT.
Through the study on the factors affecting TNT treatment
efficiency, we selected the optimal conditions for photocatalytic
degradation of 100 mL of 50 ppm TNT solution: 0.05 g Fe-BDC-NH2
materials dose; 0.4 mL of 30% H2O2 solution, pH 7, at room
temperature. Conversion efficiency of TNT obtained nearly 100%,
mineralization obtained 99% for 1 hour. Fe-MOFs materials have high
catalytic activity, stability and can be reused many times.
3.4.5. Study on the photocatalytic degradation of TNP in aqueous
medium using the synthesized Fe-MOFs materials.
Fe2Ni-BDC and Fe-BDC-NH2 were employed to investigate of the
photocatalytic degradation of TNP. Experiment was carried out with
TNP solutions of 50 ppm, 0.5 g /L Fe-MOFs dose, added 30% H2O2
solution, in simulated sunlight conditions. Photocatalytic experiments
were performed after the material was saturated. The results are shown
that the photocatalytic degradation of TNP when using Fe-MOFs
catalysts is similar to TNT but with faster performance. After 60
minutes, the degradation reaction of TNP is almost complete for both
Fe2Ni-BDC and Fe-BDC-NH2. Thus, photocatalytic materials based on
Fe-MOFs can remove thoroughly toxic aromatic nitro compounds out of
wastewater in explosive production.
3.5. Mechanism of photocatalytic degradation of organic
compounds using Fe-MOFs materials
3.5.1. Mechanism of photocatalytic degradation of organic
compounds
The mechanism of photocatalytic reaction has also been studied.
Because Fe-MOFs contain Fe-oxo clusters, they have semiconductor
properties. Thus, Fe-MOFs materials have been studied and used as
photocatalytic materials to effectively remove several organic
compounds.
20
In order to confirm this claim, some authors have used free radical
quenchers to stop photocatalytic reaction. Based on this idea, we chose
some free radical quenchers to investigate the effect of these agents on
the photocatalytic degradation of TNT degradation with the precense of
Fe-BDC-NH2 catalytic material.
Firstly, 2 mL these free radical quenchers were added to 100 mL of
50 ppm TNT solution with 0.5 g/L Fe-BDC-NH2 dose. The next steps
are similar to the testing process of photocatalytic activity. The results
are shown in Figure 3.46.
Figure 3.46. Photocatalytic degradation of TNT using Fe-BDC-NH2
with the presence of free radical quencher
The results showed that when using free radical quenching agents,
TNT conversion rate decreased significantly. Specifically, when using
AO and DMSO, the degradation efficiency of TNT decreased
significantly to 30% and 36%, respectively. Therefore, it can be
concluded that free radicals play an important role in the photocatalytic
degradation of TNT. In particular, photogenerated electron-hole pairs
are the two main factors that determine the formation of free radical.
The results demonstrated that degradation reaction of TNT is
characterized by free radical mechanism of Fe-MOFs materials which
have photocatalytic acitivity. And the reaction is not under any other
process such as adsorption or thermal decomposition.
Thereby, we suggest the mechanism of photocatalytic
decomposition of TNT, TNP by Fe-MOFs materials with the presence
of H2O2 is as follows: in which, H2O2 plays a role as a photogenerated
electron trapper which help to prevent the recombination of electron (e-)
and hole (h+) and form more free radicals and improve effiecncy of
photocatalytic process.
Fe-MOFs + hν → e-(MOFs) + h+(MOFs)
21
e-(MOFs) + O2 → MOFs + •O2h+(MOFs) + H2O → •OH + H+ + MOFs
eCB
+ H2O2 → OH- + •OH
•
O2-+ H2O2 → OH- + •OH + O2
•
OH + TNT/TNP → non toxic product
•
O2- + TNT/TNP → non toxic product
3.5.2. Diagram of photocatalytic degradation of TNT using FeMOFs materials
The concentration of TNT in solution was deteminated by HPLC
method at certain time points (30 and 60 min) which are shown on
Figure 3.47.
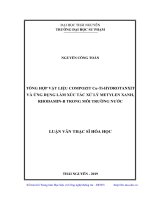
Figure 3.47. HPLC diagram of TNT’s concentration in photocatalytic
degradation of TNT/Fe-BDC-NH2/H2O2 system:
initial sample (a), after 30 minutes (b) and afer 60 minutes (c)
The results showed that TNT peaks at 4.1 retentive minutes. After
30 minutes of treatment, intensity of TNT’s peak decreases and new
peaks appear at tR (retention time) = 1.6 minutes; 2.3 minutes; 3.4
minutes... with different intensities which are peaks of organic
intermediate productsof photocatalytic degradation of TNT. After 60
minutes of treatment, on the HPLC diagram, only trace amounts of