Đặc điểm lâm sàng, cận lâm sàng, các yếu tố nguy cơ đột quỵ của nhồi máu não cấp ở bệnh nhân rung nhĩ không do bệnh van tim tt tiếng anh
Bạn đang xem bản rút gọn của tài liệu. Xem và tải ngay bản đầy đủ của tài liệu tại đây (789.49 KB, 25 trang )
1
INTRODUCTION
Atrial fibrillation is a common arrhythmia of which prevalance increases with ages; at
1% in adults and up to 9% in patients over 80 years old. The hardship of atrial fibrillation related
diseases includes hospitalizations due to hemodynamic disorders, occlusions, heart failure,
stroke and death. These conditions usually occur when there are structural or
electrophysiological abnormalities of the atria that cause abnormal impulses and/or conduction.
They are characterized by rapid and irregular depolarization of the atria, and together with the
lack of P waves on the electrocardiogram, promote the formation of blood clots and
consequently increase the risk of stroke. Rates of stroke recorded in patients with atrial
fibrillation are 7.04% in China; 4.9% in Taiwan, and 13.3/1,000 in Japan. The risk of annual
stroke in atrial fibrillation patients reported in community-based studies worldwide is 1.09%.
The Framingham study has showed a five-fold increase in the incidence of overall stroke in
patients with atrial fibrillation. In Vietnam, regardless of the lack of national and systematic
statistics, from a number of studies, frequency of atrial fibrillation in celebral stroke patients is
estimated from about 5%/year (Pham Quoc Khanh- 2010) up to 17.3% (Nguyen Duc Long2014).
The urgency of the thesis
Atrial fibrillation causes the formation of thrombosis in atrial chambers, usually
originating from the left atrium, and therefore requires preventive treatment. For valvular atrial
fibrillation (artificial heart valve, valve repair surgery, moderate to severe mitral stenosis), antivitamin K with INR (International Normalized Ratio) are prescribed to reach a level of 2.0 to
3.0. For non-valvular atrial fibrillation, the thromboprophylaxis strategy is based on stroke risk
stratification system using the Cha2DS2-VASc scale, and oral anticoagulants (NOACs-New
oral anticoagulants) are additionalled prescribed. While cerebral infarction from valvular atrial
fibrillation has been well studied, there are still many questions about those from non-valvular
atrial fibrillation. In some prognosis stroke models, predicting factors often include atrial
fibrillation as an important risk factor besides the NIHSS (National Institutes of Health Stroke
Scale).
Bayesian Model Averaging (BMA - Bayes inference model) is one of the most popular
modelling methods currently utilized worldwide instead of the stepwise regression method. The
basis of this method is to choose the optimal model based on not only the interaction between
important groups of variables but also actual clinical conditions, instead of just calculating one
final model. final. Building regression models concurrently with the development of a
nomogram to predict the mortality risk in patients with stroke with nonvalvular AF has attacted
many interests because of its usability and flexibility.
Study’s Objectives:
1. Describe the clinical and subclinical characteristics of acute cerebral infarction in
patients with nonvalvular atrial fibrillation.
2. Identify risk factors for stroke in patients with acute cerebral infarction with
nonvalvular atrial fibrillation
3. Develop a prognostic model of 30-days mortality in patients with acute cerebral
infarction with nonvalvular atrial fibrillation.
Thesis significance:
Develop a prognostic model of 30-days mortality in patients with acute cerebral
infarction with nonvalvular atrial fibrillation.
2
Thesis content:
This 99-pages thesis includes: Introduction (3 pages), Literature review (36 pages),
Study method and population (12 pages), Results (23 pages), Discussion (21 pages), Conclusion
(3 pages), and Recommendation (1 page).
Chapter 1
LITERATURE REVIEW
1.1. Overview of nonvalvlar atrial fibrillation
1.1.1. Definition of atrial fibrillation
Atrial fibrillation is classified as a supraventricular arrhythmia characterized by an
electrial asymmetry and atrial muscle contraction with following ECG features: varying R-R
intervals (while with good atrioventricular conduction), no signs of P waves, irregularities of
atrial waves. Atrial fibrillation causes hemodynamic consequences associated with abnormal
ventricular responses (too fast or too slow) and ataxia between atrial and ventricular. Atrial
fibrillation’s symptoms are varried: from asymptomatic to fatigue, nervousness, shortness of
breath, or severe symptoms such as hypotension, fainting, or heart failure. Atrial fibrillation
increases the risk of stroke and/or peripheral embolism due to the formation of thrombus in
atrial chambers. Onset is usually in the left atrium.
1.1.2. Classification of atrial fibrillation
In 2016, the Vietnamese Cardiologists Association classified AF based on the time
course:
- Paroxysmal: ends spontanously, usually within 7 days of onset. The attacks may
reappear with varying frequencies.
- Persistent: continuous appearance lasting over 7 days.
- Permanent: appears continuously for more than 12 months.
- Chronic: atrial fibrillation cannot restore and/or revert sinus rhythm.
- Nonvalvular AF: atrial fibrillation occurs when there is no mitral stenosis due to rheumatic
heart, no mechanical or biological valve or repair mitral stenosis.
1.2. Ischemic stroke in patients with Nonvalvula
1.2.1. Concept
Stroke: loss of functions of localized nerves from any cause. Commonly used
interexchangeable with acute stroke due to insufficient blood flow.
Acute ischemic stroke: Acute focal neurological defects appear acutely due to
insufficient blood flow.
Cerebral infarction: A region of tissues that dies as a result of anemia.
1.2.2. Pathophysiology of cerebral infarction stroke
1.2.2.1. Pathophysiologic mechanism
At first, the inner layer of the atherosclerotic wall becomes rough, enabling platelets to
attach. Since thromboembolism is made of platelets, it is unstable and fragile, and may dissolve
on its own. Also, collateral circulation may be formed to promptly compensate for the anemic
area, resulting in full clinically recovery within 24 hours. In the later stage, atherosclerosis also
contains red blood cells and attached blood fibers, causing blood clots more durable. Thus,
when it sloughs off to the brain, it clogs and causes ischemia.
1.2.2.2. Mechanism of recovery
When a stroke occurs, on average every minute, millions of brain cells die in the
damaged brain areas due to blocked arteries. The most serious damage is the necrotic area
3
because this is an non-recoverable area. The cells surrounding the affected area in the stroke
are called “light murals”/“Grey zones” (or “treatment areas”) - although not dead, they have
reduced metabolism to a minimum and almost lost all functions. The goal of treatment is to
restore those areas and restore their activities.
1.3. Prognostic models of risk factors of nonvalvular AF
1.3.1. Prognosis studies related to stroke with valvular and/or nonvalvular AF in several
hospitals national wide
In 2016, Dang Viet Duc et al. conducted a study to investigate the relation and prediction
coronary artery disease and Cha2DS2-VASc and Cha2DS2-VASc-HS scores on 94 patients
with coronary artery lesions images, and found that Cha2DS2-VASc average score was 3.55 ±
1.29 and that of Cha2DS2-VASc-HS was 5.13 ± 1.46. On coronary angiography image results:
average Gensini lesions score was 22.7 ± 20.5. 73 patients (77.7%) showed a significant
coronary artery stenosis (≥ 50% of vascular diameter). The area under the ROC evaluates
prediction of coronary artery diseases of Cha2DS2-VASc and Cha2DS2-VASc-HS scores with
areas under the curve (AUC) of 0.77 and 0.81 respectively; The corresponding cut-off points
of the two scales are 3.5 and 4.5 with a sensitivity of 57.5% -72.6% and specificity 81% -71.4%.
The Cha2DS2-VASc and Cha2DS2-VASc-HS scales have a strong correlation with coronary
artery damage on the Gensini scale with r = 0.64 and 0.69 with p <0.05.
In 2018, Nguyen Huy Ngoc conducted a study of 308 60+ years-old patients with acute
ischemic stroke at Phu Tho General Hospital to determine disease’ independent predictive
factors and found that: factors statistically predicting more serious progression during the first
3 days of hospitalization are: having to need supporting oxygen (69.2%); Glasgow coma (below
13 points 31.2%; less than 8 points 5.2%; 8 to 12 points 26.0%) and number of risk factors (two
factors 28.3%; three factors 17 , 9%). The study also showed more severe consequences in
patients over 75 years of age. Other factors include NIHSS score and clinical severity. In
patients older than 75yo, factors prior to ischemic stroke, including age, gender, and functional
status, were identified as independent predictors.
1.3.2. Prognosis model by Bayesian Model Averaging (Bayesian Model Averaging) and
some initial studies in Vietnam
Linear regression model is one of the most popular statistical models. It is the foundation
for many other regression models such as logistic regression, binomial regression, and Poisson
regression. In research, there are two common types of data: quantitative and qualitative data.
Any type can be an important determinant of research results. The most common method to
solve problems related to directly impact edfactors is “stepwise regression”. However, this
approach often proposes non-optimal results because the provided final model often includes
some unimportant (false positive) variables. Therefore, BMA has recently become one of the
most widely used and error-minimizing methods nowaday. This is a method based on the
Bayesian statistical principle, in which each model has a predetermined probability. When in
conjunction with actual data, the model can determine variables most related to research
outcomes. Unlike stepwise regression which proposes only one final model, BMA offers the
best 5 models, consequently providing a variety of options depending on implementabilities
and actual circumstances /feasibility/flexibility of the model. For each model, BMA reports
regression coefficients for each prognostic variable, coefficient R2 (coefficient that explains the
percentage of variance of model); BIC values (Bayesian Information Criterion - coefficient
“penalty” for the model) and post-probability (post prob - probability of the model appearing
4
in 100 replicates). A nomogram will be developed to specify the prognostic scale to facilitate
the evaluation process.
Ha Tan Duc (2015) used BMA on 2,180 general emergency medical patients at Can
Tho Central General Hospital who were admitted to the Emergency Department between March
13, 2013 and June 1, 2013. Main outcome was 30-days mortality, evaluated based on clinical
characteristics and medical history. Cox regression was used to analyze the association between
mortality and risk factors to develop a prognosis model of mortality from non-invasive clinical
parameters (gender, breathing rate, SpO2, Glasgow coma and treatments in the Department of
Emergency Medicine). His study shows that these indices are well-delineated, helping to
identify the high mortality risk for internal medicine conditions. The selected BMA model has
an AUC of 0.842 (95% confidence interval from 0.809 to 0.875). The author also developed
two graphs of mortality prognosis based on nomogram - the procedure used instead of other
complex tools to predict prognosis and mortality at admission beds, circumstance of ER.
Chapter 2
STUDY’S POPULATION AND METHOD
2.1. Research subjects
2.1.1. Inclusion Criteria
- Over the age of 18, regardless of gender and occupation, consented to participate in and to
comply with study requirements. Patients who agree to participate will sign an informed consent
form.
- Patients diagnosed with acute stroke (≤ 24 hours) caused by cerebral infraction from nonvalvular AF (in the study group) or without AF (in control group), including newly discovered
intermittent atrial fibrillation at the time of the study or in history (see research criteria in section
2.3.6)..
2.1.2. Exclusion criteria
- (Cerebral) hemorrhagic strokes
- Stroke from cerebral infraction which already passed the acute stage or brain infarction due
to tumors or injuries.
- With valvular heart disease with or without atrial fibrillation according the Vietnam National
Heart Association’s 2015 diagnosis guideline, including: rheumatic mitral valve stenosis,
rheumatic aortic valve stenosis, using mechanical or biological valves, or after heart valve
repair surgery.
2.2. Place and time of the study
The study was conducted on 289 patients admitted to the Emergency Department of
Bach Mai Hospital and the Vietnam National Heart Institute from March 1, 2013 through
December 31, 2017, splitting into two groups:
- Study group includes 138 patients diagnosed with acute cerebral infarction with nonvalvular AF.
- Control group consists of 151 patients with acute cerebral infarction with neither atrial
fibrillation nor heart valve diseases.
2.3. Methods
2.3.1. Study design
This is a case-control study, in combination with descriptive, analytical, and
longitudinal follow-up on the targeted groups who have acute stroke with AF (study group) or
5
without AF or (sinus rhythm - control group) not due to valvular heart diseases who were
admitted at Bach Mai hospital’s ER.
2.3.2. Study sample
The sample was targeted. The sample size was calculated in accordance with "casecontrol" study’s guideline. The goal of the study was to investigate the characteristics of
cerebral infarction stroke in patients without valvular heart disease and its associated risk
factors.
Selected subjects were patients with acute cerebral ischemic stroke without valvular
heart disease. Patients were classified into 2 groups of (1) the atrial fibrillation group and the
non-atrial fibrillation group. The risk factors are then explored, described and analyzed to
identify those directly related to stroke. The hypothetical risk ratio for AF stroke is 2, with type
I error alpha = 0.05 and power = 0.8. Case-control sample size formula is:
(1+𝑟)2 ×𝐶
n= 𝑟 ×(ln 𝑂𝑅)2 ×𝑝 ×(1−𝑝)
n:
OR:
p:
r:
C:
Whereas:
Number of patients needed for the study
Odd ratio of cerebral infarction stroke in patients with non-valvular AF, assume OR = 2
Population prevalence of risk factors. Since there is no previous studies, p of 0.5 is assumed
to maximize sample size.
Sample size ratio between two groups, choose r = 1
C = (𝑧∝⁄2 + 𝑧𝛽 )2 . With a = 0,05 and Power = 0,8 that C = 7,85 (table)
Substituting those parameters into the above formula, sample size shall be:
4𝐶
4 × 7,85
n= (ln 2) ×(ln 2) ×0,5×(1−0,5) = (0,69)2 ×0,5 ×0,5 = 263,81 ≈ 264 (bệnh nhân)
After accounting for an estimated 10% of loss of follow-ups or refusal to participate,
the final sample size shall be: n = 264 + 264 × 10% = 289 (patients).
Thus, this study requires 289 patients with non-valvular cerebral infraction, divided into
two groups of with and without AF.
2.3.3. Variables and indicators in the study
- Variable groups related to general characteristics: age (age group, average age), gender
(male and female), occupation (general labor, intellectual labor, other labor), medical history
(hypertension, diabetes (type 1, type 2), dyslipidemia, previous strokes (cerebral infarction,
cerebral hemorrhage), heart failure, vascular disease, combination pathology).
- Variables group related to clinical and subclinical characteristics:
+ Clinical symptoms: functional symptoms (paralysis, speechless/lisp/difficulty speaking,
headache, dizziness/dizziness, fatigue, urination), physical symptoms (Glasgow coma , stroke
assessment score (NIHSS).
+ Subclinical characteristics: echocardiography, CT-scanner (Computerized Tomography
scanner), MRI (Magnetic resonance imaging), blood tests (red blood cells, leukocytes,
hemoglobin, platelets, hemostasis), blood biochemistry (urea, creatinine, AST, ALT, glucose,
HbA1c, blood lipids (total cholesterol, triglycerides, HDL-C, LDL-C)).
- Variables group related to risk factors for ischemic stroke:
+ Factors related to the disease: onset time of cerebral infarction stroke (day and night); location
(at home, work, on the road, unknown); comorbidities (none, in combination with other (2+)
diseases.
+ Patient-related factors: age/age group, gender, history of comorbidities (newly
6
diagnosed/acquired for many years); level of compliance to treatment (medication compliance,
follow-up/periodic exams).
+ Treatment-related factors: the time from the onset of symptoms to the time of admission; time
from admission to treatment intervention; treatment methods (mere internal medical treatment,
combined treatment with venous/thromboembolism, instrumental therapy, combination
therapy); treatment outcome (life/death), and average number of hospitalized days in hospital.
- Variable group related to 30-day mortality prognosis in patients with acute MI due to
atrial fibrillation: Prognostic variables included in Bayesian regression model (BMA): study
group (atrial fibrillation / non-atrial fibrillation), gender, age, Glasgow score, 24-hour NIHSS
score, time from onset to intervention, intervention method (thrombosis, thromboembolism +
vascular intervention, vascular intervention, internal medical treatment), medical history
(hypertension, prior strokes, coronary artery disease, dyslipidemia, heart failure, diabetes),
Cha2DS2 score -VASc scores. Modelling will produce the most meaningful and predictive
variables to build the nomogram.
2.3.4. Utilized Medical equipment
- Computer tomography scan SOMATOM sensation 64, with Simen transducer, Germany
made.
- Magnetic resonance imaging machine 1.5 Tesla, Avanto of Simen, Germany.
- 12-lead ECG recorder Nihon Kohden, Japan manufacturer.
- Hematological analyzer at the Department of Hematology at Bach Mai Hospital.
- Blood biochemical analyzer at Department of Biochemistry of Bach Mai Hospital.
- AL-PK2 blood pressure monitor, manufactured by Tanaka Sangyo, has a tolerance of
3mmHg, made in Japan.
- Littmann Classic II Infant Stethoscope 2114, made in USA.
- Aurora temperature clamp, manufacturer Zhmie GMBH, originated from Berlin, Germany,
measuring range from 35 to 42 degrees C, imported by Hanoi Medical Materials Company.
2.3.5. Standards used in research
2.3.5.1. Diagnostic Criteria for acute stroke
Patients diagnosed with acute cerebral infarction when they meet the stroke diagnosis
criteria of the World Health Organization (WHO) including:
- Sudden onset with clinical manifestations of localized or generalized neurological dysfunction
lasting more than 24 hours or leading to death with no apparent cause other than brain vascular
injury.
- Time from onset to admission is no more than 24 hours.
- Assessing the severity of stroke using NIHSS brain health assessment scale (Appendix 4)
and/or images of cerebral infarction lesions on CT scan or MRI.
2.3.5.2. Diagnostic criteria for atrial fibrillation
Atrial fibrillation is defined based on American Heart Association and European Heart
Association ACC/AHA/ESC 2016 standards using the ECG:
+ RR intervals are varying
+ No clear sign of P waves on the electrocardiogram. Some clear and regular atrial
electrical activities can be observed in some ECG leads, commonly in V1.
+ The length of the atrial cycle varies and is often less than 200 milliseconds over 350
cycles/minute)).
2.3.5.3. Criteria for diagnosis of sinus rhythm
- P waves in front of the QRS complex; Positive P waves in DI, V5 and negative in aVL.
7
- That P wave is at a constant distance from QRS, and usually lasts 0.1 to 0.2 seconds.
2.3.5.4. Standards for non-valvular diseases
Not suffering from valvular heart diseases includes: no rheumatic mitral stenosis, no
mechanical nor biological heart valve, no mitral stenosis repair.
2.3.5.5. CHA2DS2-VASc Scale for assessing the risk of thrombotic stroke in patients with
non-valvular atrial fibrillation
Table score
Table 2.1. CHA2DS2-VASc Scale scoring for assessing the risk of thrombotic stroke in
patients with non-valvular atrial fibrillation
Clinical risk factos
CHA2DS2-VASc
(Congestive Heart Failure) (Hypertension)
1
(Age)
1
(Diabetes Mellitus)
2
(Stroke)
1
(Vascular disease)
2
(Age)
1
(Sex)
1
Total
9
Criteria for classifying risk of cerebral infarction in non-valvular atrial fibrillation
patients according to CHA2DS2-VASc
Table 2.2. Classification of risk of cerebral infarction stroke according to CHA2DS2VASc
Risk Classification of cerebral infarction stroke
CHA2DS2-VASc
No risk
0
Moderate Risk
1
High risk or having 2+ moderate risk factors
≥2
2.3.5.6. Diagnostic Criteria for comorbidities
Heart failure: As recommended by the Vietnam National Heart Association 2015
(based on Framingham criteria), patient has a confirmed diagnosis when possessing all major
criteria or a combination of one major criteria and 2 minor criteria. Specifically: (1) Major
criteria: Paroxysmal nocturnal dyspnea or orthopnea; neck vein distension; pulmonary rales;
cardiomegaly; acute pulmonary edema; third heart sound gallop; systematic venous pressure
above 16 cm H2O; circulation time over 25 seconds; positive hepatojugular reflex. (2) Minor
criteria: ankle edema; nocturnal cough; dyspnea on exertion; hepatomegaly; pleural effusion;
Living capacity decrease by 1/3 compared to the maximum; tachycardia (120+ beats/min). (3)
Other criteria: weight loss of 4.5kg/5 days of treatment of heart failure.
Hypertension: According to the Vietnam National Heart Association 2015
recommendations, hypertension is defined as systolic blood pressure (maximum blood
pressure) above 140mmHg and/or diastolic blood pressure (minimum blood pressure). Over
90mmHg.
Diabetes: Diagnosed based on meeting one of the following three criteria as
recommended by the Association of Diabetes and Endocrinology in 2018. Specifically: (1)
History of diabetes (type 1 or type 2 diagnosed) ); (2) Fasting blood glucose above 7.1 mmol /
l or 2 hours after eating / (hyperglycemia testing above) / (oral glucose tolerance test ??) of 11.1
mmol / l (twice on two consecutive days - excluding hyperglycemia due to psychological
stress); (3) HbA1c above 6.5% in international standard labs.
Vascular disease: Per recommendations of the European Heart Association 2011,
includes: Myocardial infarction (history of scarring/infarction scarring observed in
8
echocardiography); Peripheral vascular disease (history/angiographic ultrasound or
computerized tomography); aortic atheroma (ultrasound of the chest wall/esophagus or
computerized tomography)
2.3.5.7. Classifying Criteria of different assessment scales
Glasgow coma: classified into three levels based on the total score: (1) Mild level
(Glasgow coma from 13 to 15 points); (2) moderate level (Glassgow coma score from 9 to 12
points) and (3) severity (Glasgow coma score from 3 to 8 points).
NIHSS stroke assessment score: Classed into four levels based on total scores:: (1)
Mild level (NIHSS score ranges from 1 to 4 points); (2) moderate level (NIHSS score from 5
to 15 points); (3) Moderate to severe (NIHSS scores from 16 to 20 points); (4) Very severe
level (NIHSS score from 21 to 42 points).
Score scale for assessing risk of thrombotic stroke in patients with non-valvular AF
Cha2DS2-VASc: divided into 3 risk groups: (1) No risk (total Cha2DS2-VASc score is 0 points);
(2) One risk factor (total score of Cha2DS2-VASc is 1 point) and over 2 risk factors (total score
of Cha2DS2-VASc over 2 points.
2.3.6. Study procedure
Step 1: Patient is admitted to hospital with one or more manifestations: coma/conscious,
hemiplegia, speechlessness/speech disorder, headache, dizziness, urinary or bowel disorders,
which lead to stroke would be clinically examined and paraclinical would be indicated for
confirmed diagnosis.
Step 2: Confirming diagnosis of cerebral infarction stroke.
Step 3: Determine the cause of stroke (1) Atrial fibrillation or non-atrial fibrillation and
(2) No heart valve disease. Invite the patient to participate in the study, sign a informed consent
(Appendix 2) and provide a research fact sheet.
Step 4: Collect administrative information, clinical and paraclinical characteristics and
information related to risk factors based on the criteria 2.3.4.
Step 5: Collect information to build a prognosis model of mortality post 30 days.
- If the patient is still hospitalized: collect on daily clinical examination at the treatment
department
- If the patient has been discharged: Call the family member to inquire about the patient's
progression and condition.
Step 6: Data analysis.
2.4. Data analysis
Data were analyzed using IBM’s SPSS 20.0 and R 3.4.1. runing on Microsoft's
Windows 10 operating system.
- For groups of variables related to clinical and paraclinical characteristics: counting,
calculating percentages, squaring by rows or columns, paired T-tests and independent T-tests.
With 95% significance level, p value is statistically significant when p <0.05.
- For the groups of variables related to risk factors for stroke: calculating OR (odds - ratio ratio).
ORs are considered statistically significant when the 95% confidence interval ranges (95% CI)
does not contain value 1.
- With prognostic model of mortality in stroke patients with non-valvular AF: utilizing Bayesian
multivariate regression. The best model selected was the one with the least number of variables,
which best explained the risk of mortality in stroke patients with non-valvular AF and had the
lowest BIC.
9
2.5. Research ethics
The research was carried out after it was approved by the Science Council of Hanoi
Medical University and Board of Directors of Bach Mai Hospital. The patient has the right to
leave the study at any time and for any reason without explanation.
Chapter 3
RESULTS
3.1. General characteristics of study populations
Table 3.1. Demographics characteristics of study subjects (n=289)
Study group
Control group
Characteristics
p (𝟀𝟐 )
(n=138)
(n=151)
66,71±11,41
66,50±13,75
p=0,067
Mean age (𝑋̅ ± SD)
Max=90; Min=28
Max=95; Min=25
Male (n,%)
72 (52,2)
94 (62,3)
p=0,054
Sex
Femal (n,%)
66 (47,8)
57 (37,7)
p=0,073
General laborors (n,%)
59 (42,8)
67 (44,3)
p=0,082
Occupation Intellectual labor (n,%)
48 (34,8)
53 (35,1)
p=0,060
Khác (n,%)
31 (22,4)
31 (20,5)
p=0,063
Results:
- There was no difference in the mean age between non-valvular accute MI patients with and
without atrial fibrillation and atrial fibrillation (p> 0.05).
- Gender distribution are similar in 2 groups. More male than female, at ratio of 1.09 in study
group and 1.65 in control group.
- Occupation classification distributions are similar in AR and non-AF groups.
Table 3.2. Characteristics medical history (n=289)
Study group
Control group
Characteristics
p (𝟀𝟐 )
(n=138)
(n=151)
Hypertension (n,%)
109 (79,0)
113 (74,8)
p=0,077
Diabetes (n,%)
21 (15,2)
17 (11,3)
p=0,089
Vascular disease (n,%)
17 (12,3)
13 (8,6)
p=0,065
Lipid disorder (n,%)
73 (52,9)
65 (43,0)
p=0,059
Prior stroke (n,%)
13 (9,4)
6 (4,0)
p=0,091
TIA (n,%)
15 (10,9)
9 (6,0)
p=0,078
Heart failure (n,%)
25 (18,1)
14 (9,3)
p=0,069
* A patient can have multiple medical conditions.
Results: Most common medical histoty conditions are hypertension and lipid disorder.
3.2. Clinical and paraclinical Characteristics of study populations
3.2.1. Clinical Characteristics of subjects
3.2.1.1. Functional symptoms
Table 3.3. Functional symptoms * (n=289)
Study group
Control group
(n=138)
(n=151)
Characteristics
p (𝟀𝟐 )
n
%
n
%
Left
56
40,6
67
44,4
p=0,241
Paralysis
Right
61
44,3
77
50,2
p=0,198
10
Speechless
68
49,3
71
47,0
p=0,056
Speech disorders (difficulty/lisp)
75
54,3
59
39,1
p=0,051
Headache
11
8,0
7
4,6
p=0,070
Diziness
17
12,3
8
5,3
p=0,081
Nausea/Vomiting
7
5,1
5
3,3
p=0,069
* A patient can have concurrent multiple symptoms.
Results: Most common symptoms are paralysis and speech disorders, and least common
are nausea/vomiting, headaches, or diziness.
3.2.1.2. Physical symptoms
Table 3.4. Glasgow coma score (n=289)
Study group
Control group
(n=138)
(n=151)
Characteristics
p (𝟀𝟐 )
n
%
n
%
Mild (13 – 15 points)
11
8,0
20
13,2
p=0,073
Classification Moderate (9 – 12 points)
56
40,6
77
51,0
p=0,041
Severe (3 – 8 points)
71
51,4
54
35,8
p=0,029
8,73 ± 2,58
9,51 ± 2,61
p=0,032
Average Glasgow score (𝑋̅ ± SD)
Max=15; Min=4 Max=14; Min=4
Results: Study group has a statistically significantly higher mean Glasgow score than
control group.
Table 3.5. NIHSS for assessing stroke at admission (n=289)
Study group
Control group
(n=138)
(n=151)
Assessing Stroke NIHSS score (points)
p (𝟀𝟐 )
n
%
n
%
Mild (1 – 4)
1
0,7
5
3,3
p=0,065
Moderate (5 – 15)
84
60,9
119
78,8
p=0,039
Classification
Moderate - Severe (16 – 20)
17
12,3
3
2,0
p=0,021
Very severe (21 – 42)
36
26,1
24
15,9
p=0,035
̅
15,08 ± 8,45
11,52 ± 7,25
p<0,001
Average NIHSS scores (𝑋 ± SD)
Results: Study group has higher score and worse condition compared to control group
of non-AF. Mean NIHSS score in AF and non-AF groups are 15 vs. 12 points, respectively
(p<0,001).
3.2.1.3. Time from onset to intervention
Table 3.6. Time from onset to intervention (n=289)
Study group
Control group
(n=138)
(n=151)
Time from onset to intervention
p (𝟀𝟐 )
n
%
n
%
≤ 3 hour
16
11,6
40
25,6
p=0,015
> 3 hour – 4,5 hour
63
45,7
48
31,8
p=0,038
> 4,5 – 6 hour
34
24,6
38
25,1
p=0,541
> 6 hour
25
18,1
25
16,6
p=0,776
Results: Time to intervention has highest frequency in 3- 4.5h group (45,7% in Study
group and 31,8% in Control group), and lowest frequency in <3h intervention group (11,6% in
11
AF) and >6h intervention group (16,6% in non-AF). The difference is statistically significant
in less-than-4.5h group (p<0,05).
3.2.1.4. Methods of intervention
Table 3.7. Treatment methods (n=289)
Study group Control group
(n=138)
(n=151)
Treatment methods
p (𝟀𝟐 )
n
%
n
%
Standard internal medicine treatment approach 25
18,1
25
16,6
p=0,589
Intravenous thrombosis
60
43,5
65
43,0
p=0,753
Invasive Interventional thromboembolism
37
26,8
39
25,8
p=0,876
Combining intravenous thrombosis and
16
11,6
22
14,6
p=0,657
invasive interventional thromboembolism
Results: Highest proportions are observed in patients treated with intravenous
thrombosis in both AF and non-AF groups (43,5% in Study group and 43% in Control group),
and lowest in the combination treatment of intravenous thrombosis and invasive interventional
thromboembolism (11,6% in Study group and 14,6% in Control group). There is no statistically
significantly difference in all treatment methods in both groups (p>0,05).
3.2.1.5. Duration of hospitalization
Table 3.8. Number of hospitalization days (n=289)
Mean number of days
Study group (n=138) Control group (n=151)
p (𝟀𝟐 )
hospitalized
27,11 ± 12,34
20,49 ± 9,87
p=0,025
𝑋̅ ± SD (date)
Results: Mean number of days of hospitalization in Study group is statistically
significantly higher than that in Control group.
3.2.2. Clinical Characteristics
3.2.2.1. CT-scanner
Table 3.9. CT scan images (n=62)
Study group
Control group
(n=138)
(n=151)
Hình ảnh học
p (𝟀𝟐 )
n
%
n
%
Sulcal effacement
15
10,9
9
6,0
p=0,089
Subcortical hypodensity
7
5,1
6
4,0
p=0,078
Mass effect
0
0
1
6,6
Pots sign
8
5,8
10
6,6
p=0,108
Hyperdense artery sign
9
6,5
11
7,3
p=0,088
Results: There is no statistically significantly differences between case and control
groups.
3.2.2.2. MRI images
Table 3.10. MRI Images (n=228)
Study group
Control group
(n=138)
(n=151)
Image
p (𝟀𝟐 )
Middle cerebral artery occlusion at M1
Middle cerebral artery occlusion at M2
n
%
n
%
46
32
41,4
28,8
38
24
32,5
20,5
p=0,021
p=0,045
12
Middle cerebral artery occlusion at M3
Brain carotid artery occlusion
Anterior cerebral artery occlusion
Posterior cerebral artery occlusion
Basilar artery occlusion
Vertebral artery occlusion
Supratentonial infarcts
Infratentionrial infarcts
8
34
7
5
8
4
11
16,2
30,6
6,3
4,5
16,2
8,1
9,9
18
20
4
3
7
3
26
15,4
17,1
3,4
2,6
6,0
2,6
22,2
p=0,086
p=0,045
p=0,077
p=0,085
p=0,065
p=0,078
p=0,013
7
6,3
9
7,7
p=0,098
Results: In both study group và control group, highest rates are at middle cerebral artery
occlusion at M1 group, and lowest at posterior cerebral artery occlusion group.
3.3. Risk factors of cerebral infraction acute stroke in study subjects
3.3.1. Associated factors
3.3.1.1. Place and time of onset
Morring
66,7
Night
70,2
33,3
29,8
Study group
Control group
At home
Office
Other
22,5
14,5
22,8
13,2
63,0
62,9
Study group
Control group
Figure 3.1. Place and time of onset (n=289)
Results:
- Onset at night is 2 fold higher than at day, in both groups (p>0,05).
- Place of onset is similar in AF and non-AF groups with 63% at home, and smaller proportion
occurs at work or at different places (p>0,05).
3.3.1.2. Medical history
Table 3.11. Association between comorbidities and stroke (n=289)
Study group
Control group
Cormobidities
OR (95%CI), p
(n=138)
(n=151)
2+ comorbodities
29
18
1,53 (0,781-0,987)
p<0,05
1 comorbodity
83
79
Results: Patients with 2+ comorbidities has a higher risk of 1.53 folds compared to those
with one comorbidity (p<0,05).
3.3.2. Individual related factors
3.3.2.1. Gender and age
Table 3.12. Association between stroke and gender and age (n=289)
Age
Study group (n=138)
Control group (n=151)
OR (95%CI), p
≥ 75
< 75
Gender
49
89
Study group (n=138)
33
118
Control group (n=151)
1,96 (0,098-0,108)
p<0,05
OR (95%CI), p
13
Male
72
94
0,66 (0,982-1,874)
p>0,05
Female
66
57
Results: Age of 75+ is a high risk factor of stroke (OR =1,96). There is no association
between gender of stroke in both AF and non-AF groups.
3.3.2.2. Duration of comorbidities
Table 3.13. Association between stroke and duration of comorbidities (n=289)
Study group
Control group
Duration of comorbidities
OR (95%CI), p
(n=138)
(n=151)
≥ 1 year
121
100
3,63 (2,134-2,756)
p<0,05
< 1 year
17
51
Results: Patients with longer comorbidities of 1+years have a 3.63 folds higher risk of
stroke, compared to those with less than 1 year (p<0,05).
3.3.2.3. Treatment adherence
Table 3.14. Association between stroke and adherence to treatment (n=289)
Study group
Control
Compliance level
OR (95%CI), p
(n=138)
group(n=151)
Non-compliance
90
71
2,11 (3,451-3,665)
p<0,05
In compliance
48
80
Results: Patients who do not comply with treatment plan have 2.11 fold higher of risk
of stroke, compared to their counterparts (p<0,05).
3.3.3. Treatment related factors
3.3.3.1. Time to intervention
Table 3.15. Association between stroke and time to intervention (n=289)
Time to
Control
Study group (n=138)
OR (95%CI), p
intervention
group(n=151)
> 4.5h
59
63
1,04 (0,762-1,788)
p>0,05
≤ 4.5h
79
88
Results: No association found between stroke and time to intervention
3.3.3.2. Treatment methods
Table 3.16. Association between stroke and treatment methods (n=289)
Study group
Control
Treatment methods
OR (95%CI), p
(n=138)
group(n=151)
Regular internal medicine
25
25
1,11 (0,776-0,982)
p>0,05
Thrombolysis/ surgery intervention
113
126
Results: No association found between stroke and treatment methods.
3.3.3.3. History of stroke
Table 3.17. Association between stroke and history of prior stroke (n=289)
Control
History of prior stroke Study group (n=138)
OR (95% CI), p
group(n=151)
28
15
Yes
2,30 (1,45 – 3,77)
p < 0,01
110
136
No
Results: AF patients with prior strokes have a 2.3 fold higher risk of having a new strike,
compared to those without history of stroke (p<0,01).
14
3.3.4. Risk factors using Cha2DS2-VASc scale score to assess stroke in non-valvular AF
patients (n=138)
3.3.4.1. Cha2DS2-VASc scale score to assess stroke in non-valvular AF patients
Table 3.18. Cha2DS2-VASc scale score to assess stroke in non-valvular AF patients
(n=138)
Pmale̅ ± SD) (points)
Mean score (𝑿
Scale score
female
Male (n=72)
Female (n=66)
All (n=138)
(T-test)
Cha2DS2-VASc score
2,04 ± 1,37
3,59 ± 1,65
2,78 ± 1,69
p=0,211
Results: CHA2DS2-VASc scores are not statistically significantly different in male and
female subjects.
Table 3.19. Classification of risk factors in stroke patients with non-valvular AF #
(n=138)
Classification
Score
Male (n=72)
Female (n=66)
All (n=138)
n
%
8
11,1
23
31,9
41
56,9
Min=0; Max=5
n
%
0
0
7
10,6
59
89,4
Min=1; Max=6
n
%
8
5,8
30
21,7
100
72,5
Min=0; Max=6
No risk
0
One risk factor
1
Two or more risk factors
≥2
Score
#
At the time of enrolling in the study
Results: Highest rate in the 2+ risk factors group(72.5%) and lowest in the no risk group
(5,8%).
3.4. Prognosis model to predict 30-days mortality in acute ischemic stroke patients with
non-valvular AF
3.4.1.1. Outcomes
Table 3.20. Patients outcomes (n=289)
Study group (n=138)
Control group (n=151)
p (𝟀𝟐 )
Outcomes
n
%
n
%
Non-survive
18
13,0
13
8,6
p=0,532
Survive
120
87,0
138
91,4
p=0,067
Results: Mortality in acute ischemic stroke patients with non-valvular AF is higher than
non-AF patients.
15
3.4.2. Selection of predictive factors included in model
3.4.2.1. BMA
NIHSS 24 hours
Cha2DS2-VASc
Surgery intervention
Thrombolysis + Surgery intervention
Regular internal medicine
Thrombolysis
Glasgow Score
Study group /Control group
Time from onset to intervention
Age
Stroke history
Hypertension
Diabetes
Congestive heart failure
Lipid díorder
Coronary artery disease
Gender
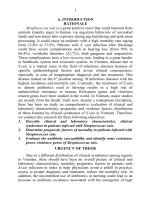
Figure 3.2. BMA model
Results: The blue in figure 3.2refers to negative coeficcients, and the red refers to
positive coeficients. In this chart, variables NIHSS-24hrs and Admission Glasgow Score
appear in 100% of prognosis models; while uration from onset to intervention appears in 76.9%.
Bayes model averaging results in 5 best models out of 12 models total.
3.4.2.2. Regression model building for prognosis
16
Table 3.21. Prognosis model to predict 30-days mortality in cerebral infraction acute stroke patients with non-valvular AF (5 best
models)
Factors
Prevalence (%)
Model 1
Model 2
Model 3
Model 4
Model 5
-1
-1
-1
-1
24h-NIHSS score
100
3,692×10
4,029×10
3,803×10
3,789×10
3,830×10-1
Treatment methods
3,1
Cha2DS2-VASc score
4,3
Glasgow score at admission
100
-8,495×10-1
-8,461×10-1
-8,534×10-1
-9,018×10-1
-8,501×10-1
Duration from onset to
96,9
2,197×10-1
2,137×10-1
2,210×10-1
2,183×10-1
2,196×10-1
intervention
Female
3,2
Age
4,2
-2,268×10-1
AF (+)
4,3
5,617×10-1
Prior strokes (+)
9,8
1,227
Coronary artery diseases (+)
3,3
Hypertension (+)
3,2
Heart failure (+)
3,5
Blood lipid disorder (+)
3,5
Diabetes (+)
3,8
4,958×103
Number of variables in model
3
4
4
4
4
2
0,743
R
-1,550×103 -1,547×103
-1,545×103
-1,550×103
-1,545×103
BIC
0,544
0,098
0,043
0,042
0,038
Posterior Probability
(+) positive/ confirmed diagnosis
R2 explained variances of mortality risk in cerebral infraction acute stroke based on study variables, utilizing logistic regression “lrm”.
BIC is a penalized-likelihood criteria. Lower BIC is associated with better model.
Posterior probability is the probability of obtaining model in 100 trials
17
Results: Of 12 models presented by BMA, 5 best models were considered, of them the one with 3 independent variables *NIHSS24hrs, Glasgow score, and duration from onset to intervention) is the most effective to evaluate probability of mortality in patients with acute
ischemic stroke. Coeficcients for independent variables respectively are 3.692x10 -1,-8,495×10-1, and 2,197×10-1 for NIHSS-24h, Glasgow
score at admission, and duration from onset to intervention. This model explains 74.3% variance of mortality probability in stroke patients
and also has the lowest BIC of -1,550×103
18
3.4.2.3. Logistic regression nomogram for mortality rate within 30 days after intervention
in study group and comparison group
Score
NIHSS 24 hours
Glasgow
Điểm hôn mê Glasgow
vàoScore
viện
Time from onset to intervention
Total score
Logistic regression for mortality rate
Figure 3.3. Logistic regression nomogram for mortality rate within 30 days after
intervention in study group and comparison group
Results: Prognosis mortality nomogram is established using 3 main factors: NIHSS
after 24 hours, Glasgow score at admission, and duration from onset to intervention.
Prognosis variables for each factor are scored using corresponding scales. Total score of all
3 factors is calculated. 30-days-post-intervention mortality rate is estimated by referring total
score to the mortality prognosis scale.
Chapter 4
DISCUSSION
4.1. General characteristics of cerebral infraction in non-valvular AF and non-AF
The mean age of 289 acute stroke patients in this survey was 66 years, similar in both
the study and control groups. Our study reported an older study population than do other
national authors, such as Nguyen Duc Long (63 years old); Tran Minh Huy and Cao Phi
Phong (61 years old); Mai Duy Ton (60 years old); Phan Thanh Hai (59 years old); younger
than that of Le Quang Minh (68 years old), and similar to Nguyen Huy Thang (66 years old).
International authors also reported varying ages, for example Ekker M.S. (44 years old);
Verhoeven J.I. (44 years old); Aparermo H.J. (71 years old); Purroy F. (78 years old for
women and 71 years for men); Chung-Fen Tsai (73 years old). A 2017 study by Khan N.A.
et al. evaluated the risk of stroke among different ethnicity groups with a large sample size
and found that 3,290 South Asians, 4,444 Chinese, and 160,944 whites with ischemic stroke
19
(from census databases from 1997 to 2000). The study also found that people in South Asia
had a younger age of onset than whites (70 years old versus 74 years old). 2010’s stroke
rate of South Asian and Chinese was 63% and 43% lower than whites, respectively.
In our study, proportion of male are larger than that of female both atrial and nonatrial fibrillation groups (male: female = 1.09 in the study group and 1.65 in the control group
- Table 3.1). This ratio is similar in Phan Thanh Hai’s study (ratio is 1.93), Mai Duy Ton’s
(ratio=1.02) Cao Phi Phong’s (1.55), and Caso V., Melinda E. Wilson, Michiel H’s.
4.2. Clinical and paraclinical characteristics
4.2.1. Clinical characteristics
Nguyen Duc Long reported clinical symptoms at admission as follow: 89%
hemiplegia; 50% apathy; and 1.2% with quadriplegia. Mai Duy Ton reported100% with
sensory disorders and hemiplegia and 54.5% with speech disorders. Other manifestations
such as dizziness, nausea and vomiting only account for a small proportion (3.0% to 4.5%).
In Ma Hoa Hung's study, patients experienced dizziness (74.4%), vomiting (59%), headache
(53.8%), ataxia (74.4%), speech difficulties (76.9%), swallowing (41%), and eyeballs
convulsions (28.2%). Dao Thi Bich Ngoc reported 79.3% having hemiplegia; 29.3% having
headache; 19.6% having dizziness; 15.2% having difficulty speaking, 9.8% having sensory
disorders, and 4.3% having local or general seizures. Per Tran Quang Thang, the most
common symptom is hemiplegia (100%), hahlf-human sensory disorder (88.9%); apathy or
difficulty speaking (22.2%); headache (11.1%); nausea /vomiting and consciousness
disorder accounted for a small proportion (6.7% and 2.2%). Pham Phuoc Sung reported
weakness, hemiplegia (92.9%); cranial nerve palsy (92.9%), sensory disorder in half-body
(64.5%); difficulty speaking (63.6%); speech disorder or aphasia (35.4%) and consciousness
disorders with lowest frequency of 22.2%. This distribution is fairly consistent with our
study.
In this study, the physical symptoms of interested include the Glasgow coma scale
and the NIHSS stroke assessment scale. This study showed that the threshold of coma
according to Glasgow of patients in the study group and control group was average (about 8
to 10 points); The average NIHSS score is 9 to 11 points (51%). The lowest recorded
Glasgow coma score was 4 points, and the highest was 15 points, where patients are fully
conscious. A number of studies by local authors also recorded median of Glasgow coma and
stroke threshold of NIHSS scores.
With the development of intravenous thrombolytic drugs and surgical thrombotic
interventions, "time is the brain" has come the fore front of stroke treatment. Currently, most
hospitals in Hanoi have developed stroke units, concurrently coordinated efficient transfer
between hospitals during "golden time" to timely intervene in order to minimize consequent
disability or sequelae in stroke patients. The time considered to be the best for thrombolytic
interventions was 3 to 4.5 hours, extended with vascular intervention at the 6-hour threshold.
Therefore, in considering time from onset to intervention, beside investigating average time
of intervention, this study also classified the interval of onset-to-admission into 4 categories:
from 3 hours; over 3 hours to 4.5 hours; over 4.5 hours to 6 hours and over 6 hours. With
this intervals, the proportion of patients hospitalized during the 2nd (<3 hours - 4.5 hours)
and the third (> 4.5 - 6 hours) periods was the highest at 45.7% and 24.6%, respectively. The
study also noted that up to 18.1% of patients admitted after 6 hours and a small percentage
(11.6%) of patients admitted in less than 3 hours (study group.). In control group, 25.6%
patients admitted during the "golden time" of 3 hours is 25.6%. 16.6% of patients admitted
20
after 6 hours. This has a significant effect on the prognosis and treatment outcomes of
patients in both study and control groups.
Box plots were selected to describe gender distribution. It showed that in both the
study and control groups, the difference of median time value between male and female
groups was unnoticeable. However, in the 4th quartile 75%, value was reverted between
two groups (the atrial fibrillation group was lower than the non-atrial fibrillation group). This
may have occurred because some non-AF patients had recognizably longer time from onset
to. hospitalization was than AF patients, resulting in reversal median segmentation.
In this study, the number of patients receiving vascular thrombosis or a combination
of thrombolytic and vascular interventions was 38.4% in the study group and 40.4% in the
control group. The proportion of patients treated merely internal medically in the atrial
fibrillation and non- atrial fibrillation group was equal (25 patients per group) (p> 0.05).
Usually these are cases of foci stroke, where the patient is not prescribed anticoagulant but
empirically treated with antiplatelet and hypertension control. In other cases where patients
suspect a narrow or large arterial thrombosis but not allowed to use thrombolytic, antiplatelet
or heparin are still considered. Antiplatelet agents are also indicated in patients with Doppler
ultrasound (neck or transcranial, pre- and post-cyclic), and MRI/CT scan showed a small
narrow level.
4.2.2. Đặc điểm cận lâm sàng bệnh nhân nghiên cứu
Of the 289 eligible patients included in the study, 228 were given MRI and 62 were
given CT scan. The typical image of computerized tomography observed is a sign of cortical
ablation, at 10.9% in study group and 6% in control group. The percentage of hyperdense
artery sign, dots sign and subcortical hypodensity images are quite similar at approximated
4% to 6.6%. On magnetic resonance imaging, the images with the highest prevalence are
cerebral artery occlusion between the M1 and M2 segments, the carotid occlusion in the
intracranial segment. Mai Duy Ton reported CT images as follow: removal of cerebral cortex
13.9%; dots sign 11,1%; hyperdense artery sign 13,9%; subcortical hypodensity 8,3%.
Magnetic resonance imaging: small artery occlusion on tent 28.8%; clogged brain artery
between segment M1 27.3%; clogged brain artery between segment M2 13.6%; carotid
artery occlusion in the intracranial segment and M1 13.6%. Dao Viet Phuong’s results: M1
middle cerebral artery (48%); carotid artery (36%) or carotid artery occlusion in midcerebral artery (16%). Location of arterial occlusion is extremely important in the treatment
strategy because although thrombolytic agents are generally highly effective in cerebral
infarction, it is not as efficient in large arteries such as the carotid arteries, basal arteries, and
Intermittent brain artery in the M1 segment (about 10%).
The results of blood count, blood biochemical, blood clotting before the intervention
had no significant difference between study and control group; and most of them fluctuated
in normal values range.
4.3. Risk factors for stroke
4.3.1. Factors related to cerebral infarction stroke
Related factor is 2+ comorbidities. This is very important for patients with
hypertension, especially systolic or diastolic hypertension alone. Patients with many chronic
illnesses are also associated with poorer adherence due to the use a combination of drugs,
21
which can easily lead to "forgetting" or taking the wrong medication at different times of the
day.
4.3.2. Factors related to the patient
Many studies have shown that the higher the age, the greater the risk of developing
atrial fibrillation, especially in cases of unexplained ischemic stroke. In our study, this rate
in patients over 75 years of age is twice higher than the group under 75, which is consistent
with the literature. Older age also entails many risks of chronic diseases that are difficult to
maintain, pairing with the impaired functions of organs and parts, causing limited drug
absorption. In addition, prolonged use of the drug is also one of the causes of some additional
adverse effects - although the benefits still outweigh the risks. In addition, elderly patients
with chronic diseases often do not comply with treatment because they have to take
medication many times a day. Their diet is also more difficult to control in relation to the
care of family members and daily living habits of each family.
The comorbidity lasting more than 1 year and the noncompliance of treatment may
increase the risk of new stroke in the study patient. This factor has a significant impact on
the effectiveness of intervention and future prevention. Patients who follow treatment plan
and follow-up visits are often better able to control risk factors, better manage their
complications and abnormalities, and better relation with health care workers. Especially for
patients with atrial fibrillation, the diagnosis is not easy as a large number of patients goes
undiagnosed (silent atrial fibrillation). Patients only go to the hospital when a cerebral stroke
has occurred. This has increased the risk of serious injury or sequelae or death for the
patients.
4.3.3. Factors related to treatment
One of the current prerequisites for the treatment of cerebral stroke is the time
between the onset to admission and intervention. Treatment with thrombolytic drugs in the
window for up to 3-4.5 hours is considered one of the most effective measures in recovery,
especially rehabilitation of motor function in patients with ischemic stroke.
Regarding the intervention method, we have not found any significant relationship.
However, with a history of previous strokes, the prognostic factor increased 2.3 times
higher than those without. This implies that the control of comorbidities and the prevention
of recurrent stroke are not effective. This can happen for two reasons: (1) that patients who
do not comply with treatment plan, causing an increased risk of progression and difficulty
in controlling chronic disease and risk factors; and (2) the risk of prophylaxis for patients
with low or unclear risk. This is quite common in cases of cerebral infarction strokes that
are not found and are particularly dangerous in cases of silent asymptomatic atrial
fibrillation.
4.3.4. Risk factors assessed on ChaDS2 or ChaDS2-VASc
Higher ChaDS2 or ChaDS2-VASc scores are associated with an increased risk of
ischemic stroke in patients with non-valvular atrial fibrillation. However, there are no data
that report early localized nerve damage after stroke according based on risk level.
Of the 289 stroke patients included in our study, the proportion of patients with 2 or
more risk factors accounted for 72.5% (Table 3.22). There was no difference in the average
22
Cha2DS2-VASc score between male and female groups. In fact, being female is
characterized with 1 point higher than male in the assessment scale, resulting in different
indication for oral anticoagulant.
4.4. Prognosis model of mortality after 30 days in patients with acute cerebral ischemic
stroke with non-valvular atrial fibrillation
After 30 days of intervention, the research team member calls to check in the patient's
progress (in cases of discharge within 30 days) to determine treatment outcome. Among
them, the proportion of patients who died in atrial fibrillation stroke group was higher than
the non-atrial stroke group (13% vs. 8.6%). This result is consistent with studies in Vietnam
and around the world. Vietnam National Heart Association’s 2015 statistics showed that
atrial fibrillation increases the risk of stroke by 5 times, heart failure by 3 times and the risk
of death by 2 times. In Asia, a survey from a meta-analysis of Bai Y. et al. 2017 also found
that the risk of developing a real stroke in patients with atrial fibrillation from 8 countries
was 3.0%.
Developing prognostic models in patients with acute cerebral infarction stroke by
Bayes induction and deduction method is not yet popular in Vietnam; however; along with
the preeminent properties of selecting models based on clinical practice and interventions at
the lower hospital level, it constitutes a fairly easy and simple method. Unlike the traditional
statistical method, Bayes' inference offers many models for the researcher to choose, while
taking into account the entire interaction of the variable groups and the research index
without just picking variables with significant statistics. This is related to the common
multicollinearity in linear regression models including multivariate and logistic. It is
important to consider the interactions among similar groups of variables because including
multiple variables can change both the model and the predictors. The significance level of
the model is assessed using post-probability. The higher the probability, the more
meaningful the model is. BIC is also a penalty index for variables with cumulative
interactions or reversing the prediction, depending on the researcher's threshold level.
Regarding nomogram for mortality estimation, we have only found one study that
built this type of chart, of Ha Tan Duc (2015) who built the model using data from the
department of Emergency internal medicine at Central General Hospital in Can Tho.
Although research duration is short, this research investigated a large sample while ensuring
the rigor in research design as well as developing clearly variables and outcomes. In this
study’s subject group, there is also a small proportion of patients with acute cerebral
infarction who have atrial fibrillation hospitalized in Emergency and Internal Medicine
Department. Some prognosis factors of Ha Tan Duc and ours are similar. However, when
included in the regression model, some interactive factors produce insignificant results and
variables are excluded from the prognostic model. This shows that the localization of the
pathology (although all internal medicine emergency) is important in the evaluation of the
specificity of each disease, thereby making recommendations and accurate forecasts on each
target group of intervention.
CONCLUSION
23
From this study which collected data from 2013 to 2017 in 289 stroke patients with
or without atrial fibrillation and without valvular heart disease at the Emergency Department
of Bach Mai Hospital and Vietnam National Heart Institute, we draw 3 conclusions as
follows:
1. Clinical and paraclinical characteristics of stroke patients with non-valvular AF:
Clinical features
- Average age is 66 years, more male than female (male: female ratio = 1.09). Occupation
classification distributions are similar in both manual labor and intellectual labor. The most
common medical history is hypertension (79%); dyslipidemia (52.9%); previous stroke
(including TIA) 20.3%; heart failure (18.1%); diabetes (15.2%). There was no difference
between study and control group.
- Common functional symptoms are: hemiplegia (left or right) 84.9%; apathy 49.3%; speech
difficulty / lisp 54.3%; dizziness / dizziness 12.3%; headache 8.0%; nausea / vomiting 5.1%
- no difference with control group.
- The Glasgow coma score in the AF group was significantly lower than the non-AF group
and the NIHSS was statistically significantly higher in the stroke group, indicating a more
severe condition of the research group. The average Glasgow score is 8.73 ± 2.58 (points)
and the NIHSS stroke is 15.08 ± 8.45 (points).
- The time from onset to the intervention is focused mainly on over 3 hours to 6 hours.
However, there was a statistically significant difference in patients hospitalized less than 3
hours (the group with atrial fibrillation was less than the group without atrial fibrillation).
- The primary intervention method is venous thromboembolism and venous
thromboembolism in combination with vein thrombosis intervention, there is no difference
between the study and the control group.
- The outcome of treatment after 30 days in the atrial fibrillation group was 13% of mortality.
The difference was not statistically significant compared with the group without atrial
fibrillation (p = 0.532).
- The mean days duration of hospitalized of stroke patients with AF was significantly higher
than the group of stroke without atrial fibrillation.
Regarding paraclinical characteristics:
- The percentage of patients with magnetic resonance imaging is 78.9%; computerized
tomography is 21.4%.
- The most common images on magnetic resonance imaging are cerebral artery occlusion
between segment M1 (41.4%) and M2 (28.8%), carotid artery impact in segment in skull
(30.6%) - There was a statistically significant difference compared to the control group.
- Images on computerized tomography are often sulcal effacement (10,9%); dots sign 6,5%;
hyperdense artery sign 5,8%; subcortical 5,1%.- no difference between the two groups.
- Lab results of blood count, hemostatic coagulation, blood biochemical had no difference
between the group of atrial fibrillation and non-atrial fibrillation, fluctuating within normal
limits.
2. Several risk factors in patients with stroke due to non_valvular atrial fibrillation
24
- Time of onset was usually at night (66.7%), the place of onset was at home (63%) - there
was no difference with control group.
- Recorded risk factors include: medical history, age over 75, duration of disease over 1 year,
compliance with treatment, previous history of stroke and more than 2 risk factors. The
difference was statistically significant compared to the control group.
- The average Cha2DS2-VASc score was 2.78 ± 1.69 (points), the highest score was
observed in the group with 2 or more risk factors (72.5%) - there was no clear difference
between male and female.
3. Prognosis model of mortality after 30 days in patients with stroke not due to nonvalvular AF
- Among the 12 models analyzed by BMA, there are 5 best models, of which, the 3variables model (24-hour NIHSS score, Glasgow score at admission, and time from onset to
intervention) ) is the best fitted model to assess the risk of death in patients with acute
cerebral infarction, with regression coefficients for each variable as follows: 3.692 × 10⁻¹ for
24-hour NIHSS stroke score, -8,495 × 10-1 for Glasgow coma at admission, and 2,197×101
for onset -intervention time interval. This model explains 74.3% of the variance of risk of
mortality in stroke patients and the lowest BIC with -1,550 × 103.
RECOMMENDATION
From the above results, we find that it is essential to thoroughly describe the clinical
and paraclinical characteristics of cerebral infarction patients, especially clinical features.
This is the basis for developing educational tools in order to help patients recognize the early
signs of ischemic stroke. The new contribution of this study is its offer of prognosis model
for mortality after 30 days of intervention using Bayes regression model, establishing
predictive nomogram based on NIHSS stroke score, Glasgow coma score and onset-tointervention duration; even though atrial fibrillation + appears with a low frequency of 4.2%
in one model (the third of the 5 best models offered by BMA). In fact, nomograms are more
suitable and convenient to use than other tools because they can be used at bedside, and
choose the best model based on clinical reality. Therefore, we recommend a survey on a
larger number of sample sizes to increase the accuracy of the prognosis model and the
predictive nomogram - from which this model can be applied in emergency department,
intensive care unit, or stroke units.