In situ determination of nitrification kinetics and performance characteristics for a bubble washed bead filter
Bạn đang xem bản rút gọn của tài liệu. Xem và tải ngay bản đầy đủ của tài liệu tại đây (4.17 MB, 29 trang )
In-situ Determination of Nitrification Kinetics and
Performance Characteristics for a Bubble-washed Bead
Filter
James M. Ebeling1* and Fredrick W. Wheaton 2
1*8470 Lakenheath
Silver Point, TN 38582 USA
2
Biological Resources Engineering Department
University of Maryland
College Park, MD 20742 USA
*Corresponding author
Keywords: nitrification, kinetics, bubble-washed bead filter, Monod
kinetics model, performance evaluation
ABSTRACT
Intensive recirculating aquaculture systems rely almost exclusively on
some form of fixed-film biofilter for nitrification. Currently there is no
standardized way to determine and report biofilter performance to
facilitate user selection among the numerous options. This type of
information is critical for the end user, and also important for both the
design engineer and the manufacturer. In an attempt to address this issue,
a simple procedure for estimating nitrification reaction rate kinetics is
described and applied to a bubble-washed bead filter. Reaction rate
kinetics were determined through a series of batch reaction rate
experiments with a commercially available 0.06-m3 (2.0-ft3) bubblewashed bead filter. Empirical mathematical models for the nitrification of
ammonia-nitrogen to nitrate-nitrogen were developed. The kinetics of
nitrification were found to fit a simple first-order reaction model, when the
ammonia-nitrogen concentration was less than 1 mg NH4 -N/L, and a
zero-order reaction when the ammonia-nitrogen concentration was
International Journal ofRecirculating Aquaculture 7 (2006) 13-41. All Rights Reserved
© Copyright 2006 by Virginia Tech and Virginia Sea Grant, Blacksburg, VA USA
International Journal of Recirculating Aquaculture, Volume 7, June 2006
13
Nitrification kinetics and performance characteristics
greater. The exact breakpoint between first- and zero-order reaction
kinetics was found to be a function of the flow rate. In addition, the firstorder kinetic reaction rate constants were also a function of the flow rate,
reflecting the influence of high nutrient gradients and associated higher
nutrient gradient across the biofilm. No effect of flow rate was found for
the zero-order reaction rate constants. Kinetic reaction rate parameters,
maximum reaction rates, and half-saturation constants were determined
for the Monod kinetics model as functions of hydraulic loading rate.
Based on these results, an evaluation tool was proposed to help
characterize bead filter performance based on reaction rate kinetics. A
series of performance characteristic curves were developed to show
maximum removal rates as a function of ammonia-nitrogen concentration
and flow rates through the bubble-washed bead filter.
INTRODUCTION
All recirculation systems require basic unit operations to remove
particulate solid wastes, biological filters to oxidize toxic ammonia and
nitrite-nitrogen to nitrate-nitrogen, and aeration or oxygenation of the
water to remove carbon dioxide and increase oxygen concentrations
(Timmons et al. 2002). Additional unit processes can be added depending
on the scale of production and the unique water-quality parameters
required for each species, such as pH control, foam fractionation, ozone,
and disinfection systems (Timmons et al. 2002). Over the past few years,
numerous solutions have been proposed and developed to handle each
one of these unit operations and processes. At the same time, entire
recirculation systems and individual components have become available
commercially for almost any scale production facility.
This segment of the aquaculture industry relies almost exclusively on some
form of fixed film biofilter for nitrification, such as those found in trickling
towers, fluidized-bed, floating bead, and rotating biological contactors.
The advantages of these forms of biofilter include resistance to shortterm toxic loads, ability to perform at low influent concentrations, and
high volumetric biomass concentrations (Rieffer et al. 1998). In addition,
the high cell-residence time of a fixed-film biofilter is needed for the low
growth rates of both ammonia oxidizing bacteria and nitrite oxidizing
bacteria. In November 2004, the Oceanic Institute sponsored a workshop
entitled: Design and Selection of Biological Filters for Freshwater and
14
International Journal of Recirculating Aquaculture, Volume 7, June 2006
Nitrification kinetics and performance characteristics
Marine Applications. During the four-day workshop, numerous papers were
presented, reviewing the many types and applications of biological filters in
aquaculture. One of the problems discussed was the lack of a standardized
way to determine and report biofilter performance to facilitate user selection
among the numerous types of biofilters. One entire afternoon was spent
discussing standardized evaluation rating of biofilters from the design
approach, and the manufacturer's and user's perspectives in relationship to
their capital and operational costs. Malone (2004) recommended using a
set of standardized conditions for rating biofilter performance consisting of:
chemical feed of ammonia-nitrogen, excess dissolved oxygen concentration,
alkalinity greater than 150 mg/L CaC03, pH of approximately 7.5, and
temperature of 20°C. In addition, Malone recommended that specialized
conditions for low-temperature performance evaluation could be conducted
at 10°C. Malone also suggested that biofilter performance be evaluated
at several levels of ammonia-nitrogen concentration reflecting his
categorization of aquaculture systems as shown in Table 1.
In the past, the selection of the most applicable biofilters for any given
species, production level or economic consideration has for the most part
been by "rules of thumb" and operating experience based on existing
systems. Today, with the commercial availability of standardized families
of biofilters, there exists the potential to fully characterize their operating
parameters and develop sets of characteristic curves, reflecting ammonianitrogen removal rates as a function of operating parameters such as
hydraulic loading rates and ammonia-nitrogen concentrations. The
overall objective of this study was to develop a simple biofilter evaluation
process that could be used to characterize the nitrification removal rate
as a function of several simple operating parameters for a bubble-washed
bead filter, most importantly, hydraulic loading rate of the biofilter and the
operating level of ammonia-nitrogen.
Table 1. Aquaculture systems classification and corresponding ammonianitrogen level.
Classification
System
TAN(mg/L)
Ultra Oligatrophic
Oligatrophic
Larval rearing system
Broodstock holding system
< 0.1
Mesotrophic
Eutrophic
Hypertrophic
Fingerling production system
Growout systems
Hardy species growout
<0.3
<0.5
< 1.0
< 5.0
International Journal of Recirculating Aquaculture, Volume 7, June 2006
15
Nitrification kinetics and performance characteristics
BACKGROUND
The concept of using a floating plastic media as biofilter media dates
back to the mid-1970s, when they were first used at the Dworshak
National Fish Hatchery (Cooley 1979) for the rearing of food and game
fish. Although successful, the air-washed bead filter design did not find
wide acceptance. In the late 1980s, a hydraulically washed bead filter,
which combined both solids capture and biofiltration, was developed at
Louisiana State University (Wimberly 1990). Later development of the
mechanically washed bead filter (Malone 1992, 1993, 1995) overcame
many of the operational difficulties of earlier designs and it proved to be
compact and simple to operate (Malone et al. 1998, 2000). Malone et al.
(1993) developed the bubble-washed bead filter initially for the outdoor
ornamental or garden-pond market. Since then, the bubble-washed
bead filter has found wide application for small aquaculture systems,
combining clarification and biofiltration in a single unit. Most recently, an
air-driven recirculating system employing a bubble-washed bead filter has
been designed and tested by DeLosReyes et al. (1997), to minimize the
complexity and energy requirements of commercial recirculation systems.
Bead filters are classified as expandable granular biofilters (EGB),
which include upflow and downflow sand filters. EGB biofilters offer the
competitive advantage of using smaller media with corresponding higher
specific surface areas per unit volume when compared to other treatment
devices such as trickling filters and RBCs. The higher specific surface
area translates into smaller biofilter size. The application of sand filters in
aquaculture is limited by the inherent constraint on ammonia conversion
due to oxygen limitations in the bed, the high pressure required for
fl.uidization, and the excessively high water use for back flushing. These
shortcomings were overcome with low-density plastic beads, which fl.oat.
Filtration of suspended solids is accomplished by settling, straining, and
interception within the granular bead matrix (Malone et al. 1993). The
plastic beads themselves act as a fixed-bed bioreactor for the growth of
nitrifying bacteria on the surface and in the pore spaces between the
beads. As the solids and bacterial biomass accumulate, the head loss
across the filter bed increases and the hydraulic conductivity decreases.
The transfer of oxygen and nutrients to the bacteria is reduced, reducing
the nitrification capacity of the filter. During the backwashing cycle,
the beads are agitated and homogenized, dislodging trapped solids and
shearing off excess biofl.oc from the beads.
16
International Journal of Recirculating Aquaculture, Volume 7, June 2006
Nitrification kinetics and performance characteristics
When the floating-bead filter is operated under low solids loading, or
frequent backwashing, it should behave like a classical fixed-bed biofilm
reactor. Under these conditions, the exchange of soluble substrate between
the recirculated water and the attached biofilm is relatively unimpeded
and the nitrification process can be described by a simple Monod
expression. Malone and Beecher (2000) summarized the performance of
floating-bead filters based on the three application categories: broodstock,
fingerling, and growout, and listed criteria for the sizing of filters based
on feed application rates with the primary method for sizing based on
volumetric organic loading rates. Table 2 lists typical values for several
performance parameters based on operational filters (Wimberly 1990,
Sastry et al. 1999). Table 3 presents interim guidelines for the design
of systems using floating bead biofilters for both clarification and
biofiltration filters (Malone and Beecher 2000).
Table 2. Some typical values for performance parameters for floatingbead biofilters (Malone et al. 1998)
Performance parameter
Broodstock Fingerling
Feed loading (kg feed /m3 media day)
<4
<8
Design TAN (mg/L)
0.3
0.5
VTR* (g TAN/m3 media)
35 - 105
70 - 180
3
0 2 consumption (g Ozfm media day)
0.7 - 2.5
1.4 - 2.5
Temperature (°C )
20-30
20-30
pH
6.5 - 8.0
6.8 - 7.0
Alkalinity (mg/L CaC03)
>50
>80
Growout
<16
1.0
140 - 350
2.5 - 3.0
20-30
7.0- 8.0
>100
*V/'R = volumetric TAN removal rate
Table 3. Interim guidelines for the design ofsystems utilizing floating bead
Design parameter
Broodstock Fingerling Growout
Bead volume (m media /kg of feed day) 0.250
0.125
0.062
Circulation rate (Lpm /kg feed day)
208
83
50
Fish density (kg/m3)
15
10
60
TAN loading (g/m3 media day)
84
168
339
3
832
664
Hydraulic loading (Lpm /m media)
806
HRT (days)
11
16
25
32
40
33
Tank turnover rate (min)
3
International Journal of Recirculating Aquaculture, Volume 7, June 2006
17
Nitrification kinetics and performance characteristics
These guidelines were developed by examining a wide range of operating
systems of various sizes, species selection, and operation management
protocols. In an attempt to standardize the characterization of biofilter
performance and in particular, the bubble-washed floating bead filter,
a series of batch performance evaluation tests were conducted to
characterize the nitrification reaction rates as a function of ammonianitrogen concentration and fl.ow rate through the filter. Several nitrification
models including simple zero-order and first-order kinetic reaction rates
and Monod kinetics were examined to determine how well they fit the
experimental data and the corresponding kinetic reaction rate constants
were estimated.
MATERIALS AND METHODS
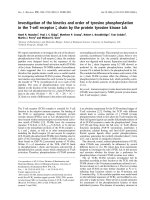
Two commercially available 57-L (2.0-ft3) bubble-washed bead filters
(Model BBF-2P, Aquaculture Systems Technologies, LLC, New Orleans,
LA, USA) were employed (Figure 1) for the evaluation trials. The two
biofilters were part of a research program,
characterizing over time the physical and
chemical properties of the solids, dissolved
nutrient, and organic substances found in four
separate recirculation system designs (Ebeling
et al. 1998a, Ebeling et al. 1998b, Singh et
al. 1999). Each of the four systems consisted
of a fiberglass 2.0-m3 circular culture tank
combined with either a settling basin or a
rotating microscreen drum filter with a 60µm screen and either a trickling tower or a
bubble-washed bead filter, forming a 2x2
factorial experimental design. Total volume of
each system was estimated at 2.13 m 3• Each
system had been initially stocked with 320
Figure 1. 57 L (2 jt3)
bubble-washed bead
hybrid striped bass (average weight 100 g)
which were fed a commercial diet at 1.5 to 2 filters (Model BBF-2P,
Aquaculture Systems
percent of body weight once per day. At the
time of the kinetic reaction rate experiments, Technologies, LLC, New
Orleans, LA, USA)
the filters had been in continuous operation
for over 24 months and had a well-established
biofilm.
18
International Journal of Recirculating Aquaculture, Volume 7, June 2006
Nitrification kinetics and performance characteristics
The bubble-washed bead filters have an "hourglass" shaped internal
geometry with a constricted washing throat. During continuous filtration,
water from the production tank enters from the bottom through a slotted
inlet pipe, flows upward through the bed of floating polyethylene beads,
and exits through a slotted discharge pipe at the top. The inlet pipe also
serves as a sludge discharge line during backwashing. Backwashing
consists of completely draining all the water from the filter, causing the
beads to be sucked through the washing throat, where they are vigorously
scrubbed by cavitation and bubbles from the air inlet valve. The solidsladen water is discharged and the filter refilled, and placed back into
operation. Each biofilter contained approximately 57 L of food-grade
polyethylene beads, with a mean diameter of 4.4 mm, porosity of 35
percent and a specific surface area of 1050 m 2/m3 (Sastry et al. 1999).
At the conclusion of the above mentioned research project, the fish
were removed and the research tanks cleaned and refilled with tap
water. The four recirculation systems were then operated for a period
of time (approximately 3 weeks) with inorganic ammonia-nitrogen
(ammonium chloride) as the sole source of ammonia by a daily addition
of approximately 20 to 25 g of NH.iCl, bringing the ammonia-nitrogen
concentration in the tanks to between 2.5 and 3.0 mg-N/L. In addition,
each bubble-washed bead filter was backwashed every other day to
remove excess biofloc from the system. Heterotrophic bacterial growth
was assumed minimal in the biofilters due to the removal of the fish, the
backwashing of the systems, and the extended length of time (3 weeks)
with little available carbon for their growth.
Each batch nitrification reaction rate trial consisted of spiking each tank
with 20 g NH.iCl and then monitoring water quality in the tanks and the
influent and effluent of the individual bead filters at 30-minute intervals
until the ammonia-nitrogen concentrations were too low to accurately
measure or for a maximum of 8 hours. A range of flow rates through the
biofilters was investigated from approximately 10 Lpm to 100 Lpm. These
flow rates bracket the design loading rates for the bubble-washed bead
filter suggested by Malone and Beecher (2000) from 400 to 800 Lpm/m3
of beads. All experiments were conducted at room temperature, which
varied from 20 to 22°C. Each trial's flow rate was randomly selected from
a low flow rate followed by a high flow rate.
International Journal of Recirculating Aquaculture, Volume 7, June 2006
19
Nitrification kinetics and performance characteristics
The following water quality parameters for the influent and effluent of the
biofilter were measured at 30-minute intervals by withdrawing a sample
into a 250-mL Erlenmeyer glass flask:
• ammonia-nitrogen (Hach Nessler Method No. 8038 adapted from
Standard Methods: 4500-NH3, APHA 1995) using a HACH
DREL/2000 spectrophotometer,
• pH using a Fisher-Scientific Accumet pH Meter 25 (calibrated daily at
4, 7.02, and 10 pH),
• dissolved oxygen and temperature using a YSI Model 58 DO meter (air
calibrated method daily),
• alkalinity following standard methods, 2320 B/Titration Method
(APHA 1995).
Flow rates through the biofilters were determined by weighing a 20-L
bucket of filter discharge water collected over a known time period.
The kinetic reaction rate for the removal of ammonia-nitrogen, ra, was
evaluated based on the change in concentration of ammonia-nitrogen
across the filter divided by the hydraulic retention time in the filter, or:
- dCF
ra- -- (C-Ce) * 1440 m13n
dt
VFIQ
day
(1)
where: ra = kinetic reaction rate (g/m3 day)
dCF =change in ammonia-nitrogen across biofilter [mg/L]
Ci = concentration in influent to biofilter [mg/L]
Ce= concentration in effluent from biofilter [mg/L]
VF = volume of biofilter [L]
Q =flow rate through biofilter [Lpm]
Figure 2 shows an example of kinetic reaction rate for the removal
of ammonia-nitrogen with respect to influent ammonia-nitrogen
concentration for several flow rates through the bubble-washed bead filter.
20
International Journal of Recirculating Aquaculture, Volume 7, June 2006
Nitrification kinetics and performance characteristics
system configuration, and economic constraint. Thus, a purely empirical
approach is taken here to describe the bead filter's nitrification kinetics as
a function of ammonia-nitrogen concentration and flow rate through the
filter. From this analysis a series of design curves very similar to pump
design curves can be developed that will help the design engineer select
the most appropriate filter size and flow rates based on ammonia-nitrogen
concentrations desired within the system.
Empirical Model - Reaction Rate Order
The approach used to develop design equations for the biological filters
was based on the assumption that the rate of reaction was proportional to
the n1h power of the concentration:
ra = dCa = k x C n
dt
a
(2)
where k is the reaction rate constant, Ca is ammonia-nitrogen
concentration, and n is the reaction rate order. The reaction rate order can
then be obtained by plotting the log of both sides, or:
log (ra) = log(k) + n log (Ca)
(3)
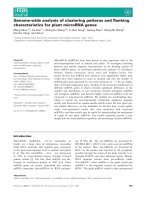
Thus, a log-log plot of the experimental data should yield a straight line
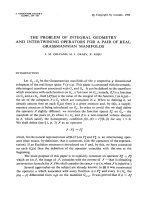
whose slope corresponds to the order of the reaction rate, n. An example
of the resulting plot for the bubble-washed bead filter is shown in Figure
3. This plot and others suggested that the design equation for the rate of
reaction could be divided into simple first- and zero-order equations, i.e. n
= 1andn=0.
The first- and zero-order data range for these plots was.determined by
starting at the lowest and highest values of ra, and then sequentially
adding data points one at a time, until there was a significant change
in the R 2 value for the two regression lines. Figure 3 demonstrates that
near the breakpoint value, the data no longer conform to the simple
interpretation outlined above. As Figure 3 shows, at this flow rate
and for low concentrations of ammonia-nitrogen, less than 1.0 mgN/L, the reaction rate order is approximately 1.0. Moreover, for higher
concentrations (greater than 1.0 mg-N/L), the reaction rate order appears
to be approximately zero. For the purposes of aquaculture system design,
22
International Journal of Recirculating Aquaculture, Volume 7, June 2006
Nitrification kinetics and performance characteristics
2.9
•
~
"c::I
....,
e
2.5
~c
.!2
y.,
2.3
bb
Q
2.7
y = -0.005x + 2.771
R2 = 0.001
~ 2.1
c;,
0
..J
y = 0.979x + 2.761
1.9
R2 = 0.995
1.7
-0.8
-0.6
-0.4
-0.2
0.0
0.2
0.4
LOG (Ammonia-nitrogen concentration, mg/L)
Figure 3. Example ofa kinetic reaction rate order analysis for bubble-washed
bead filter # 1, flow rate of39.3 Lpm.
this demarcation between first- and zero-order reaction rate corresponds
approximately to the two ranges of ammonia-nitrogen concentrations
usually encountered in commercial intensive recirculating aquaculture
systems. Alternatively, using the classification system proposed by Malone
(2004), biofilters designed for larval rearing, fingerling, and broodstock
systems would be based on first-order reaction rates, whereas systems
designed for growout could be based on either first- or zero-order reaction
rates, depending upon species ammonia-nitrogen tolerance.
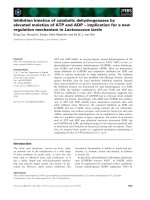
By extrapolating the linear regression lines for the two rate equations,
a breakpoint concentration can be found that corresponds to the
concentration where the overall reaction rate shifts from a first-order
relationship to a zero-order relationship. The exact value can be found
by equating the two regression equations, and solving for the ammonianitrogen concentration. Table 4 lists these values as a function of both
flow rates through the filters and the corresponding hydraulic retention
time. Figure 4 shows the values of the break point as a function of the
flow rate through the bubble-washed bead filters.
International Journal of Recirculating Aquaculture, Volume 7, June 2006
23
Nitrification kinetics and performance characteristics
Table 4. Ammonia-nitrogen concentration break point between first- and
zero-order reaction kinetics for the two bubble-washed bead.filters.
HRT 1 (min)
Flow (Lpm)
Break point (mg-NIL)
4.32
3.80
3.63
2.60
2.59
13.2
15.0
1.47
1.48
15.7
21.9
22.0
1.18
1.07
1.87
1.82
30.5
31.3
1.45
39.3
44.6
1.28
1.05
1.19
0.89
0.92
1.02
0.86
54.2
59.0
0.88
0.95
0.77
0.71
HRT =hydraulic retention time
0.98
60.0
74.l
0.88
0.47
0.65
80.6
0.65
1
1.6
,...._
~5
c
·s
Q.,
~CQ
••
1.2
···········•·········································
•
0.8
y = -0.0!0x + 1.403
0.4
R2 = 0.741
o.o+-.......--.-..---.-.......-.--....-...............--...-.......--..-..---.-...............--...--.
0
IO
20
30
40
50
60
Flow through bead filter (Lpm)
70
80
Figure 4. Ammonia-nitrogen break point concentrations between first- and
90
zero-order kinetic reaction rates for the bubble-washed bead.filters as flow rate
through the biofilter.
24
International Journal of Recirculating Aquaculture, Volume 7, June 2006
Nitrification kinetics and performa.nce characteristics
Empirical Model - First- and Zero-Order Reaction Rate Constants
Based on the above results, the design equations for the biological filters
were divided into either a first- or a zero-order kinetic reaction rate,
depending upon the influent ammonia-nitrogen concentration and the
break point concentration. Thus where the influent ammonia-nitrogen
concentration is relatively low(< 1 mg/L NH4 -N), the reaction rate can be
modeled as a first order reaction using Equation 4:
dCa =-k xC
dt
I
a
(4)
where: Ca= ammonia-nitrogen concentration [mg/L]
k 1 =first-order reaction rate constant [day1]
When the above differential equation is integrated once, a plot of In Ca
versus time should yield a straight line with slope equal to the first-order
reaction rate constant, k 1• Figure 5 shows several plots at various flow
rates through the bead filter. A simple regression analysis of the resulting
straight line (Figure 5) less than the break point concentration should
correspond to the first-order reaction rate coefficient, k 1• This slope was
estimated by starting at the break point between first- and zero-order
reactions previously calculated and successively deleting data points to the
regression analysis to maximize the R 2 value.
Correspondingly, for higher influent ammonia-nitrogen concentrations
(> 1 mg/L N~-N), the reaction rate kinetics can be modeled as a zero
order reaction rate using Equation 5:
dCa --k
0
dt where:
ko =zero-order reaction rate constant
(5)
[g/m3 day]
The zero-order reaction rate coefficient can be estimated by a simple
regression analysis of the slope of the straight line found by plotting
ammonia-nitrogen concentration versus time, Figure 6, or a mean value
and standard deviation could be estimated by averaging the removal
reaction rates at ammonia-nitrogen concentrations greater than the break
point concentration. Table 5 presents summaries of the first-order and
zero-order reaction rate coefficients for the bubble-washed bead filter.
International Journal of Recirculating Aquaculture, Volume 7, June 2006
25
Nitrification kinetics and performance characteristics
Table 5. First- and zero-order kinetic reaction-rate coefficients, bubblewashed bead filter
first-order rate constant
Regression
Flow Rate
kl
1
(Lpm)
(day )
R-squared
Bubble-washed bead filter #1
13.2
256
0.99
283
0.98
15.7
22.0
424
0.96
482
0.98
30.5
0.99
39.3
586
54.2
634
0.98
60.0
712
0.47
681
0.76
66.3
80.6
827
0.83
1014
0.99
99.7
Bubble-washed bead filter #4
15.0
275
0.99
21.9
332
0.98
437
31.3
0.99
44.6
588
0.95
681
0.99
59.0
74.l
712
0.89
92.5
905
zero-order rate constant
StDev
ko
(g/m3 day)
(g/m3 day)
396
433
478
499
588
609
500
427
611
544
380
439
403
535
525
618
432
87
19
16
12
29
18
48
39
74
38
22
44
16
46
39
63
81
Empirical Model - Monod Reaction Rate Parameters
Hagopian and Riley (1998), Williamson and McCarthy (1976a), Sma
(1975), and other researchers suggested the use of a single- or doublesaturation equation, where either the influent ammonia-nitrogen or
dissolved oxygen concentration or both may limit the reaction rate. The
overall kinetic reaction rate then becomes:
dC0
dt
--=-r
(6)
International Journal of Recirculating Aquaculture, Volume 7, June 2006
27
Nitrification kinetics and performance characteristics
and Nitrobacter acclimated to a narrow range of ammonia-nitrogen
concentration, this analysis looks at a "real-world" biofilter in-situ, with
all the confounding factors that affect commercial production biofilters.
These include the impact of heterotrophic bacteria, a wide range of influent
or system ammonia-nitrogen concentrations due to varying feed rates
and times, system upsets, stress and disease of the cultured animals, and
numerous other factors. It is the authors' opinion that measurements made
on these types of systems will better represent actual "real-world" biofilters.
It is interesting to note that the reaction rates determined by pure laboratory
systems usually present maximum nitrification rates significantly higher
than those seen in "real-world" production systems. This difference is then
explained as being due to the impact of total organic carbon, temperature,
salinity, or some other mitigating factor.
Empirical Model - Reaction Rate Order
In the application of a first- and zero-order kinetic reaction rate model,
one of the parameters of interest in design and sizing of biofilters is the
value of ammonia-nitrogen corresponding to the break point between the
two models. First-order kinetic reaction rates are directly dependent on
the influent ammonia-nitrogen concentration, whereas zero-order rates
are independent of influent ammonia-nitrogen concentration. The break
point concentration would reflect the change from a diffusion rate limit
on nitrification to a reaction rate limit. Experimentally determined break
point values for bead filters are plotted versus the flow rate through the
biofilter in Figure 4. Two things are of interest, first the almost linear
relationship with flow rate, and the range of values from 1.5 mg/L at
the lowest flow rates to approximately 0.5 mg/L at the highest rates (R 2
value of 0.74). Second, the decrease in the break point ammonia-nitrogen
concentration as the flow rate increases. Based on the guidelines for
the design of systems utilizing floating-bead filters, Table 3, (Malone
and Beecher 2000), the design hydraulic loading (Lpm/m3 media) for
broodstock and growout would correspond to approximately 47 Lpm.
From Figure 4, this would correspond to a break point between first- and
zero-order reaction rates at an ammonia-nitrogen concentration of about
0.9 mg-NIL. This would support the concept that for systems requiring
ammonia-nitrogen concentrations less than 1.0 mg/L, the bubble-bead
filter should be designed based on a first-order reaction rate constant and
for growout of hardy species at ammonia-nitrogen concentrations above 1
mg/I with a zero-order reaction rate constant.
International Journal of Recirculating Aquaculture, Volume 7, June 2006
29
Nitrification kinetics and performance characteristics
Since the external mass transfer of ammonia-nitrogen by diffusion to the
biofilm is directly dependent upon the thickness of the stagnant liquid
layer surrounding the beads, and that thickness depends on the velocity
of the water passing over the beads, it follows that the reaction rate
coefficient should be affected by the water flow rate through the filter.
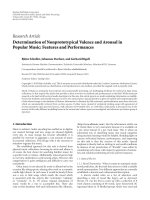
Figure 7 shows the first-order reaction rate parameter as a function of the
flow rate through the biofilter. It demonstrates nicely the effect of flow
rate, in that at low flow rates the reaction rate is significantly lower than
that at the highest flow rate. Thus, the first-order reaction rate coefficient
at a flow rate, Q (Lpm) for the bubble-washed bead filter can be expressed
as:
ki = (7.9* Q+ 197)
(8)
and the first-order reaction rate or removal rate becomes:
dC
=-(7.9*Q+197)xC
dt
a
_a
(9)
1200
c
·c:;
"'
E
"'0
ec >;..
CJ
B
0 "O
800
·.:::::::;
600
"E"0'
400
~
200
e.
kl= 7.92 x (Lpm) + 197
R2 =0.97
1000
CJ~
+Bead Filter #I
.!.
c
CJ Bead Filter #4
0
10
20
30
40
50
60
70
80
90
Flow rate through beadfilter (Lpm)
Figure 7. First-order reaction rate coefficient as afanction of the flow rate
through the bubble-washed bead.filter.
30
International Journal of Recirculating Aquaculture, Volume 7, June 2006
100
Nitrification kinetics and performance characteristics
Empirical Model -Application of First- and Zero-Order Empirical
Model Results
In order to apply the results of this study to the sizing of biofilters, a series
of performance characteristic curves were developed, similar to what
is commonly used in characterizing pump performance. In this case,
the reaction or removal rate (g/m3 day) is plotted against either fl.ow rate
through the biofilters at several values of ammonia-nitrogen or plotted
against ammonia-nitrogen concentration for several different fl.ow rates.
An example of these performance curves for the bubble-washed bead
filter is shown in Figure 8. For this graph, the experimentally derived
values for the first-order reaction rate constant as a function of fl.ow rate
through the biofilter were used (Eq. 8) and the first-order reaction rate
.model, solved for the removal rate of ammonia-nitrogen as a function
of media volume per day (g/m3 day). In addition, the experimentally
determined reaction rates plotted demonstrate the validity of this model,
at least at low ammonia-nitrogen concentrations.
Figure 8 shows clearly the effect of fl.ow rate and ammonia-nitrogen
concentration on the performance of the bead filter. The first observation
is that at low ammonia-nitrogen concentrations, the impact of fl.ow rate is
not as significant as at the higher concentrations. Although the increased
Figure 8. First-order performance characteristic curves for the bubble-washed
bead.filter as afanction offlow rate through the.filter and influent ammonianitrogen concentration.
International Journal of Recirculating Aquaculture, Volume 7, June 2006
31
Nitrification kinetics and performance characteristics
flow rate would theoretically reduce the boundary layer between the
bulk liquid and the biofilm, increasing external mass transfer, the
diffusion rate is also a factor in the concentration gradient. Thus, the
high concentrations yield higher gradients, which in tum yield a higher
nitrification rate.
The second observation from the results is that as the ammonia-nitrogen
concentration increases and, especially at low flow rates through the
biofilter, the reaction moves quickly towards a zero-order reaction rate.
Under zero-order, the ammonia-nitrogen removal rate is constant and
the removal rate is not influenced by the flow rate (Fig. 9). From a design
standpoint, this is important since it suggests that the only way to increase
the first-order biofilter removal rate is either by increasing the ammonianitrogen concentration in the production tanks or, to a limited extent, by
increasing the flow rate through the biofilter. The first choice is limited by
the species being produced and the second by the hydraulic characteristics
of the biofilter, i.e. bursting pressure and the economic cost of pumping.
Figure 9 shows the zero-order reaction rate coefficient as a function of
the flow rate through the biofilter. It shows that there appears to be no
significant effect of flow rate. This is consistent with the concept that the
reaction is kinetic-reaction-rate limited and not a function of the diffusion
rate. The mean value for the zero-order reaction rate coefficient is 495 g/
m 3 day or assuming a specific surface area of 1050 m 2/m3, 0.47 g/m2 day.
800
c
·;:;
"
!E
0
u"
.a
································+····
.........
400
····{···············y···········································································
£~
~
§ .....
·-e ~
+............................ ·····················
600
5~
i:o::
~
"E
~
200
•
Bead Filter #I
c
Bead Filter #4
- - Mean Value 495 g/m' day
N
·········+/StDev
10
20
30
40
so
60
70
80
90
100
Flow rate through bead filter (Lpm)
Figure 9. Effect offlow rate on the zero-order reaction rate coefficient, showing
the mean value o/495 glm3 day± standard deviation.
32
International Journal of Recirculating Aquaculture, Volume 7, June 2006
Nitrification kinetics and performance characteristics
MonodModel
The simplified first- and zero-order reaction rate model can be useful in
understanding and characterizing biofilter performance for either very
low or very high ammonia-nitrogen concentrations. Its major drawback
is characterizing the biofilter performance near the break-point between
the two models, around 1.0 mg/L ammonia-nitrogen. To overcome this
difficulty, most models of biofilms use some form of saturation equation
such as the Monod relationship, Equation 6 and 7.
It can be shown that the break point concentration, Cbp. determined for the
simple empirical kinetic-rate model is approximately equal to the Monod
half-saturation coefficient. This is accomplished by equating the Monod
equation for high and low values of C in relation to K 112 •
Thus, at high values of ammonia-concentration and Equation 7:
Ca>> K112
dCa
dt
--=rmax
(10)
And at low values of ammonia-nitrogen concentration:
Ca<
dCa
dt
Ca
K112
--=rmax•-(11)
Equating the two models at the break-point concentration, Cbp• yields:
(12)
Thus it becomes possible to estimate the break point between first- and
zero-order reaction rates from the Monod reaction rate coefficient. This
would suggest that the half-saturation coefficient also would correspond
approximately to the break point between kinetics controlled by diffusion
across the stagnant layer next to the biofilm and kinetics controlled by the
kinetic reaction rates of the bacterial film.
The half-saturation coefficient and the maximum reaction rate coefficient
are shown in Figure 10 and 11 in relationship to the flow rate through the
biofilter. It is interesting that there appears to be a relationship between
International Journal of Recirculating Aquaculture, Volume 7, June 2006
33
Nitrification kinetics and performance characteristics
the half-saturation coefficient and the flow rate through the biofilter,
similar to what was seen for the first-order reaction rate coefficient,
although in this case the relationship is reflected in a decrease in value
rather than an increase. Similarly with the zero-order reaction rate
1.50
c.,
1.25
IS.,
1.00
y = -0.0092x + 1.25
R2 =0.74
'
.,<> ,..._
0
-e! :z
..:i
..a§ bb
..
·=..
8
0.75
tl.
~
fll
:i::
0.50
+ Half-saturation Coefficient
0.25
•
::t:: Break point
0.00
10
20
30
40
50
60
70
80
90
100
Flow rate through bead filter (Lpm)
Figure JO. The relationship between the half-saturation coefficient and the
flow rate through the bead.filter, along with the break point values determined
experimentally.
1000
,.. ~-=---f. . .r.. f--r.. ·f-+.. - ·. .t·f................
900
~c:
800
,..._
0 >.
·~ ~
:!:? ...,
e!'l
700
··················!············
........
8 8
·~
600
J........................i ...
li
~
500
400
0
IO
20
70
30
40
50
60
Flow rate through the bead filter (Lpm)
80
90
100
Figure 11. The relationship between the maximum reaction rate coefficient and
the flow rate through the beadfilter, showing a mean value of 764 glm3 day and±
one standard deviation (94 g/m3 day).
34
International Journal of Recirculating Aquaculture, Volume 7, June 2006
Nitrification kinetics and performance characteristics
are applicable over the entire range of ammonia-nitrogen concentrations.
The end product of this evaluation technique is a set of design curves that
can be used by engineers to properly size a biofilter for a given intensive
recirculation system design and production species. In addition, existing
systems can be evaluated to determine if they are operating at maximum
removal rate for a given flow rate and operating ammonia-nitrogen
concentration. From the performance curves, suggestions can be made
on how to improve overall removal rate or filter efficiency by modifying
the flow rate through the biofilter or adjusting the ammonia-nitrogen
concentrations in the production system. However, both modifications
have limitations due to the increased cost of pumping either water or
species-specific ammonia-nitrogen tolerances.
Figure 12 displays the ammonia-nitrogen removal rate as a function of
ammonia-nitrogen concentration based on the Monod relationship for four
flow rates. Starting with the loading regime corresponding to broodstock
holding or a very light feeding regime, the experimentally determined
removal rates span almost exactly the range of volumetric nitrification
rates reported by Malone et al. (1998). At the recommended flow rate
of 11 Lpm, the removal rate at the highest recommended ammonia-
-----------
--
500
i
M
§
~
Oi
>
0
e
---
400
22Lpm
300
13.2 Lpm
200
~
0.0
0.2
0.4
0.6
0.8
1.0
1.2
Influent ammonia-nitrogen concentration (mg-NIL)
Figure 12. Performance characteristic curves for the bubble-washed bead.filters,
based on the experimentally determined Monod coefficients as a fanction ofthe
ammonia-nitrogen concentration, showing the three fish life-stage application
levels ofammonia-nitrogen concentration.
36
International Journal of Recirculating Aquaculture, Volume 7, June 2006
Nitrification kinetics and performance characteristics
nitrogen level is equal to the lower value suggested by Malone et al.
(1998). For the moderate loading regime of ornamentals, the removal rates
corresponding to the recommended flow rate of 22 Lpm curve, bisecting
the range of recommended removal rates. Finally, for the growout loading
regime or the heavy loading rate, the removal rates corresponding to
the recommended flow rate of 45 Lpm covers the full range of reported
removal rates from the low end to the high end of 450 g/m3 day. Malone,
et al. (1998) reported that, based on their group's experimental data, an
ammonia-nitrogen removal rate of 350 g/m3 day would be expected under
normal operation conditions for a production tank TAN concentration of
0.75 mg/L. This is similar to what the experimentally-based performance
curves developed in this research suggest as the removal rate for a flow
rate of approximately 45 Lpm and TAN concentration of 0.75 mg/L,
shown in Figure 13. This graph also shows the recommended flow rates
for the three production classifications and the corresponding ammonianitrogen removal rates.
600
l.OOmg/L
500
>:
...,
~
§
!
~0
E
Cl.I
0.75 mg/L
400
0.50mg/L
300
0.25 mg/L
200
~
0.10 mg/L
100
0
0
10
20
30
40
50
60
70
80
90
100
Flow rate through the bead filter (Lpm)
Figure 13. Performance characteristic curves for the bubble-washed beadfilters,
based on the experimentally determined Monod coefficients as a function ofthe
flow rate through the bead filter.
International Journal of Recirculating Aquaculture, Volume 7, June 2006
37