Effect of dietary carbohydrate level on growth
Bạn đang xem bản rút gọn của tài liệu. Xem và tải ngay bản đầy đủ của tài liệu tại đây (175.4 KB, 5 trang )
Aquaculture 295 (2009) 238–242
Contents lists available at ScienceDirect
Aquaculture
j o u r n a l h o m e p a g e : w w w. e l s ev i e r. c o m / l o c a t e / a q u a - o n l i n e
Effect of dietary carbohydrate level on growth performance of juvenile spotted
Babylon (Babylonia areolata Link 1807)
Li-Li Zhang, Qi-Cun Zhou ⁎, Yi-Qiu Cheng
Laboratory of Aquatic Economic Animal Nutrition and Feed, College of Fisheries, Guangdong Ocean University, Zhanjiang 524025, People's Republic of China
a r t i c l e
i n f o
Article history:
Received 26 April 2009
Received in revised form 25 June 2009
Accepted 29 June 2009
Keywords:
Babylonia areolata
Carbohydrate utilization
Growth
Enzyme activity
a b s t r a c t
A growth trial was conducted to determine the effects of dietary carbohydrate level on growth performance,
feed utilization and metabolism of juvenile spotted babylon. Six isonitrogenous and isoenergetic
experimental diets (48% crude protein and 15 MJ kg− 1 diet) using wheat starch as the carbohydrate source,
were formulated to contain six carbohydrate levels. Triplicate groups of 45 animals (initial average weight,
168.39 ± 0.69 mg) were stocked in 120-l tanks and fed to apparent satiation twice daily for 10 weeks. Growth
performance and feed utilization were significantly affected by dietary carbohydrate level. Maximum weight
gain and specific growth rate occurred at 20% dietary starch inclusion, survival and soft body to shell ratios
were not significantly different among diets. There were significant differences in protein, lipid, moisture and
glycogen content in soft body. Glycogen content in soft body was positively correlated with dietary starch
level. The activities of glucose-6-phosphate dehydrogenase and fructose-1,6-bisphosphatase were significantly affected by dietary starch level, with both peaking in the 20% treatment; however, there were no
significant differences in 6-phosphofructokinase activity in any treatment. Quadratic regression analysis of
weight gain against dietary starch level indicated that the optimal dietary carbohydrate level for maximum
weight gain of juvenile spotted babylon is 27.1% of dry diet.
© 2009 Elsevier B.V. All rights reserved.
1. Introduction
The known geographical distribution of spotted babylon (Babylonia
areolata) extends from Sri Lanka and the Nicobar Islands through the
Gulf of Siam, along the Vietnamese and Chinese coast to Taiwan (Altena
et al., 1981). B. areolata is nowadays one of the most extensively cultured
marine mollusks in the Southeast Asian countries, and it is the second
most economically important marine gastropods for human consumption in Thailand (Kritsanapuntu et al., 2009). It had many biological
attributes and market characteristics necessary for profitable aquaculture, and it is considered a promising new candidate for aquaculture
in China (Zhou et al., 2007a). Traditional culture of this spotted babylon
mainly depends on minced small fish or crabs. However, the limited
supply of trash fish or crabs as the main feed sources for grow-out could
be the main constraint to culture of spotted babylon in China, because of
difficulty in storage, variable nutritional quality and low feed conversion
rate. Therefore it is necessary to conduct nutritional research and to
develop nutritionally balanced feeds for the spotted babylon.
Limited research has been conducted on the nutrient requirements
of spotted babylon (Ke et al., 1997, 2007; Xu et al., 2006; Zhou et al.,
2007a,b). Based on the above mentioned research, optimum protein
and lipid requirements of spotted babylon ranged from 37% to 45% and
⁎ Corresponding author. Tel.: +86 759 2362270; fax: +86 759 2362290.
E-mail addresses: , (Q.-C. Zhou).
0044-8486/$ – see front matter © 2009 Elsevier B.V. All rights reserved.
doi:10.1016/j.aquaculture.2009.06.045
from 6.54% to 10.74%, respectively. Information on nutritional
requirements of major dietary components such as protein and
energy is a prerequisite for the formulation of an inexpensive and
balanced diet for aquatic species. Carbohydrate has been given priority
in nutritional studies for its protein-sparing effect because it is one of
the principal energetic components which has lower relative cost than
protein and lipid (Shiau and Lin, 2001; Keshavanath et al., 2002; Stone
et al., 2003). Information on carbohydrate utilization in mollusks has
mainly been focused on abalone (Thongrod et al., 2003) and scallops
(Enomoto et al., 2000). However, to our knowledge, no information
has been published to evaluate carbohydrate utilization of spotted
babylon. Therefore, the present study was designed to investigate the
effects of dietary carbohydrate level on growth performance, feed
utilization, carcass composition and key enzyme activities in glycolysis
and gluconeogenesis of juvenile spotted babylon.
2. Materials and methods
2.1. Diet preparation
Six isonitrogenous (48% crude protein) and isoenergetic (ca. 15 MJ
gross energy kg− 1) semi-purified diets were formulated to contain
graded levels of wheat starch (uncooked) from 5 to 30% (Table 1). Fish
meal, casein and gelatin were used as protein sources, and pollock
liver oil was used as the lipid source. Isoenergetic diets were made by
adjusting the lipid and cellulose content. Diet ingredients were
L.-L. Zhang et al. / Aquaculture 295 (2009) 238–242
Table 1
Composition and proximate analysis of the experiment diets (% dry weight).
Ingredient
Fish meal
Casein
Gelatin
Wheat starch
Pollock oil
Lecithin
Choline chloride
Monocalcium phosphate
Ascorbyl-2-polyphosphate
Vitamin mixture a
Mineral mixture a
Cellulose
Sodium alginate
Proximate composition (% dry
Crude protein
Crude lipid
Ash
Fiber
Digestible carbohydrate b
Gross energy c (MJ kg− 1)
Dietary carbohydrate levels (%)
5
10
15
20
25
30
30.00
21.84
5.46
5.00
10.90
1.50
0.20
1.50
0.03
0.50
0.50
20.57
2.00
30.00
21.84
5.46
10.00
8.73
1.50
0.20
1.50
0.03
0.50
0.50
17.74
2.00
30.00
21.84
5.46
15.00
6.56
1.50
0.20
1.50
0.03
0.50
0.50
14.91
2.00
30.00
21.84
5.46
20.00
4.39
1.50
0.20
1.50
0.03
0.50
0.50
12.08
2.00
30.00
21.84
5.46
25.00
2.22
1.50
0.20
1.50
0.03
0.50
0.50
9.25
2.00
30.00
21.84
5.46
30.00
0.05
1.50
0.20
1.50
0.03
0.50
0.50
6.42
2.00
matter)
47.51
13.70
7.94
25.76
5.09
14.55
47.61
12.03
7.95
22.30
10.11
14.71
48.98
11.23
8.25
16.52
15.02
15.39
47.97
9.84
8.48
13.86
19.85
15.413
48.92
7.76
8.11
10.32
24.89
15.59
48.58
5.79
8.94
7.03
29.66
15.52
a
Vitamin and mineral mixture was based on Zhou et al. (2007a).
Digestibility carbohydrate = 100 − protein − lipid − ash – fiber.
Gross energy were calculated using energy equivalents 18.81, 35.57, and 14.59 kJ g− 1
for protein, lipid and digestible carbohydrate, respectively.
b
c
ground through an 80-mesh screen. Vitamins and minerals were
mixed by the progressive enlargement method (Zhou et al., 2007a).
Lipid and distilled water (40%, w/w) were added to the premixed dry
ingredients and thoroughly mixed until homogenous in a Hobart-type
mixer. The 1-mm diameter pellets were wet-extruded, and then airdried, sealed in plastic bags and stored frozen at − 20 °C until used.
2.2. Animal rearing and experimental procedures
Juvenile spotted babylon (B. areolata) were obtained from a local
farm. Prior to the start of the trial, animals were acclimated to a
commercial diet (containing 42% crude protein and 6% crude lipid) for
2 weeks and were fed twice daily to apparent satiation. At the
beginning of the feeding trial, juvenile spotted babylon were starved
for 24 h, weighed, and then they were randomly distributed into 18,
120-l cylindrical fiberglass tanks at 45 shells in each tank. The bottom
of each tank was covered with about 4 cm clean sea sand, which
simulated the natural environment that they normally inhabit.
Animals were provided with a continuous flow of sand-filtered
seawater (2 l min− 1) with continuous aeration. Water quality parameters were monitored daily. During the feeding trial, water
temperature ranged from 27.5 to 32.5 °C, salinity from 25 to 27 psu,
pH from 7.6 to 8.0. Ammonia nitrogen was maintained lower than
0.03 mg l− 1 and dissolved oxygen was not less than 6.0 mg l− 1.
Each experimental diet was randomly assigned to three tanks.
Juvenile spotted babylon were fed twice daily at a rate of 3 to 4% wet
body weight for 10 weeks, 30% of the ration was fed at 08:00 h and
70% at 19:00 h at the start of the dark phase when most feeding
activity occurs (Liu and Xiao, 1998). Feed consumption was recorded
for each tank every day. Animals were bulk weighed and counted
every 2 weeks to adjust the feeding rate. Tanks were thoroughly
cleaned and the sea sand was changed biweekly.
239
body tissue were weighed for calculation of soft body to shell ratio.
Soft-body tissues of spotted babylon were pooled, sealed in plastic
bags and stored frozen at −20 °C until analysis. Also, 10 to 15 spotted
babylon animals in each tank were immediately frozen in liquid
nitrogen and then stored at −80 °C until analyzed for glycogen
content and enzymatic activities.
Chemical composition of diets and soft body of B. areolata were
determined by standard methods (Association of Official Analytical
Chemists, AOAC, 1995). Moisture was determined by oven-drying at
105 °C for 24 h. Crude protein content (N × 6.25) was determined
according to the Kjeldahl method after acid digestion using an Auto
Kjeldahl System (1030-Auto-analyzer, Tecator, Hoganos, Sweden). Crude
lipid was determined by ether-extraction using a Soxtec extraction System
HT (Soxtec System HT6, Tecator, Sweden). Ash was determined by muffle
furnace at 550 °C for 24 h. Glycogen of soft body was determined
spectrophotometrically at 620 nm using the anthrone reaction method as
previously described by Garcia de Frutos et al. (1990).
2.4. Enzyme activity analysis
2.4.1. Fructose-1,6-bisphosphatase activities
To measure the activity of fructose-1.6-bisphosphatase (FBPase; EC
3.1.3.11), a frozen sample of soft body was homogenized (dilution 1/10)
in ice-cold buffer (85 mM imidazole-HCl, pH 7.7, 5 mM MgCl2, 0.5 mM
NADP, 12 mM 2-mercaptoethanol, 0.05 mM fructose-1,6-bisphosphate,
2.5 U ml− 1 phosphate glucose isomerase, 0.48 U ml− 1 G6PDH). The
homogenate was centrifuged at 20,000 ×g for 30 min at 4 °C (Metón
et al.,1999, 2003). Enzyme assay was performed as previously described
(Foste and Moon, 1985; Bonamusa et al., 1992) using a Boi-Tek µ-Quart
Microplate Spectrophotometer.
2.4.2. Glucose-6-phosphate dehydrogenase activities
To analyze the glucose-6-phosphate dehydrogenase activity
(G6PD; EC 1.1.1.49), a frozen sample of soft body was homogenized
(dilution 1/10) in ice-cold buffer (8 mM imidazole-HCl, pH 7.7, 5 mM
MgCl2, 1 mM NADP and 1 mM glucose-6-phosphate). The homogenate was centrifuged at 20,000 ×g for 30 min at 4 °C (Metón et al.,
1999, 2003). The assay was performed as previously described (Foste
and Moon, 1985; Bonamusa et al., 1992) using a Boi-Tek µ-Quart
Microplate Spectrophotometer.
2.4.3. 6-phosphofructokinase activities
For measurement of 6-phosphofrutokinase (PFK; EC 2.7.1.11) activity,
a frozen sample of soft body was homogenized (dilution 1/10) in icecold buffer (100 mM Tris–HCl, pH 8.25, 5 mM MgCl2, 50 mM KCl,
0.15 mM ammonium sulfate, 4 mM 2-mercaptoethanol, 10 mM fructose-6-phosphate, 30 mM glucose-6-phosphate, 0.675 U ml− 1 aldolase,
5 U ml− 1 triose phosphate isomerase, 2 U ml− 1 glycerol 3-phosphate
dehydrogenase). The homogenate was centrifuged at 20,000 ×g for
30 min at 4 °C with the assay performed as previously described (Foste
and Moon, 1985; Bonamusa et al., 1992) using a Boi-Tek µ-Quart
Microplate Spectrophotometer.
All enzyme activities were expressed per mg of total protein
(specific activity). The total protein content in crude extracts was
determined at 30 °C using bovine serum albumin as a standard based
on the method of Bradford (1976). One unit of enzyme activity was
defined as the amount of NADH or NADPH generated by per mg
protein per minute at 30 °C.
2.5. Calculations and statistical analysis
2.3. Samples collection and chemical analyses
The parameters were calculated as follows:
At the end of the growth trial, spotted babylon were starved for
24 h and weighed. A sample of 135 spotted babylon (B. areolata) at the
initiation of the feeding trial and 25 to 30 spotted babylon per tank at
termination were used for carcass proximate analysis. Shell and soft-
Specific growth rate (SGR) =(Ln Wt − Ln Wi) × 100 / t
Percent weight gain (WG, %) =Wt (g) × 100 / Wi (g)
Feed conversion ratio (FCR) =feed consumed (g, DW)/weight gain (g)
240
L.-L. Zhang et al. / Aquaculture 295 (2009) 238–242
Protein efficiency ratio (PER) =weight gain (g) / protein intake (g)
Soft body to shell ratio (SB/SR) =soft-body weight (g)/shell weight (g)
Mean protein gain (MPG) =SBt · (1 − Mt)·Pt − SBi·(1 − Mi)·Pi
where Wt is final body weight, Wi is initial body weight, t is
experimental times in days, SBt is final soft-body weight (mg), SBi is
initial soft-body weight (mg), Mt is final moisture level in soft body (%),
Mi is initial moisture level in soft body (%), Pt is final protein level in soft
body (%), and Pi is initial protein level in soft body (%) (Mai et al., 1995).
Results are presented as mean ± sd. All data were subjected to oneway ANOVA. When there were significant differences, the group
means were further compared with Duncan's multiple-range test. A
quadratic regression analysis method (Snedecor and Cochran, 1978)
was used to analyze the correlation between weight gain and dietary
wheat starch level of juvenile spotted babylon. All statistical analyses
were performed using the SPSS 15.0 (SPSS, IL USA).
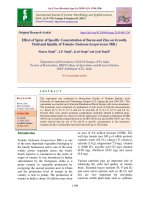
Fig. 1. Relationship between weight gain and dietary carbohydrate levels of juvenile
spotted babylon (B. areolata) fed the experimental diets.
3. Results
Growth performance and feed utilization of juvenile spotted babylon
fed different dietary carbohydrate levels are shown in Table 2. Survival in
all treatments was 100%. Weight gain (WG) and specific growth rate
(SGR) were significantly affected by the dietary carbohydrate levels,
with the highest WG and SGR occurring at the 20% dietary starch level.
WG and SGR significantly increased with dietary starch level from 5% to
20%. However, WG and SGR slightly decreased at dietary starch levels of
20% to 30%. The secondary curve equation between weight gain and
dietary starch level was y=−0.6562x2 +35.541x+50.881 (R2 =0.9372)
(Fig. 1). The optimal dietary starch level was determined to be 27.1% for
maximum weight gain. Feed conversion ratio of spotted babylon fed
dietary starch levels from 5 to 10% was significantly lower than that of
animals fed 15% starch and greater. Protein efficiency ratio significantly
increased with dietary starch level, increasing from 5 to 20%, with no
significant differences among the treatments with over 20% starch. Soft
body to shell ratio was not significantly affected by the dietary starch
levels. Mean protein gain significantly increased with increasing dietary
starch levels from 5 to 20%; there were no significant differences at dietary
starch levels over 20%.
Soft body composition of spotted babylon was significantly
affected by the dietary starch levels (Table 3). Moisture and protein
content in soft body significantly increased with increasing dietary
starch level. However, lipid content in soft body significantly
decreased with increasing dietary starch level. Glycogen content in
soft body significantly increased with dietary starch level from 5 to
25%; however, glycogen content in soft body significantly decreased
when the dietary starch level increased from 25 to 30%.
PFK activities in soft body did not differ among all treatments.
G6PD and FBPase activities were significantly affected by dietary
starch levels (Table 4). The highest G6PD and FBPase activities were
found in animals fed 20% starch. There were no differences in G6PD
among treatments, except for animals fed the 20% starch diet which
had higher activities than those fed the other diets. The FBPase activity
was lowest in spotted babylon fed the 5% dietary starch level, which
was significantly lower than that of animals fed the 20% and 25%
dietary starch diets.
4. Discussion
The present study showed that weight gain of juvenile spotted
babylon increased with increasing wheat starch level from 5 to 20%,
and slightly decreased thereafter with further increase in dietary
wheat starch. A secondary curve equation according to regression
analysis of weight gain against dietary starch level indicated that
optimal dietary starch level for maximum weight gain was 27.1%. These
results are lower than those reported for Haliotis asinine at 47.81%
(Thongrod et al., 2003). The main difference in carbohydrate
utilization between spotted babylon and abalone may be due to the
carnivorous feeding activity of spotted babylon, while abalone is a
herbivorous mollusk. However, the carbohydrate level is higher than
the values reported for shrimp (Alava and Pascual, 1987; Rosas et al.,
2000; Guo et al., 2006) and some fish (Catacutan and Coloso, 1997;
Enes et al., 2006, 2008). The ability of different species to utilize
carbohydrate depends on their ability to oxidize the glucose from the
digestion of carbohydrate, and to store the excess glucose as glycogen
or fat (Guo et al., 2006). Meanwhile, the ability to utilize dietary
carbohydrate as an energy source depends on digestibility, endogenous metabolic enzymes, and assimilation of different dietary carbohydrates (Stone et al., 2003).
The incorporation of appropriate carbohydrate levels in the diet
has been reported to improve growth performance in some fish and
shrimp species (Anderson et al., 1984; Alava and Pascual, 1987; Hemre
et al., 1995; Peragón et al., 1999; Hung et al., 2003). Similar results
were observed in the present study. Both carbohydrate and lipid in the
diet are important energy sources for mollusk species (Mai et al.,
1995). Generally, herbivorous and omnivorous species, such as certain
fish and mollusks, can use higher carbohydrate levels for optimal
growth, and have the ability to utilize carbohydrate for energy.
However, no growth improvement was observed due to dietary starch
incorporation in other species (Hemre et al., 2000; Enes et al., 2006,
2008). In the present study, to keep energy invariable in all
treatments, lipid content decreased when dietary starch level
increased. The growth performance results indicated that spotted
Table 2
Growth performance, feed utilization, SB/S ratio and mean protein gain of juvenile spotted babylon (B. areolata) fed on the experimental diets.
Dietary carbohydrate levels (%)
Initial weight (mg)
Final weight (mg)
Weight gain (%)
SGR
FCR
PER
SB/S ratio
MPG (mg/shell)
5
10
15
20
25
30
167.87 ± 0.81
168.40 ± 1.00
169.07 ± 0.46
168.40 ± 0.69
167.93 ± 0.46
168.67 ± 0.12
546.67 ± 9.59a
720.13 ± 25.15b
846.87 ± 28.01c
1046.09 ± 77.50d
1042.66 ± 32.02d
1045.95 ± 44.78d
225.68 ± 7.26a
327.60 ± 13.02b
400.91 ± 16.68c
548.89 ± 8.10d
520.91 ± 20.73d
520.12 ± 26.25d
1.69 ± 0.03a
2.06 ± 0.05b
2.28 ± 0.02c
2.63 ± 0.01d
2.57 ± 0.03d
2.59 ± 0.09d
1.10 ± 0.04c
0.83 ± 0.04b
0.73 ± 0.02a
0.69 ± 0.01a
0.70 ± 0.02a
0.72 ± 0.05a
1.92 ± 0.06a
2.53 ± 0.13b
2.79 ± 0.06c
3.00 ± 0.01d
2.91 ± 0.07cd
2.86 ± 0.19cd
0.70 ± 0.03
0.71 ± 0.04
0.71 ± 0.06
0.78 ± 0.04
0.74 ± 0.06
0.76 ± 0.05
21.81 ± 2.48a
27.26 ± 1.54ab
32.10 ± 3.83b
46.64 ± 4.34c
44.59 ± 1.85c
48.86 ± 4.28c
Values are means + sem (n = 3). Values in the same column followed by the same letter are not significantly different.
L.-L. Zhang et al. / Aquaculture 295 (2009) 238–242
Table 3
Composition and glycogen content in soft body of juvenile spotted babylon (B. areolata)
fed on the experimental diets.
Dietary carbohydrate
levels (%)
Moisture (%)
Protein (%)⁎
Lipid (%)⁎
Glycogen
(mg/g)
5
10
15
20
25
30
70.37 ± 1.06a
71.42 ± 0.91ab
70.84 ± 0.45ab
72.39 ± 1.04bc
73.04 ± 1.05c
73.17 ± 0.34c
53.51 ± 1.14a
54.28 ± 0.49ab
53.94 ± 0.50ab
54.77 ± 0.48b
57.41 ± 0.03c
59.12 ± 0.49d
17.59 ± 0.60c
17.51 ± 0.92c
16.62 ± 0.20c
16.22 ± 2.40c
10.43 ± 0.03b
7.88 ± 0.19a
26.65 ± 0.04a
29.80 ± 1.02b
29.47 ± 0.74b
31.86 ± 0.94c
44.34 ± 1.97d
29.30 ± 0.39b
241
spotted babylon was not depressed by increasing the dietary starch
level. The activities of the lipogenic enzyme glucose-6-phosphate
dehydrogenase (G6PD) increased in animals fed the high-carbohydrate
diets. This is in agreement with the results reported in some fish (Lin and
Shiau, 1995; Enes et al., 2008).
In conclusion, this study provides some insight into the carbohydrate nutrition of juvenile spotted babylon and indicates that the
optimal carbohydrate (wheat starch) level for juvenile spotted
babylon for maximum weight gain was 27.1%. Dietary starch enhanced
glycolytic and lipogenic pathways in soft body of spotted babylon.
Values are means + sem (n = 3). Values in the same column followed by the same letter
are not significantly different ⁎On dry weight basis.
Acknowledgements
babylon have less ability to utilize higher dietary lipid; similar results
also have been reported in our previous study (Zhou et al., 2007b).
In the present study, glycogen content in soft body significantly
increased when the dietary starch levels increased from 5 to 25%.
However, glycogen content in soft body significantly decreased with the
dietary starch levels increasing from 25 to 30%. Similar results were
observed in gilthead sea bream (Enes et al., 2008). Nevertheless, our
data showed the negative correlation between lipid content in soft body
and dietary starch levels. These results may indicate that when the
dietary lipid was supplied in excess (dietary lipid content was 13.70%), a
proportion of dietary lipid was deposited as lipid not glycogen in soft
body. Protein content in soft body significantly increased with increase
of the dietary starch level, it indicated dietary carbohydrate improved
protein utilization. This is in agreement with the results reported for
some species (Thongrod et al., 2003; Enes et al., 2008).
Several studies have showed that high starch digestibility was
observed in European sea bass (Enes et al., 2006) and gilthead sea bream
(Enes et al., 2008). It indicated that some aquatic fish could decompose
starch into glucose and utilize it well. Such inducible enzymatic response
and digestibility of starch may also contribute to explain the reason why
higher glycogen levels obtained in spotted babylon than those fed higher
starch levels (diets 4 and 5). It appears that carnivorous species make
more efficient use of carbohydrates than herbivorous (Furuichi and
Yone, 1982), however, the result that B. areolata fed on highcarbohydrate diets showed stimulation of key visceral enzymes for
glycolysis and the pentose phosphate pathway suggests its ability to
utilize high-carbohydrate diets in this study.
The activities of phosphofructokinase (PFK) and fructose-1,6-biphosphatase (FBPase) in soft body of spotted babylon fed the diet containing
20% starch had higher activities than those fed the other diets. This is in
agreement with the results reported for some species (Borrebaek and
Christophersen, 2000; Enes et al., 2008). Higher activity of the glycolytic
and gluconeogenesis enzymes may suggest that spotted babylon have
metabolic ability to adapt to high-carbohydrate levels (about 20% to 25%
carbohydrate). Moreover, our data indicated a promotive effect on
FBPase activity with carbohydrate level increasing. These results are
consistent with other results in fish (Metón et al., 1999; Fernández et al.,
2007; Enes et al., 2008). It suggests that endogenous gluconeogenesis in
Table 4
PFK, G6PD and FBPase activities in soft body of juvenile spotted babylon (B. areolata) fed
the experimental diets.
Dietary carbohydrate levels (%)
PFK
(U/mg protein)
G6PD
(U/mg protein)
FBPase
(U/mg protein)
5
10
15
20
25
30
0.96 ± 0.08
0.97 ± 0.03
0.97 ± 0.05
1.06 ± 0.07
1.05 ± 0.07
0.96 ± 0.10
0.97 ± 0.01a
0.97 ± 0.02a
0.99 ± 0.04a
1.10 ± 0.12b
1.00 ± 0.02ab
0.98 ± 0.09a
0.83 ± 0.04a
0.91 ± 0.09ab
0.91 ± 0.09ab
1.03 ± 0.05b
0.99 ± 0.05b
0.96 ± 0.12ab
Values are means + sem (n = 3). Values in the same column followed by the same letter
are not significantly different.
This research was funded by Zhanjiang Science and Technology
Research Program (Project No.20040105). We would like to express
our thanks to the staff of the Aquatic Economic Animal Nutrition and
Feed, Guangdong Ocean University, for maintenance of animal and
analysis of samples.
References
Alava, V.R., Pascual, F.P., 1987. Carbohydrate requirements of Penaeus monodon
(Fabricius) juveniles. Aquaculture 61, 211–217.
Altena, C.O., Van Regteren, Gittenberger, E., 1981. Zoologische Verhandelingen. Leiden
E-Journal of Brill 188, 1–57.
Anderson, J., Jackson, A.J., Matty, A.J., Capper, B.S., 1984. Effects of dietary carbohydrate
and fiber on the tilapia Oreochromis niloticus (Linn.). Aquaculture 37, 303–314.
Association of Official Analytical Chemists (AOAC), 1995. Official methods of analysis of
Official Analytical Chemists International, 16th edition. Association of Official
Analytical Chemists, Arlington, VA, USA.
Bonamusa, L., Garcia de Frutos, P., Fernandez, F., Baanante, I.V., 1992. Nutritional effects
on key glycolytic-gluconeogenic enzyme activities and metabolite levels in the liver
of the teleost fish Sparus aurata. Mole. Mari. Bio. Biotech. 1, 113–124.
Borrebaek, B., Christophersen, B., 2000. Hepatic glucose phosphorylating activities in
perch (Perca fluviatilis) after different dietary treatments. Comp. Biochem. Physiol.
125B, 387–393.
Bradford, M.M., 1976. A rapid and sensitive method for the quantitation of microgram
quantities of protein utilizing the principle of protein-dye binding. Anal. Biochem.
72, 248–254.
Catacutan, M.R., Coloso, R.M., 1997. Growth of juvenile Asian seabass, Lates calcarifer, fed
varying carbohydrate and lipid levels. Aquaculture 149, 137–144.
Enomoto, T., Nakao, C., Ohyama, H., 2000. Regulation of glycolysis during acclimation of
scallops (Patinopecten yessoensis Jay) to anaerobiosis. Comp. Biochem. Physiol.
127B, 45–52.
Enes, P., Panserat, S., Kaushik, S., Oliva-Teles, A., 2006. Effect of normal and waxzy maize
starch on growth, food utilization and hepatic glucose metabolism in European sea
bass (Dicentrarchus labrax) juveniles. Comp. Biochem. Physiol. 143A, 89–96.
Enes, P., Panserat, S., Kaushik, S., Oliva-Teles, A., 2008. Growth performance and
metabolic utilization of diets with native and waxy maize starch by gilthead sea
bream (Sparus aurata) juveniles. Aquaculture 274, 101–108.
Fernández, F., Miquel, A.G., Córdoba, M., Varas, M., Metón, I., Caseras, A., Baanante, I.V.,
2007. Effects of diets with distinct protein-to-carbohydrate ratios on nutrient
digestibility, growth performance, body composition and liver intermediary
enzyme activities in gilthead sea bream (Sparus aurata, L.) fingerlings. J. Experi.
Mar. Biol. Ecol. 343, 1–10.
Foste, G.D., Moon, T.W., 1985. Enzyme activities in Atlantic hagfish, Myxine glutinosa:
changes with capacity and food deprivation. Can. J. Zool. 64, 1080–1085.
Furuichi, M., Yone, Y., 1982. Changes in activities of hepatic enzymes related to
carbohydrate metabolism of fishes in glucose and insulin-glucose tolerance tests
Chrysophrys major, Cyprinus carpio, Seriola quinqueradiata. Bull. Jpn. Soc. Sci. Fish.
48, 463–466.
Garcia de Frutos, P., Bonamusa, L., Fernández, F., Baanante, I.V., 1990. Fructose 2, 6bisphosphate in liver of Sparus aurata. Comp. Biochem. Physiol. 96B, 63–65.
Guo, R., Liu, Y.J., Tian, L.X., Huang, J.W., 2006. Effect of dietary cornstarch levels on
growth performance, digestibility and microscope structure in the white shrimp,
Litopenaeus vannamei reared in brackish water. Aquac. Nutr. 12, 83–88.
Hemre, G.I., Sandnes, K., Lie, Ø., Torrissen, O., Waagbø, R., 1995. Carbohydrate nutrition
in Atlantic salmon, Salmo salar L.: growth and feed utilization. Aquac. Res. 26,
149–154.
Hemre, G.I., Shiau, S.Y., Deng, D.F., Storebakken, T., Hung, S.S.O., 2000. Utilization of
hydrolysed potato starch by juvenile Atlantic salmon Salmo salar L., when using a
restricted feeding regime. Aquac. Res. 31, 207–212.
Hung, L.T., Lazard, J., Mariojouls, C., Moreau, Y., 2003. Comparison of starch utilization in
fingerlings of two Asian catfishes from the Mekong River (Pangasius bocourti
Sauvage, 1880, Pangasius hypophthalmus Sauvage, 1878. Aquac. Nutr. 9, 215–222.
Ke, C.H., Fu, Y., Tang, H., Zhou, S.Q., Li, F.X., 1997. Studies on food diet and digestive rate of
dietary protein for the ivory shell (Babylonia formosae habei). Mar. Sci. 5, 5–7 (In Chinese
with English abstract).
242
L.-L. Zhang et al. / Aquaculture 295 (2009) 238–242
Ke, C.H., Fu, Y., Tang, H., Zhou, S.Q., Li, F.X., 2007. Protein and lipid requirement in ivory
shell Babylonia areolata. In2007 Aquaculture, Science for Sustainable Aquaculture,
Texas (USA. 26 Feb-2 Mar 2007.
Keshavanath, P., Manjappa, K., Gangadhara, B., 2002. Evaluation of carbohydrate rich
diets through common carp culture in manured tanks. Aquac. Nutr. 8, 169–174.
Kritsanapuntu, S., Chaitanawisuti, N., Natsukari, Y., 2009. Growth and water quality for
growing-out of juvenile spotted Babylon, Babylonia areolata, at different waterexchange regimes in a large-scale operation of earthen ponds. Aquacult. Int. 17, 77–84.
Lin, J.H., Shiau, S.Y., 1995. Hepatic enzyme adaptation to different dietary carbohydrates
in juvenile tilapia Oreochromis niloticus × O. aureus. Fish Physiol. Biochem. 14,
165–170.
Liu, D.J., Xiao, S.Q., 1998. Preliminary study on ecology of Babylonia formosae. J. Fish. Sci.
China 5, 93–96 (In Chinese with English abstract).
Mai, K.S., Mercer, J.P., Donlon, J., 1995. Comparative studies on the nutrition of two
species of abalone. Haliotis tuberculate L. and Haliotis discus hannai Ino. III.
Response to various levels of dietary lipid. Aquaculture 134, 65–80.
Metón, I., Mediavilla, D., Caseras, A., Cantó, E., Fernández, F., Baanante, I.V., 1999. Effect of
diet composition and ration size on key enzyme activities of glycolysisgluconeogenesis, the pentose phosphate pathway and amino acid metabolism in
liver of gilthead sea bream (Sparus aurata). Bri. J. Nutr. 82, 223–232.
Metón, I., Fernández, F., Baanante, I.V., 2003. Short - and long- term effects of refeeding on
key enzyme activities in glycolysis–gluconeogenesis in the liver of gilthead seabream
(Sparus aurata). Aquaculture 225, 99–107.
Peragón, J., Barroso, J.B., García-Salguero, L., Aranda, F., de la Higuera, M., Lupiáñez, J.A., 1999.
Selective changes in the protein-turnover rates and nature of growth induced in trout
liver by long-term starvation followed by re-feeding. Mole. Cell. Biochem. 201, 1–10.
Rosas, C., Cuzon, G., Gaxiola, G., Arena, L., Lemaire, P., Soyez, C., Van Wormhoudt, A.,
2000. Influence of dietary carbohydrate on the metabolism of juvenile Litopenaeus
stylirostris. J. Experi. Mari. Biol. Ecol 249, 181–198.
Shiau, S.Y., Lin, Y.H., 2001. Carbohydrate utilization and its protein-sparing effect in diets
for grouper (Epinephelus malabaricus). Brit. Soc. Ani. Sci. 73, 299–304.
Snedecor, G.W., Cochran, W.G., 1978. Statistical methods, 6. Iowa State University Press,
Ames. IA.
Stone, D.A.J., Allan, G.L., Anderson, A.J., 2003. Carbohydrate utilization by juvenile silver
perch, Bidyanus bidyanus (Mitchell). III. The protein-sparing effect of wheat starchbased carbohydrates. Aquac. Res. 34, 123–134.
Thongrod, S., Tamtin, M., Chairat, C., Boonyaratpalin, M., 2003. Lipid to carbohydrate ratio in
donkey's ear abalone (Haliotis asinina, Linne) diets. Aquaculture 225, 165–174.
Xu, Y.B., Ke, C.H., Wang, D.X., Wei, Y.J., Lv, J.Q., 2006. Studies on protein requirement of
Babylonia areolata Link. J. Xiamen Univ. (Natural Science) China 45, 216–220 In
Chinese with English abstract.
Zhou, J.B., Zhou, Q.C., Chi, S.Y., Yang, Q.H., Liu, C.W., 2007a. Optimal dietary protein
requirement for juvenile ivory shell, Babylonia areolata. Aquaculture 270, 186–192.
Zhou, Q.C., Zhou, J.B., Chi, S.Y., Yang, Q.H., Liu, C.W., 2007b. Effect of dietary lipid level on
growth performance, feed utilization and digestive enzyme of juvenile ivory shell,
Babylonia areolata. Aquaculture 272, 535–540.